©The Author(s) 2025.
World J Diabetes. Oct 15, 2025; 16(10): 109782
Published online Oct 15, 2025. doi: 10.4239/wjd.v16.i10.109782
Published online Oct 15, 2025. doi: 10.4239/wjd.v16.i10.109782
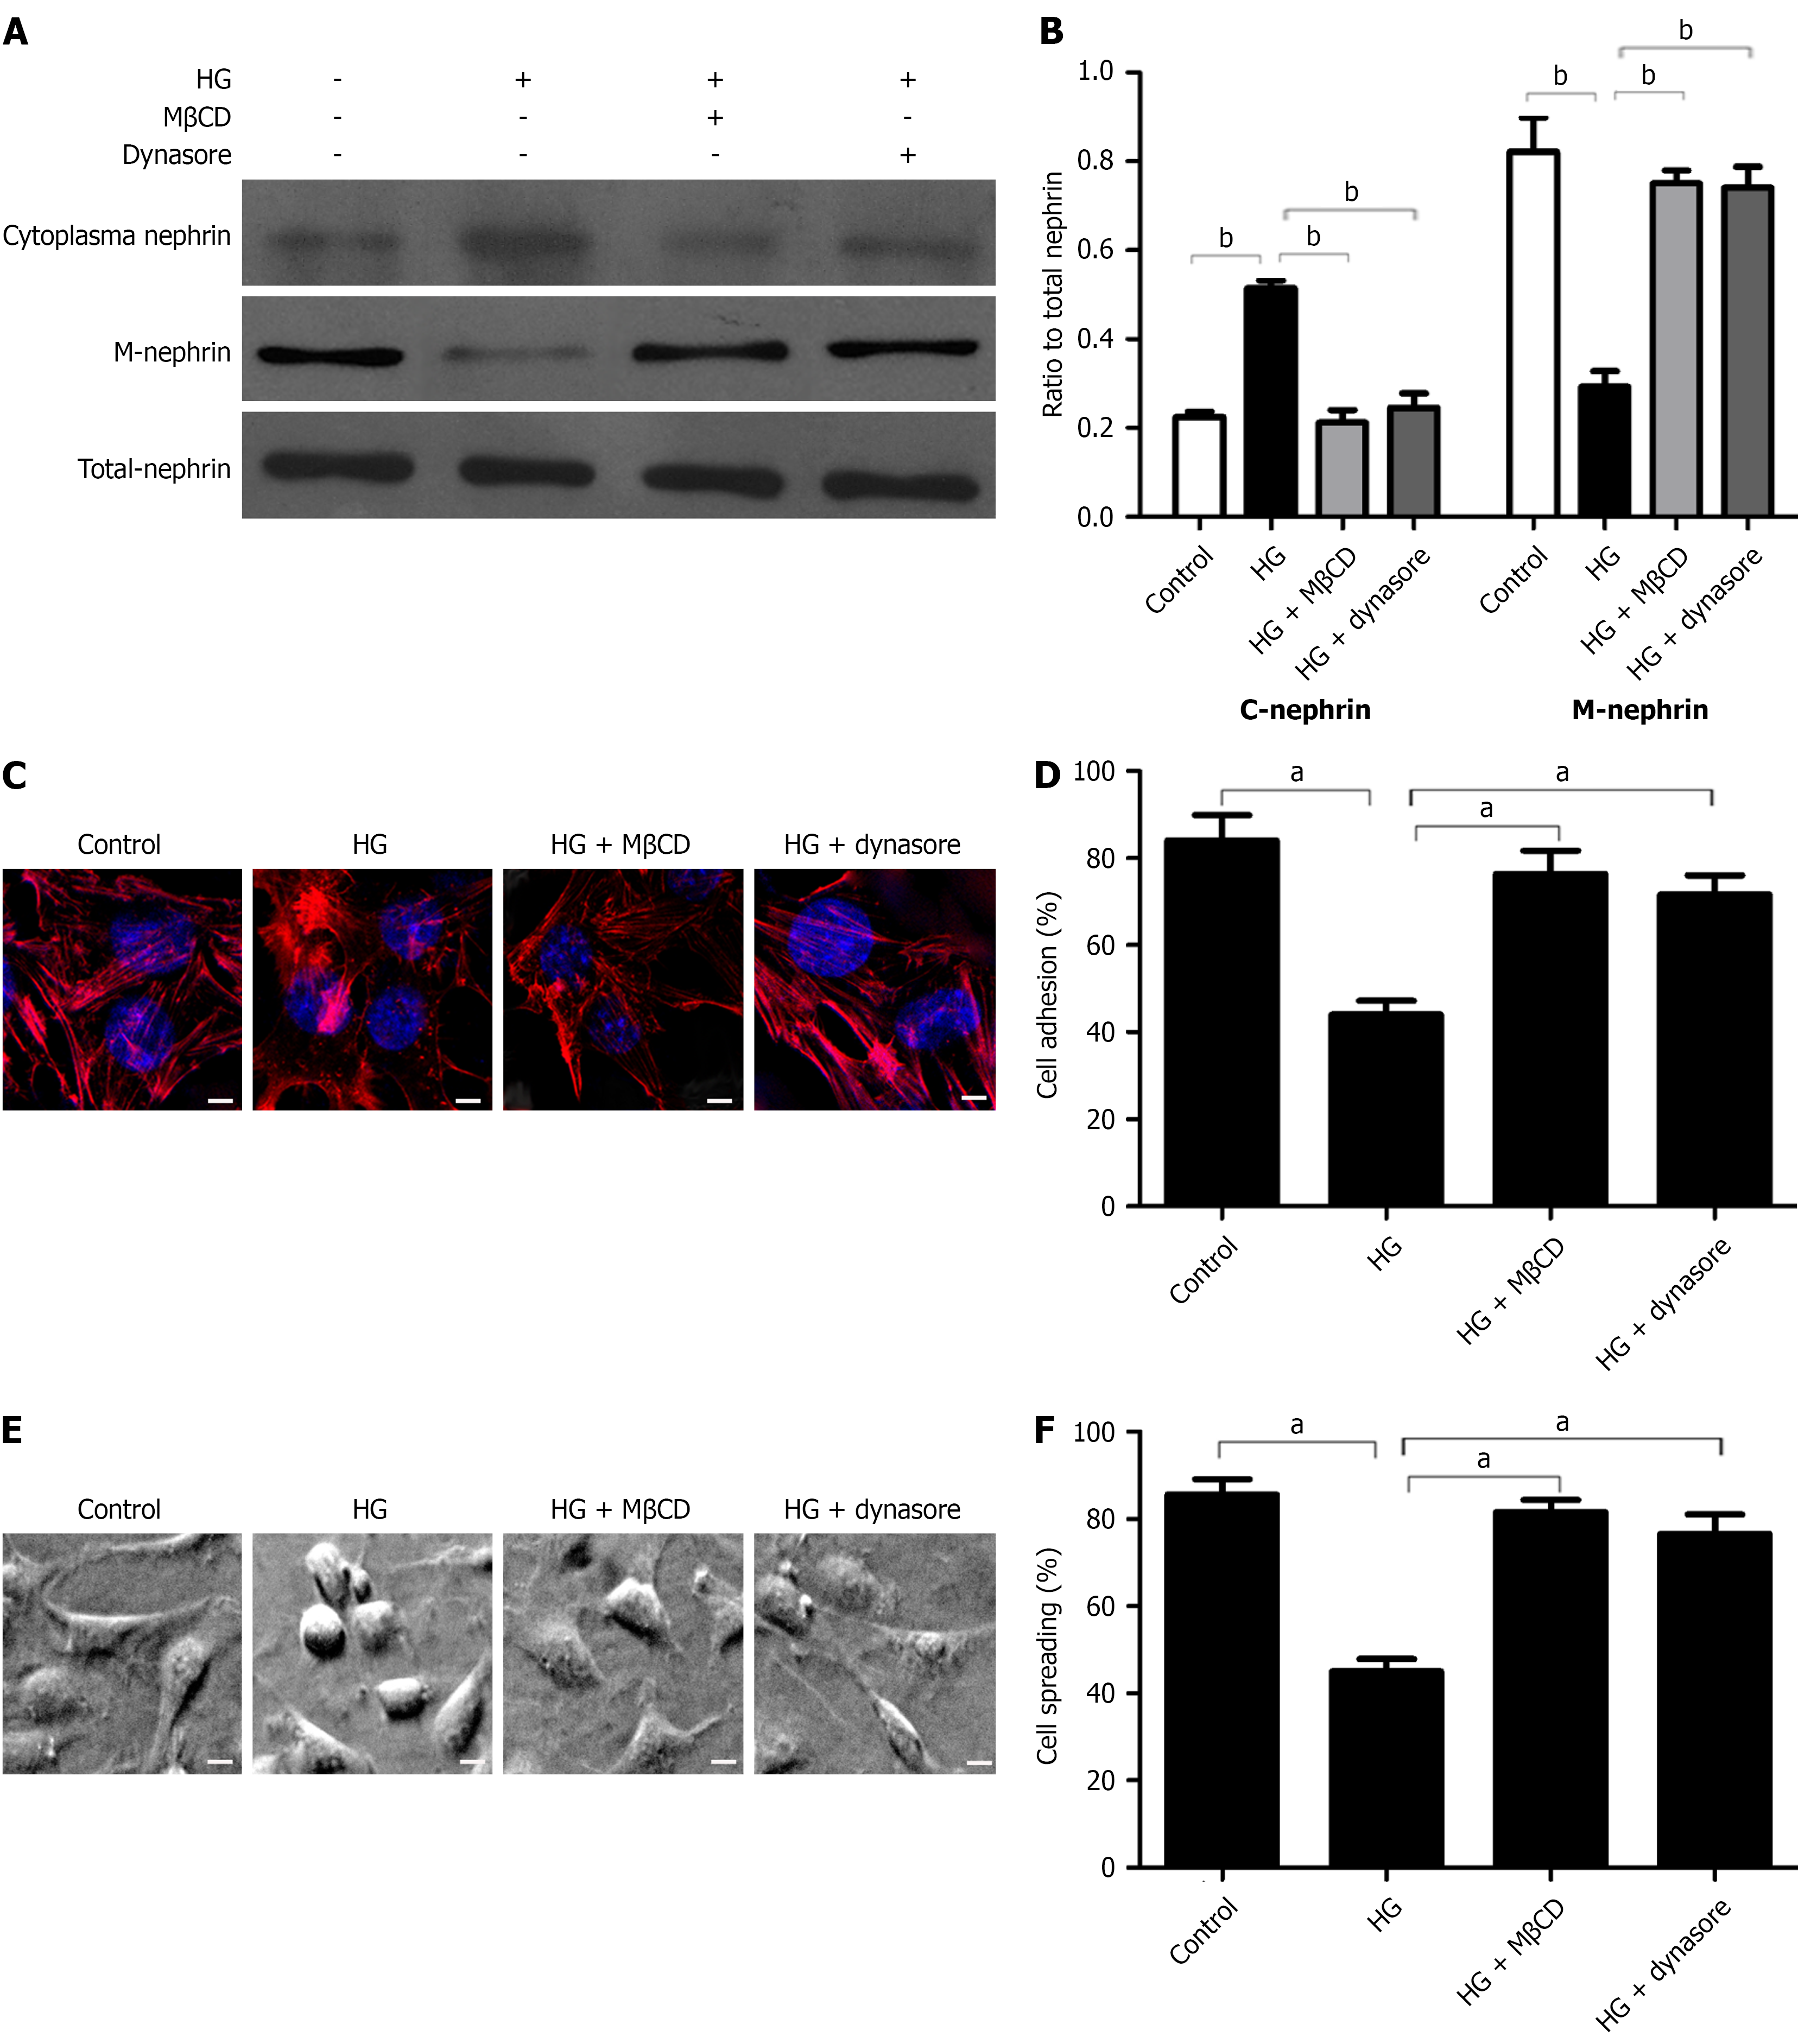
Figure 1 High-dose glucose-induced nephrin endocytosis promotes podocyte injury and endocytosis inhibitors block this effect.
A and B: Western blot analysis of cytoplasmic nephrin, membrane nephrin, and total nephrin in podocytes after different treatments and densitometric quantification of these results (n = 3); C: Representative confocal microscopy images of podocytes after different treatments (magnification: × 1000; scale bar: 50 μm; blue: Nuclei; red: Cytoskeleton); D: Adhesion of podocytes after different treatments (n = 3); E and F: Representative electron microscopy images of podocyte spreading after different treatments (magnification: × 400; scale bar: 20 μm) and quantification of these results (n = 3). aP < 0.05; bP < 0.001. HG: High-dose glucose.
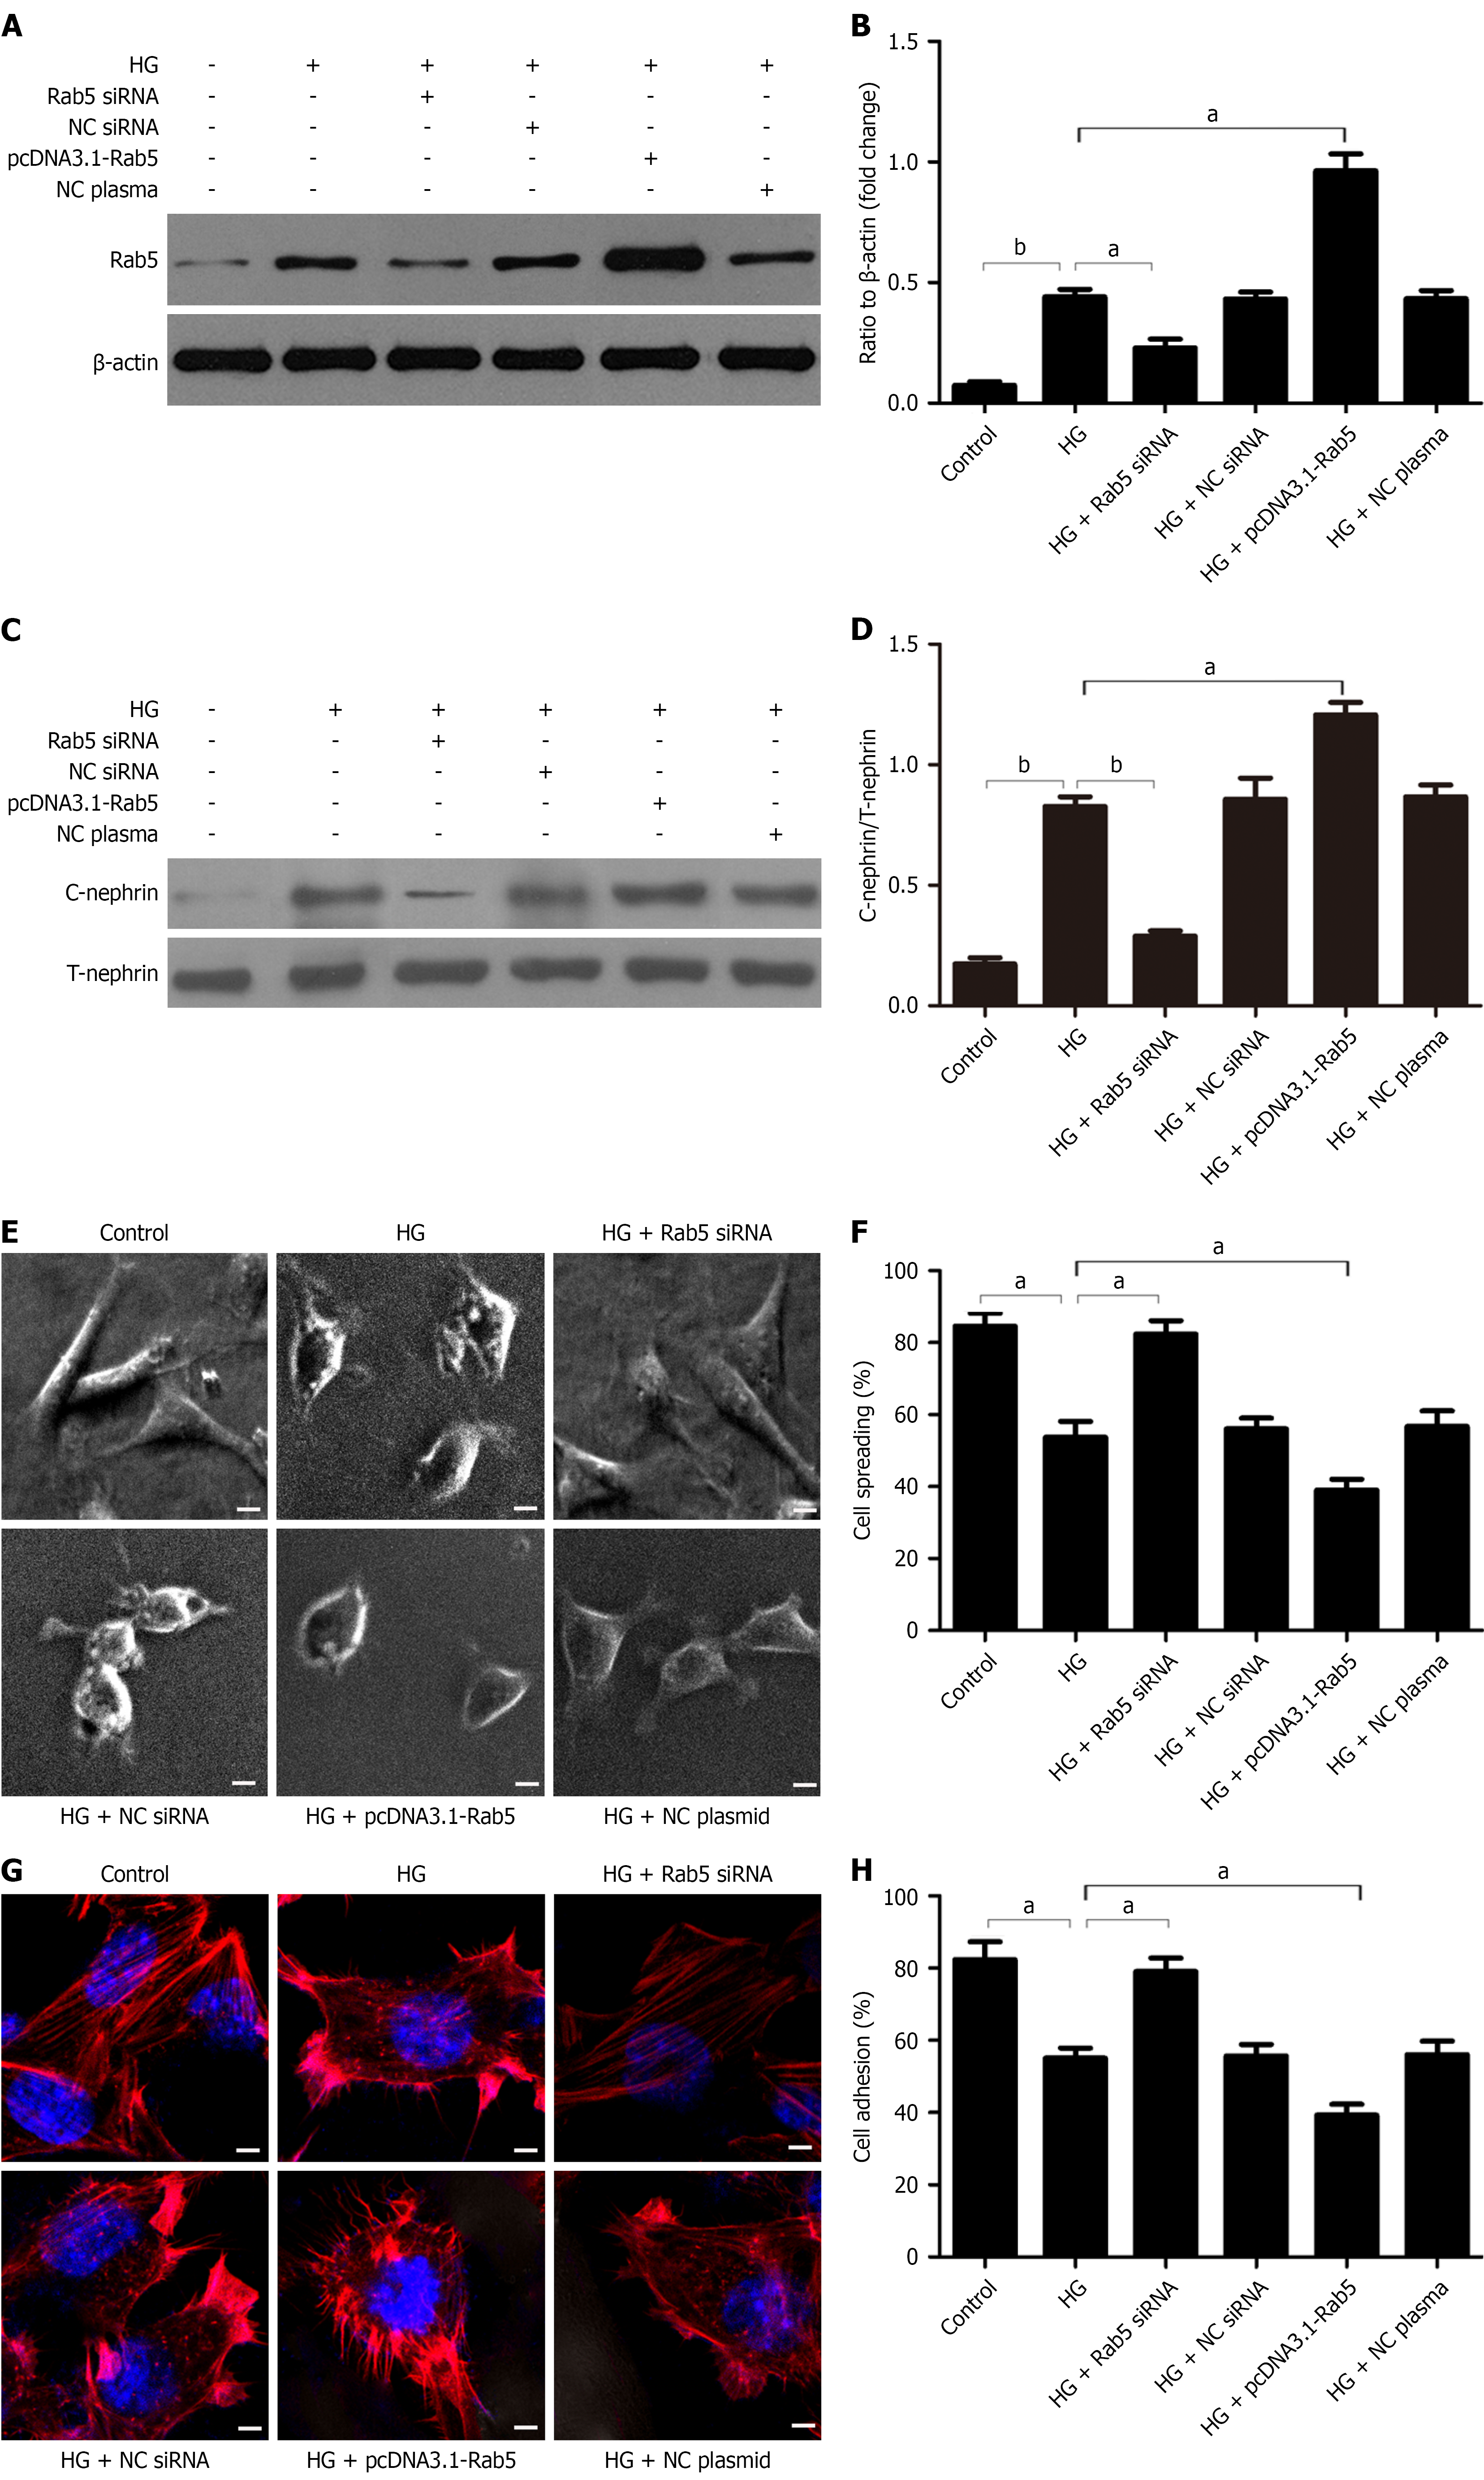
Figure 2 Rab5 promotes podocyte injury by increasing nephrin endocytosis, Rab5 silencing blocks this effect, and Rab5 upregulation promotes this effect.
A and B: Western blot analysis of Rab5 in podocytes after different treatments and densitometric quantification of these results (n = 3); C and D: Western blot analysis of cytoplasmic nephrin (C-nephrin) and total nephrin (T-nephrin) in podocytes after different treatments and densitometric quantification of the C-nephrin/T-nephrin ratio (n = 3); E and F: Representative electron microscopy images of podocyte spreading after different treatments (magnification: × 1000; scale bar: 50 μm) and quantification of these results (n = 3); G: Representative confocal microscopy images of podocytes after different treatments (magnification: × 1000; scale bar: 50 μm; blue nuclei; red: Cytoskeleton); H: Adhesion of podocytes after different treatments (n = 3). aP < 0.05; bP < 0.001. HG: High-dose glucose; NC: Negative control.
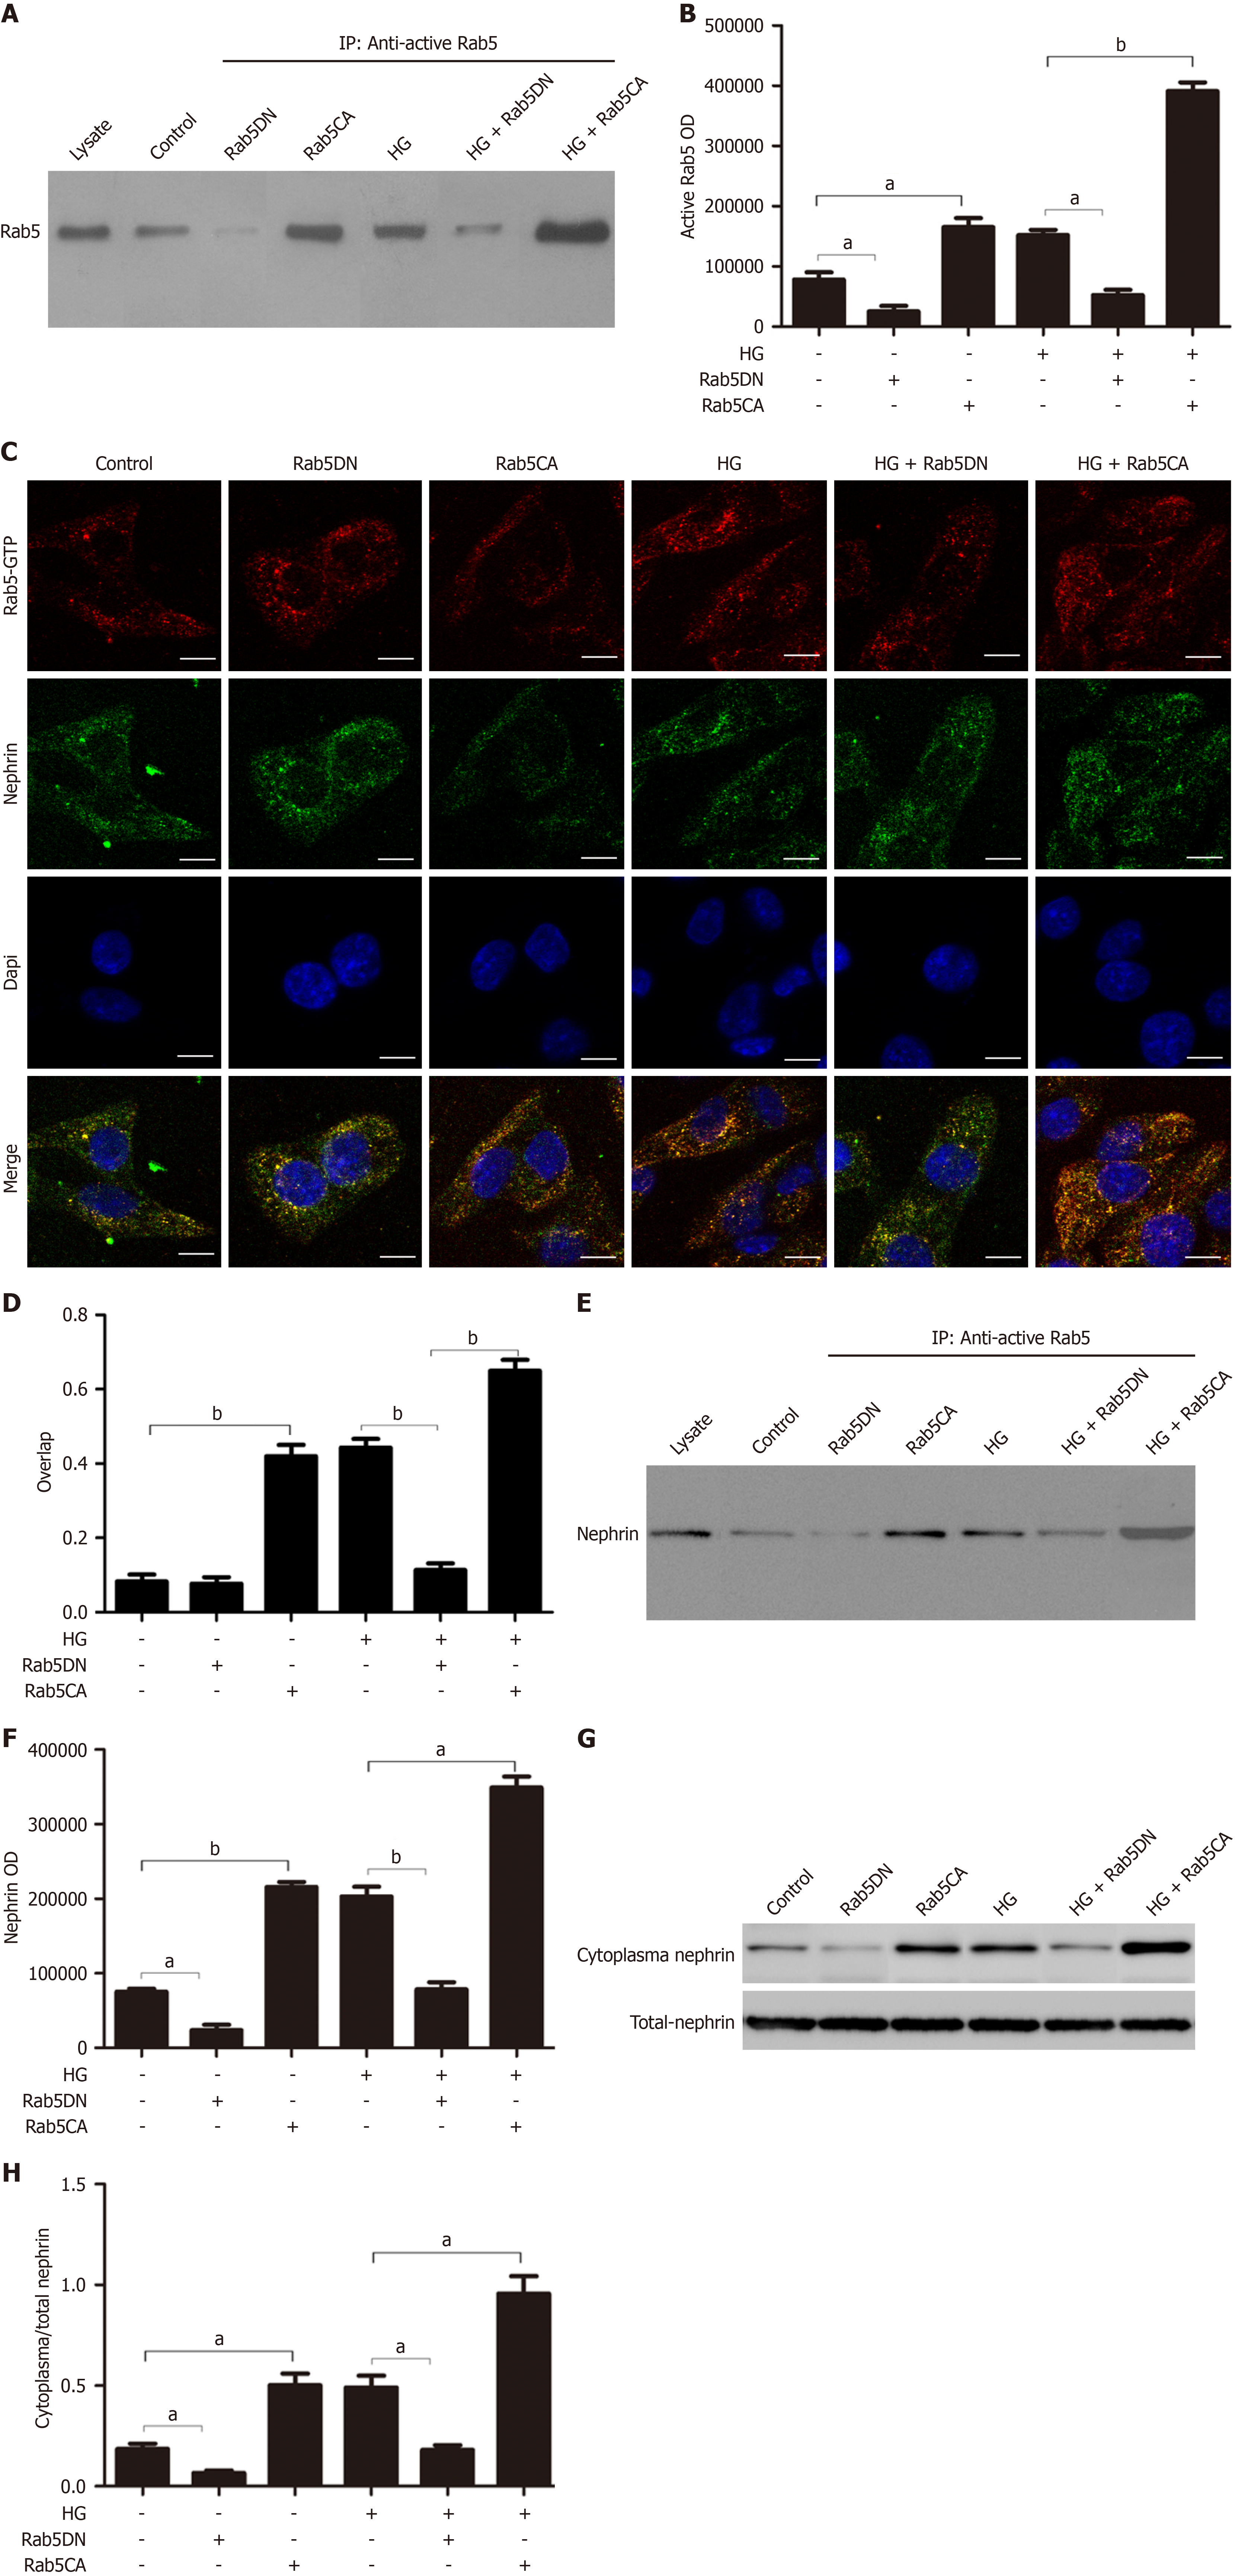
Figure 3 Rab5-mediated nephrin endocytosis by podocytes depends on Rab5 activation.
A and B: Co-immunoprecipitation of active Rab5 (Rab5-GTP) in podocytes after different treatments and quantification of these results (n = 3); C and D: Representative co-localization images and quantitative of nephrin (green) and active Rab5 (red) in podocytes after different treatments (magnification: × 630; Scale bar: 20 μm); E and F: Co-immunoprecipitation of nephrin and active Rab5 in podocytes after different treatments and quantification of these results (n = 3); G and H: Western blot analysis of cytoplasmic nephrin and total nephrin in podocytes after different treatments and quantification of the C-nephrin/T-nephrin ratio (n = 3). aP < 0.05; bP < 0.001. HG: High-dose glucose.
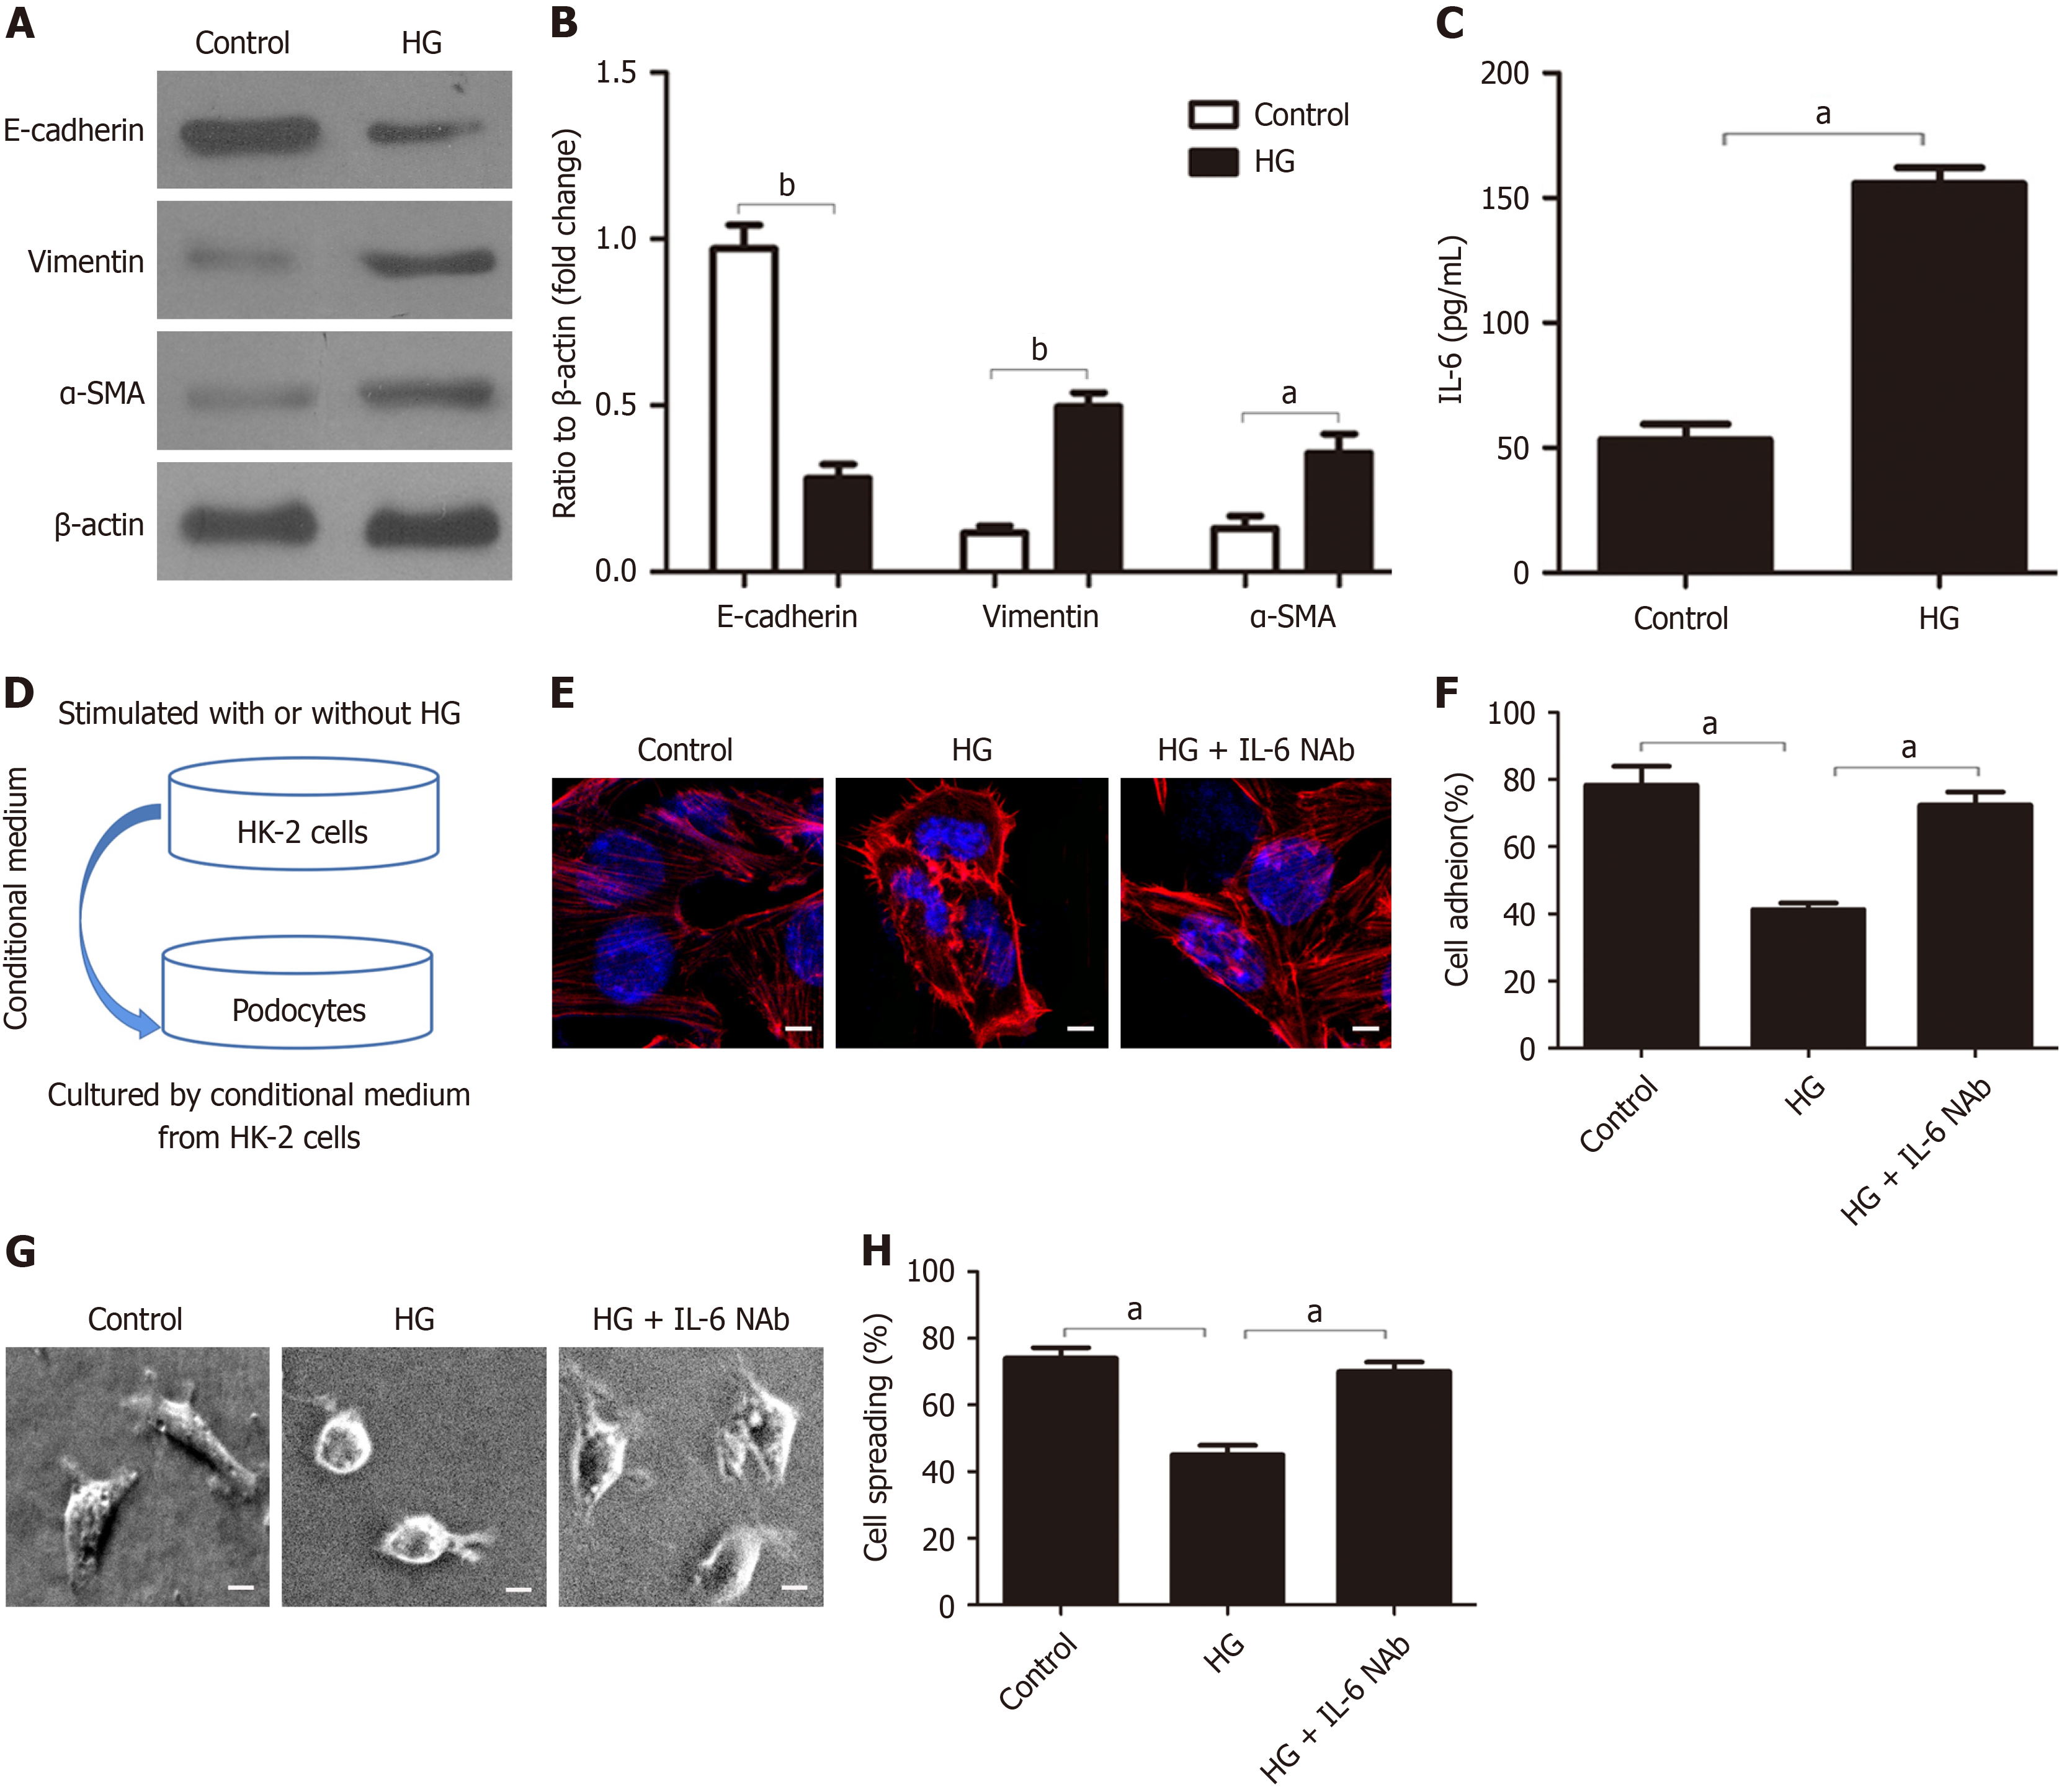
Figure 4 IL-6 secretion by HK-2 cells contributes to the HG-induced injury of podocytes.
A and B: Western blot analysis of E-cadherin, vimentin, and α-SMA in HK-2 cells after different treatments and quantification of these results (n = 3); C: ELISA measurements of IL-6 after different treatments (n = 3); D: Method used to examine the effect of HK-2 conditioned medium on podocytes; E: Representative confocal microscopy images of podocytes after culture in different conditioned media (magnification: × 1000; scale bar: 50 μm; blue: Nuclei: Red: Cytoskeleton); F: Quantitative analysis of podocyte adhesion after culture in different conditioned media (n = 3); G and H: Representative electron microscopy images of podocyte spreading after culture in different conditioned media (magnification: × 400; scale bar: 20 μm) and quantification of these results (n = 3). aP < 0.05; bP < 0.001. HG: High-dose glucose; NAb: Neutralizing Ab.
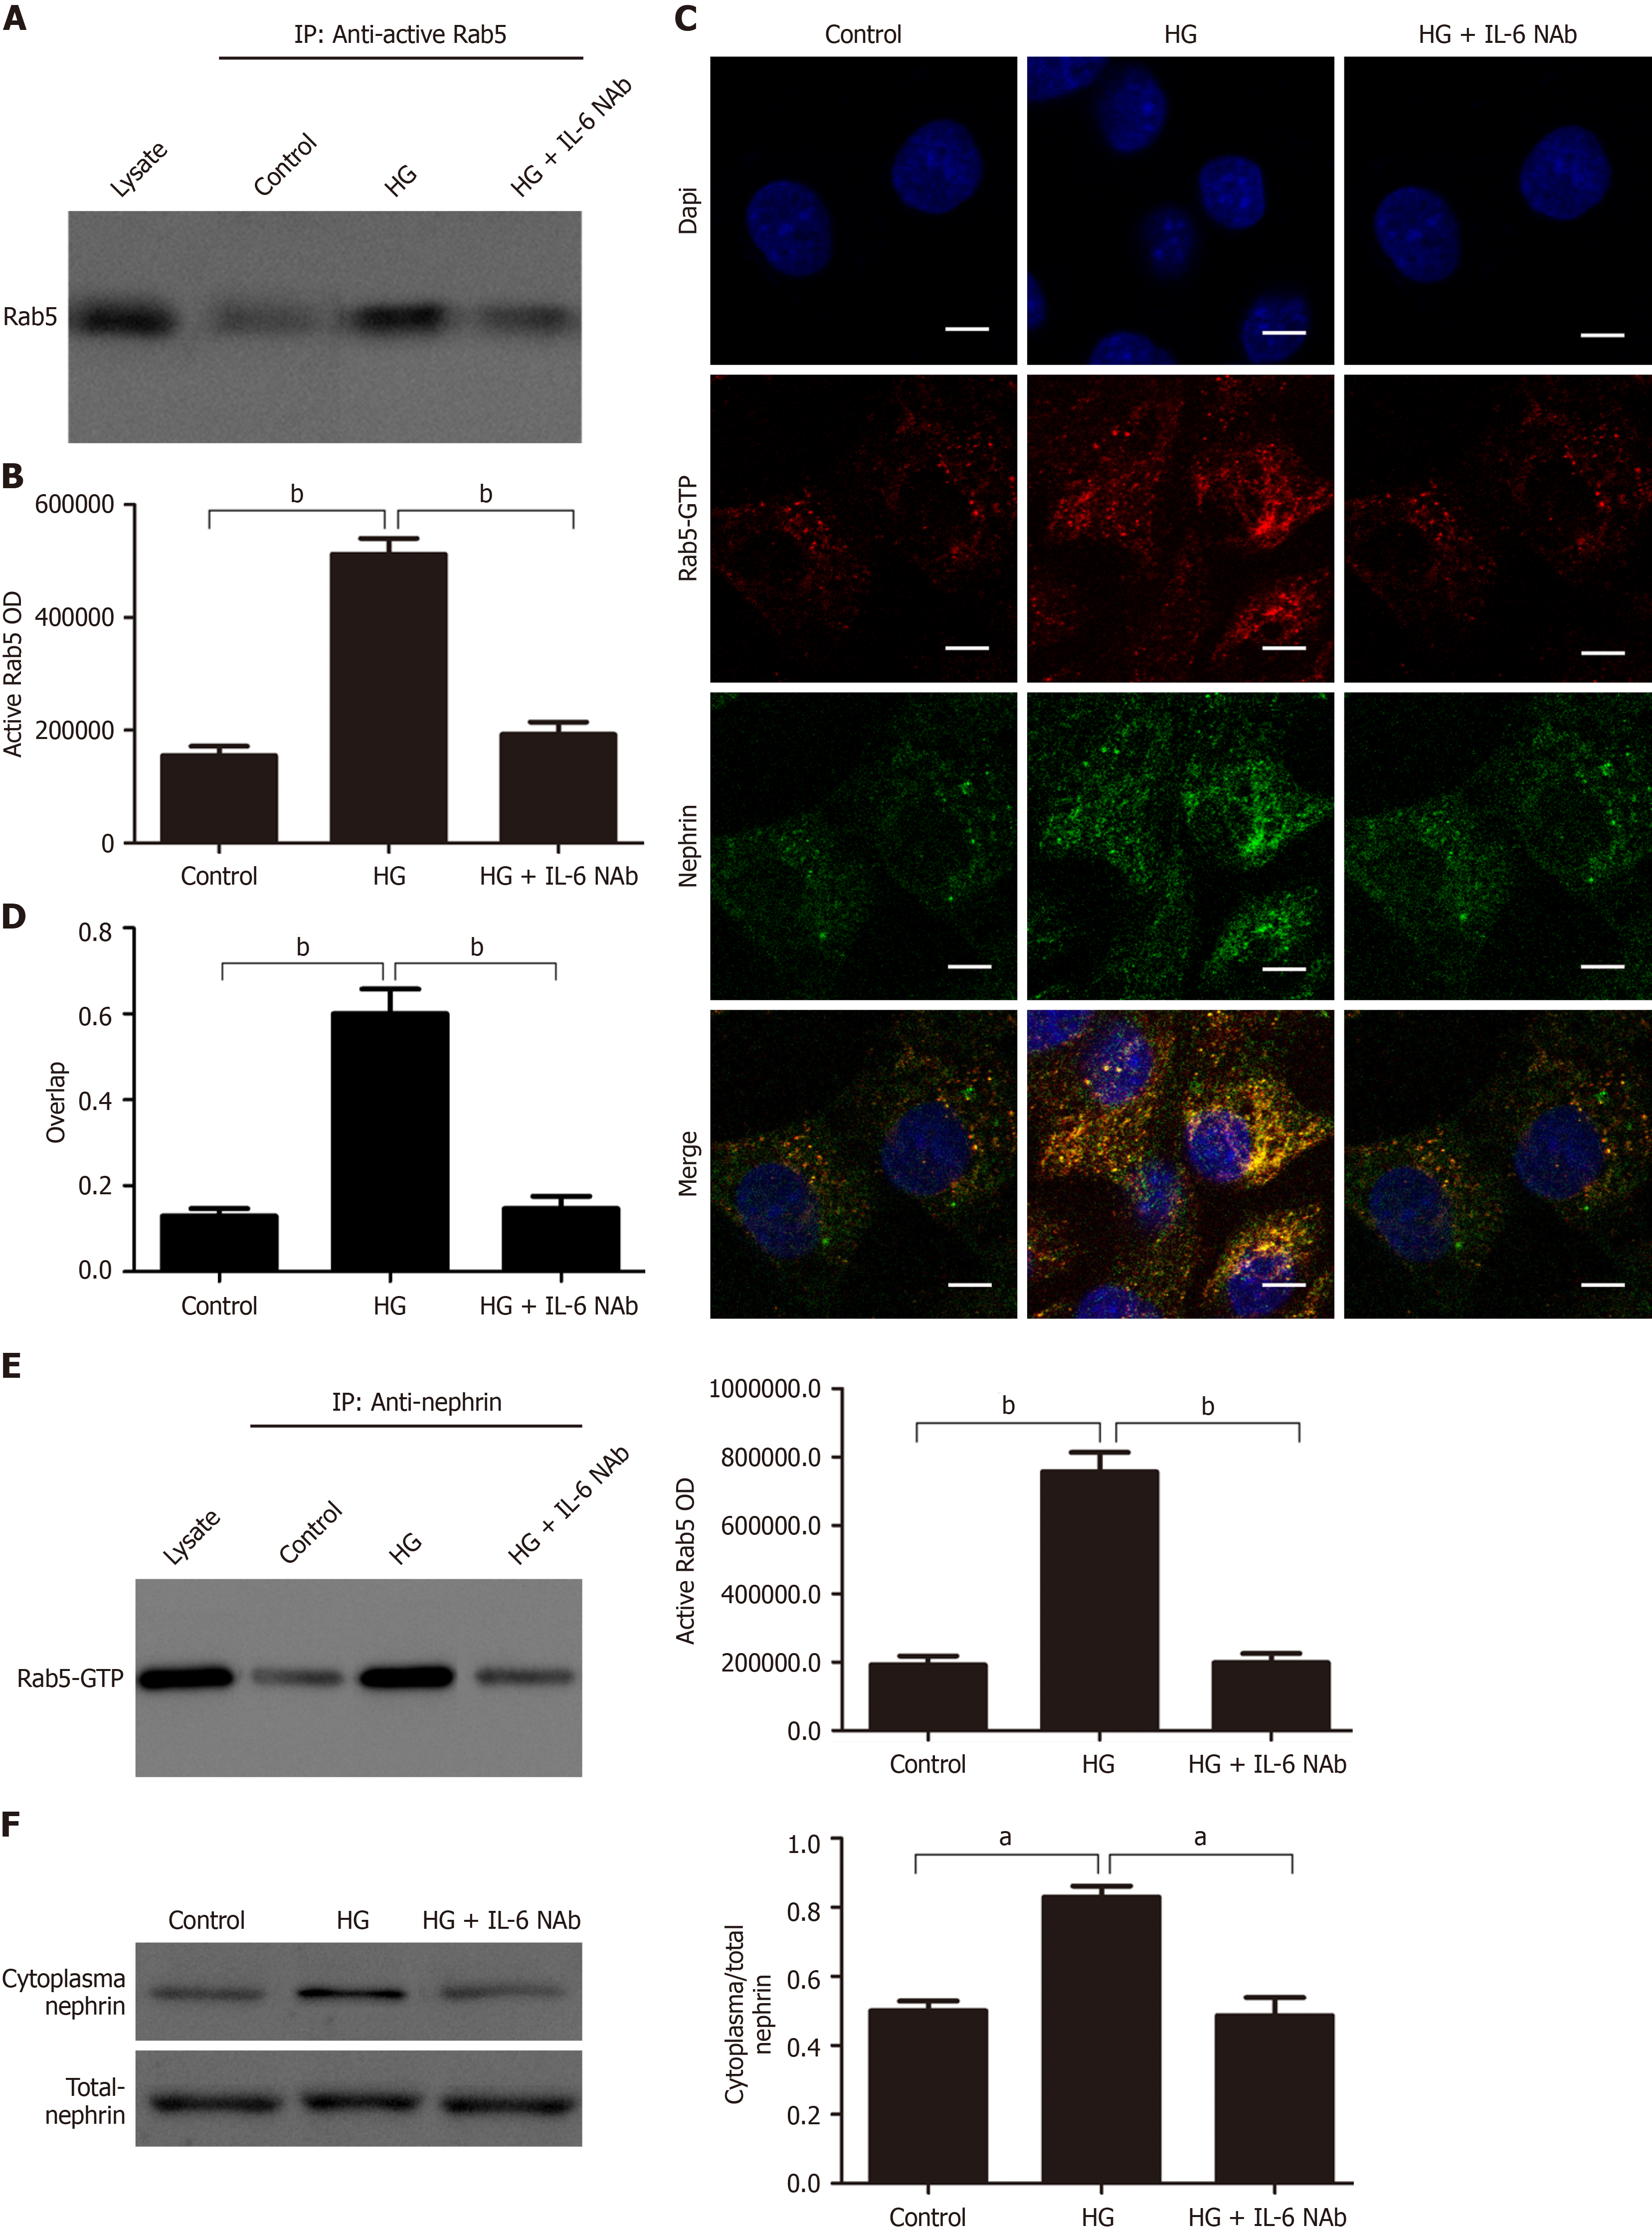
Figure 5 IL-6/Rab5 signaling mediates nephrin endocytosis in podocytes by promoting crosstalk between HK-2 cells and podocytes.
A and B: Co-immunoprecipitation of active Rab5 (Rab5-GTP) in podocytes cultured in different conditioned media and quantification of these results (n = 3); C and D: Representative co-localization images and quantitative of nephrin (green) and active Rab5 (red) in podocytes grown in different conditioned media (magnification: × 630; scale bar: 20 μm); E: Co-immunoprecipitation of nephrin and active Rab5 in podocytes grown in different conditioned media and quantification of these results (n = 3; F: Western blot analysis of cytoplasmic nephrin (C-nephrin) and total nephrin (T-nephrin) after growth in different conditioned media and quantification of the C-nephrin/T-nephrin ratio (n = 3). aP < 0.05; bP < 0.001. HG: High-dose glucose; NAb: Neutralizing Ab.
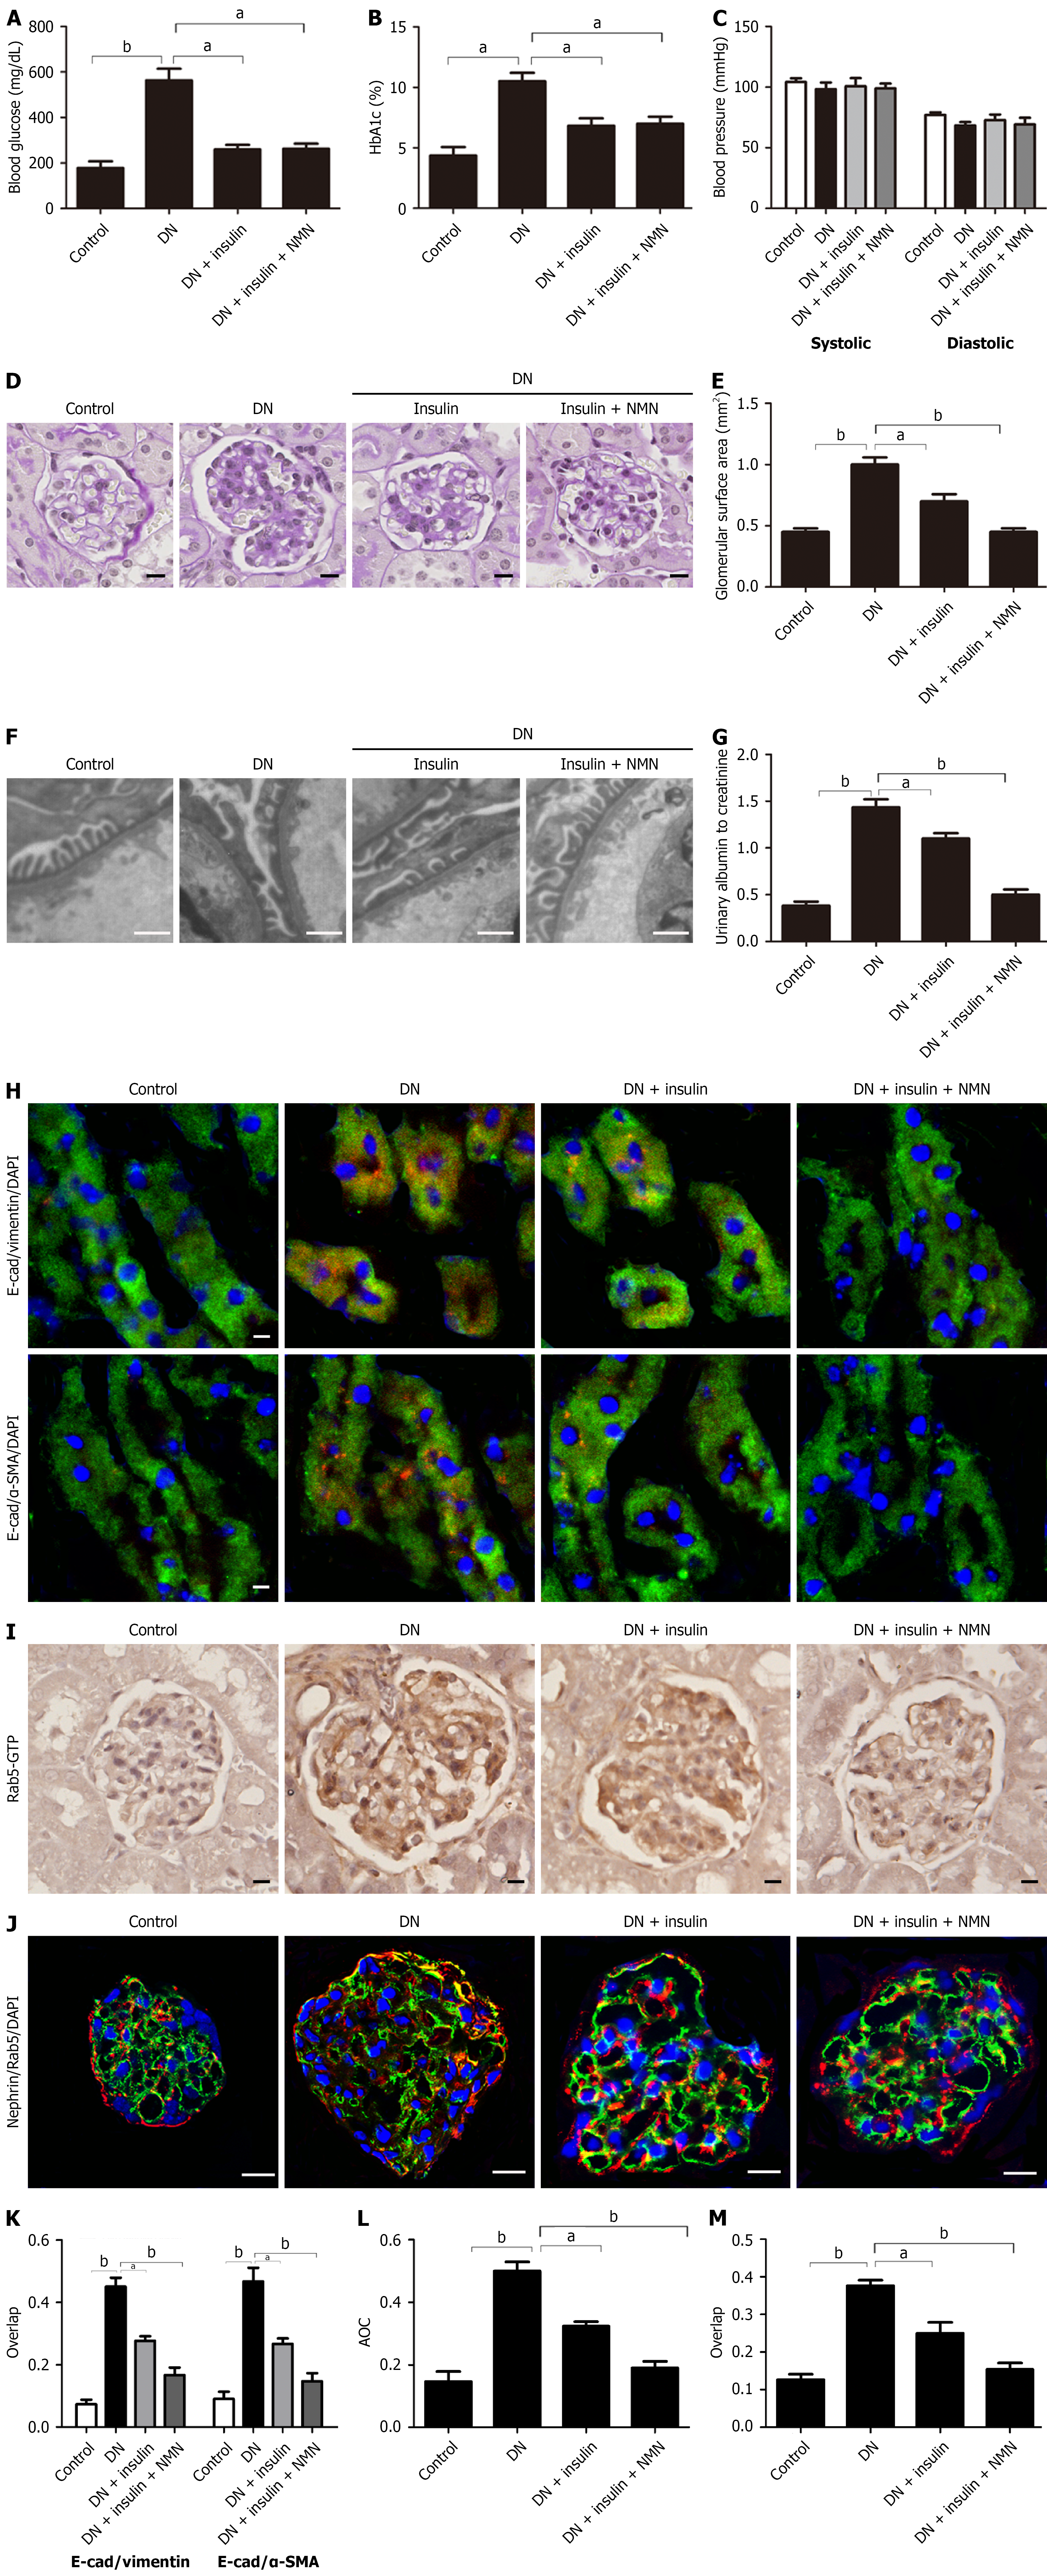
Figure 6 Nicotinamide mononucleotide alleviates podocyte injury in diabetic mice.
A and B: Blood glucose and HbA1c levels in the different groups; C: Systolic and diastolic blood pressure in the different groups; D and E: Representative PAS staining (magnification × 400; scale bar: 50 μm) and quantification of the glomerular surface area in different groups (n = 10 glomeruli/group); F: Representative electron microscopy images of podocyte foot process effacement in the different groups (magnification × 10,000; scale bar: 100 μm); G: Urinary albumin excretion (albumin/creatinine ratio) in the different groups (n = 5); H and I: Co-localization images and quantification of the epithelial-to-mesenchymal transition, indicated by altered E-cadherin and α-SMA expression, in the different groups (magnification × 630; scale bar: 20 μm); J and K: Immunohistochemical staining and quantification of glomerular expression of Rab5-GTP in the different groups (magnification × 400; scale bar: 20 μm); L and M: Immunofluorescence co-localization and quantification of nephrin and active Rab5 (Rab5-GTP) in the different groups (magnification × 630; scale bar: 20 μm). Data are expressed as mean ± SEM. aP < 0.05; bP < 0.001. DN: Diabetic nephropathy; NMN: Nicotinamide mononucleotide; AOC: Area of coverage.
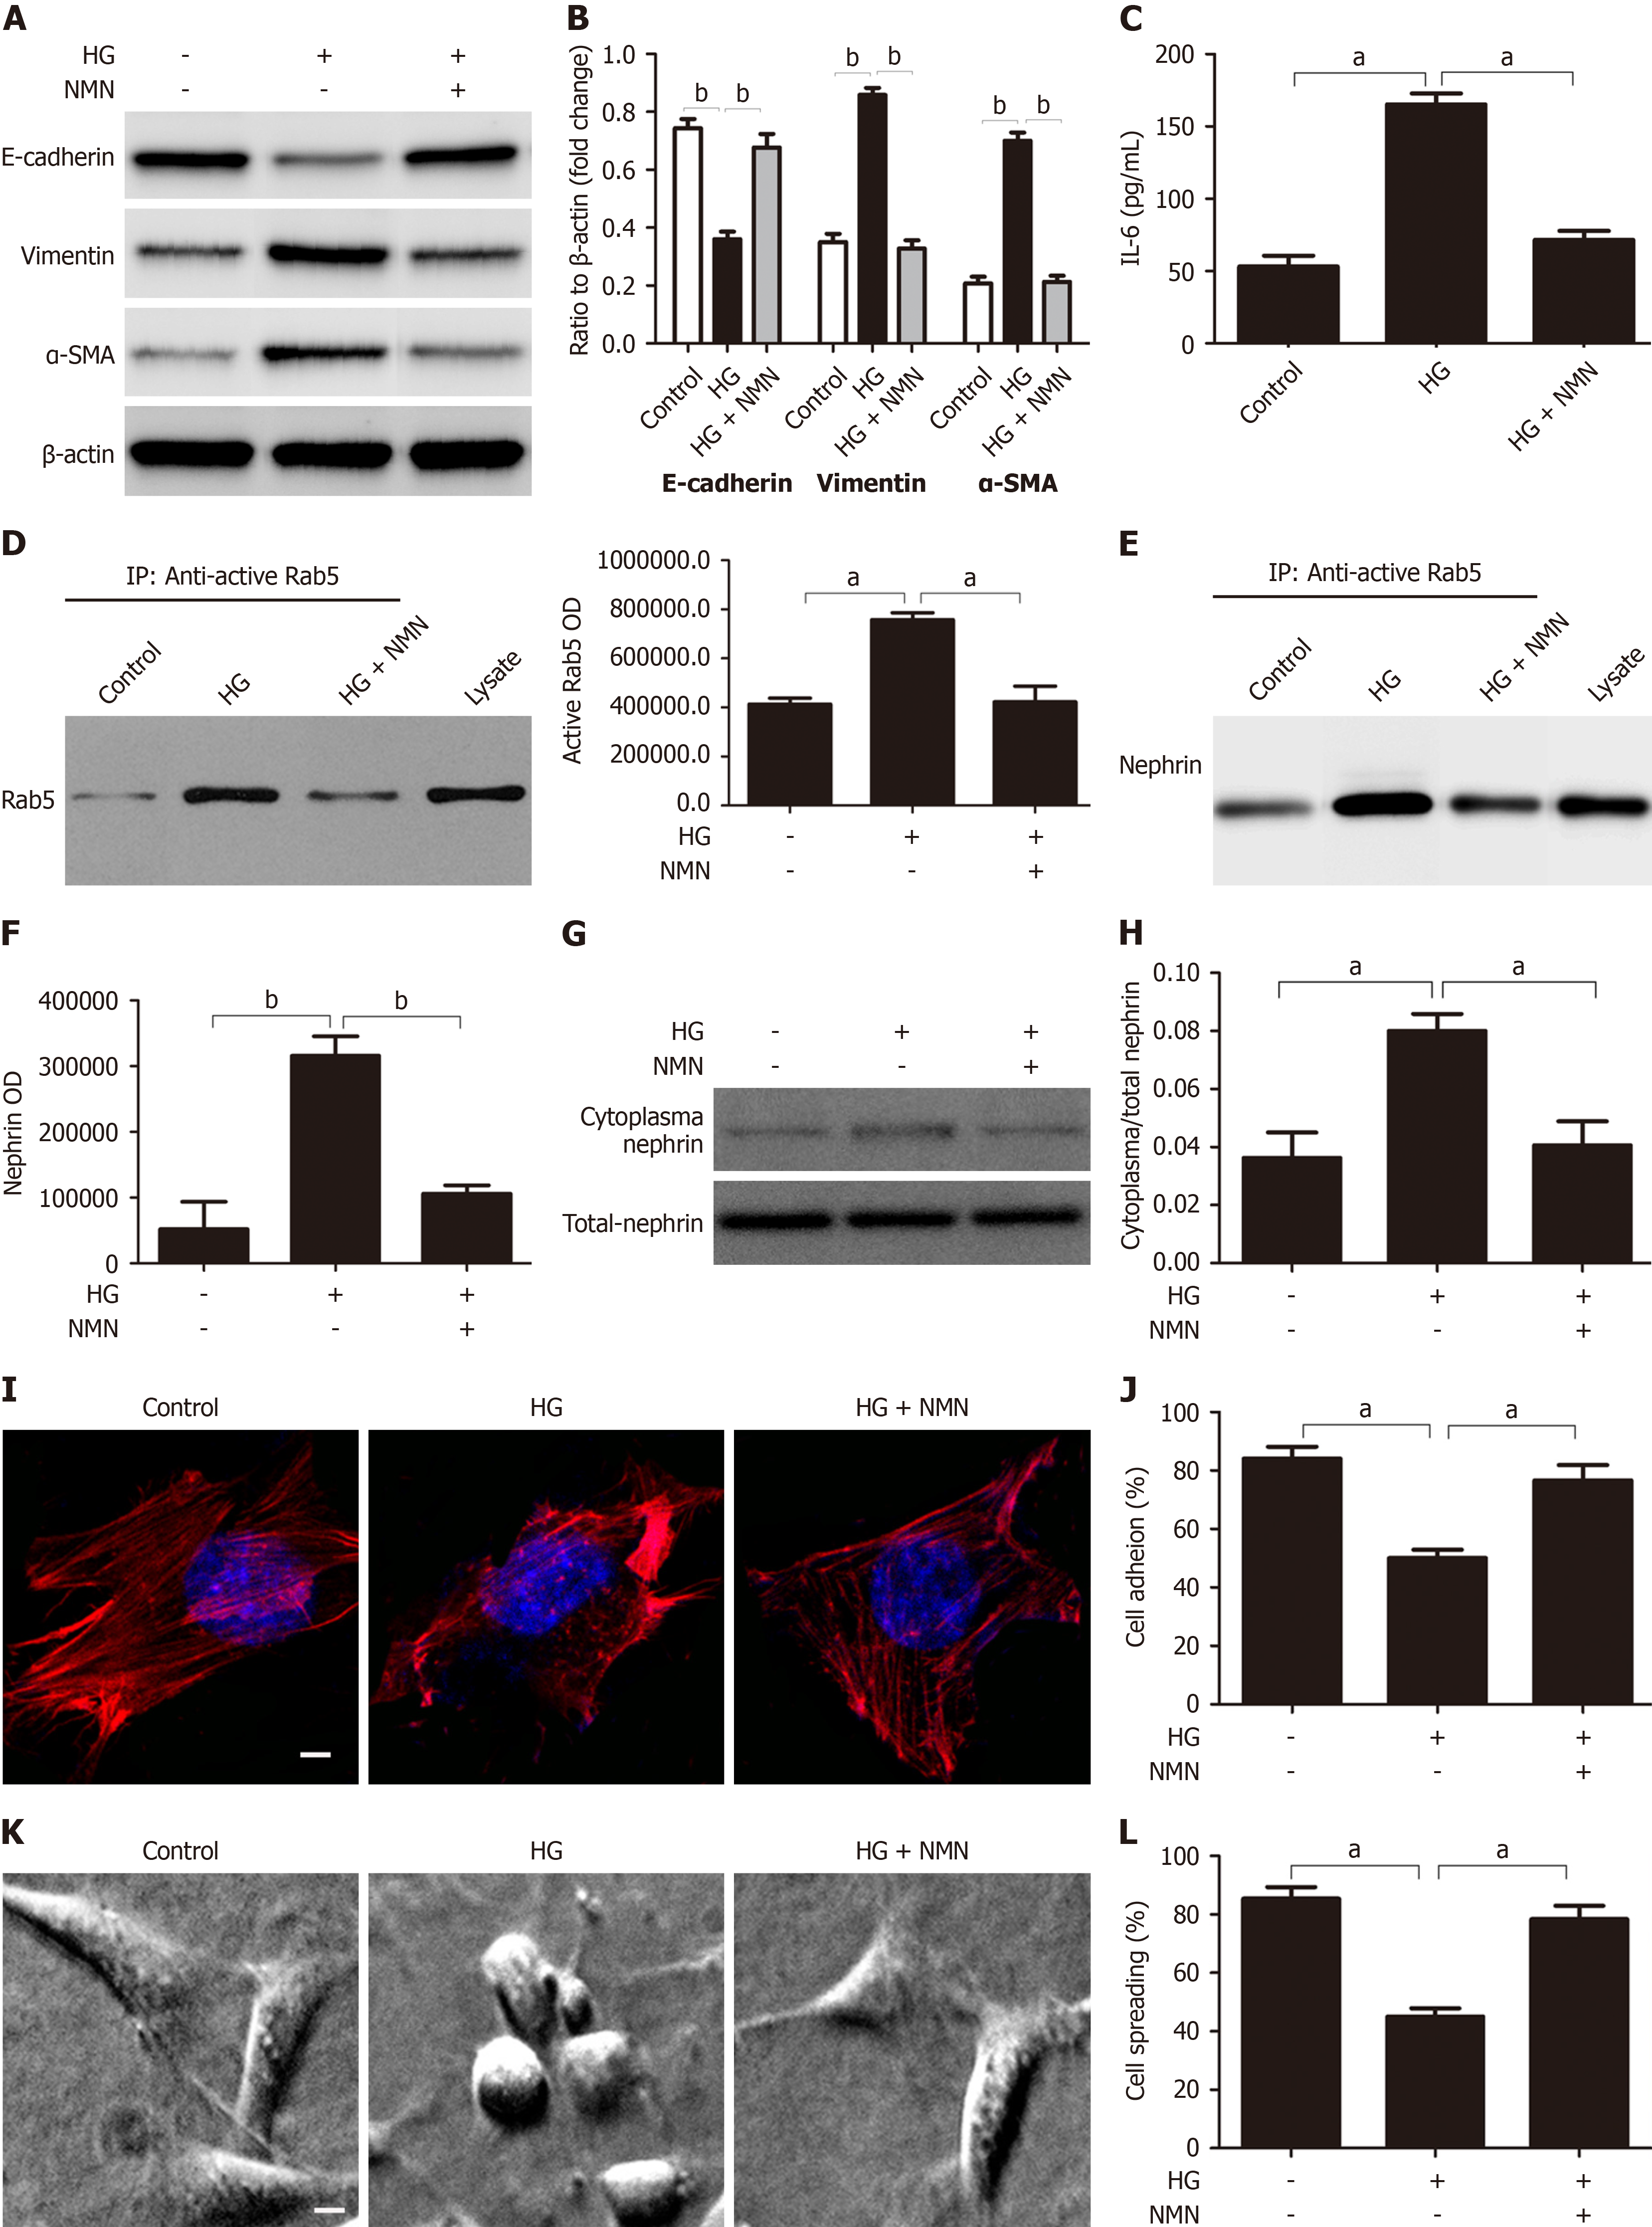
Figure 7 Nicotinamide mononucleotide protection depends on crosstalk between proximal tubular epithelial cell and podocytes.
A and B: Western blot analysis of epithelial-to-mesenchymal transition markers in HK-2 cells that received different treatments and quantification of these results (n = 3); C: IL-6 secretion by HK-2 cells that received different treatments (n = 3); D: Co-immunoprecipitation of active Rab5 in podocytes cultured in different conditioned media and quantification of these results; E and F: Co-immunoprecipitation of nephrin and active Rab5 in podocytes cultured in different conditioned media and quantification of the results (n = 3); G and H: Western blot analysis of cytoplasmic nephrin (C-nephrin) and total nephrin (T-nephrin) from podocytes cultured in different conditioned media and quantification of C-nephrin/T-nephrin ratio (n = 3); I: Representative confocal microscopy images of podocytes cultured in different conditioned media (magnification: × 1000; scale bar: 50 μm; red: Cytoskeleton; blue: Nuclei); J: Quantification of podocyte adhesion after culture in different conditioned media (n = 3); K: Representative electron microscopy images of podocyte spreading after culture in different conditioned media (magnification: × 400; scale bar: 20 μm); L: Quantitative analysis of podocyte spreading after culture in different conditioned media (n = 3). aP < 0.05; bP < 0.001. HG: High-dose glucose; NMN: Nicotinamide mononucleotide.
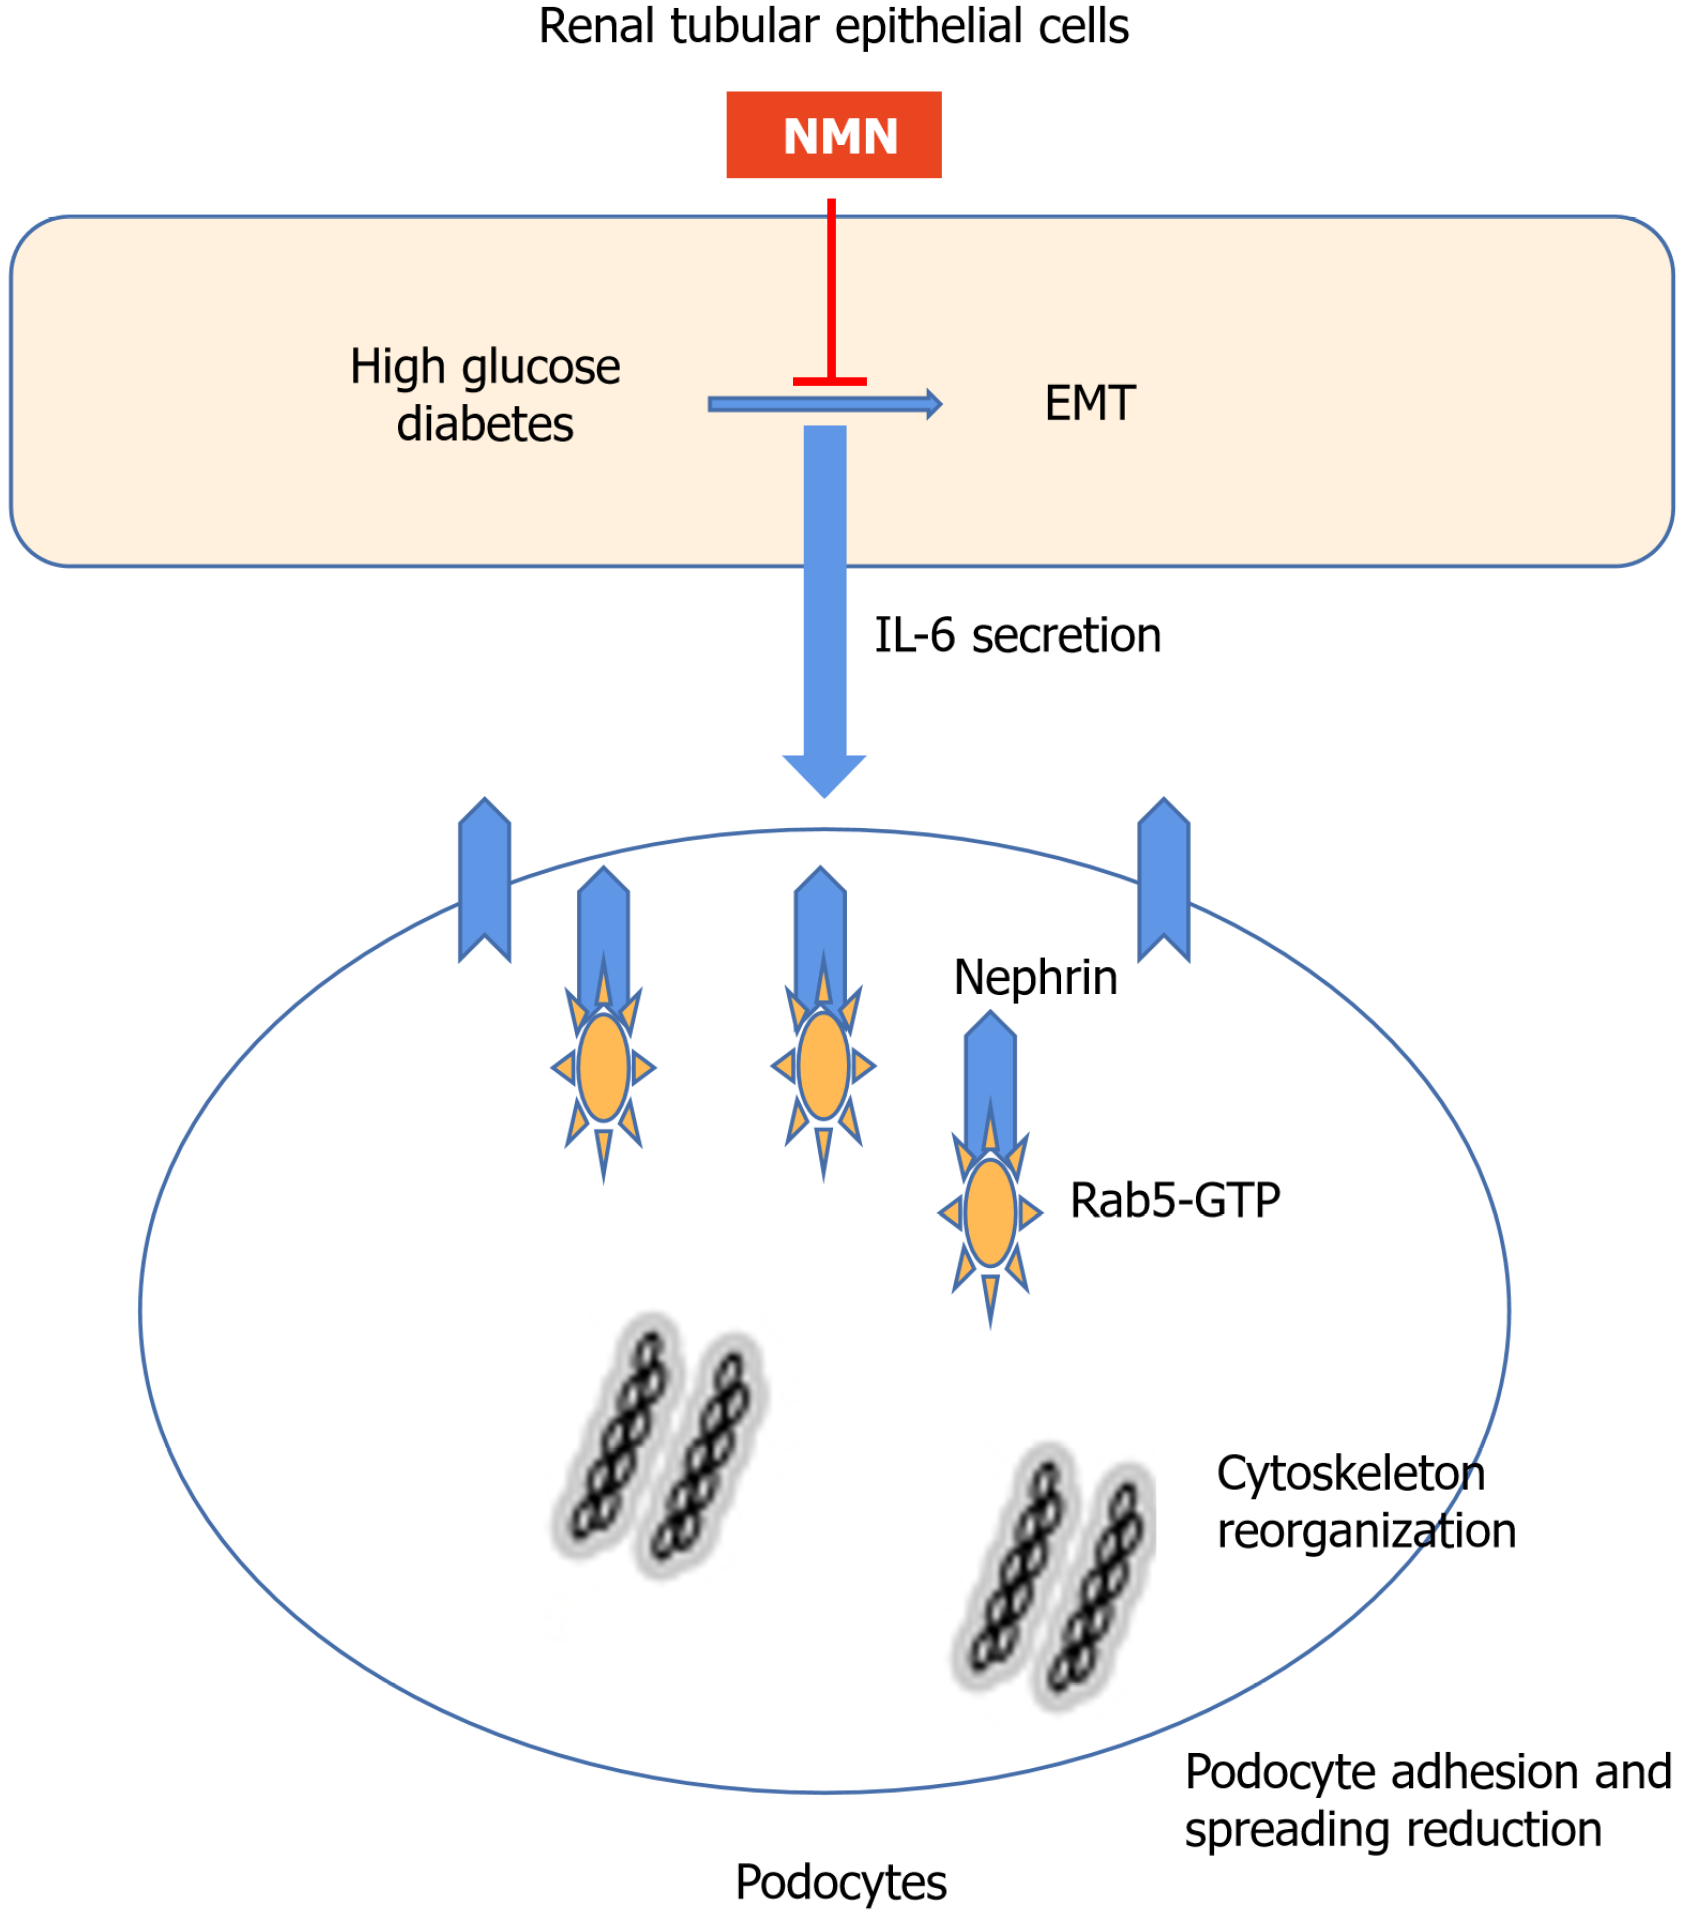
Figure 8 Possible mechanism of crosstalk between proximal tubular epithelial cells and podocytes and effect of nicotinamide mo
- Citation: Zha DQ, Gao P, Wu XY. Nicotinamide mononucleotide protects against diabetic nephropathy via IL-6/Rab5-mediated crosstalk between proximal tubular epithelial cells and podocytes. World J Diabetes 2025; 16(10): 109782
- URL: https://www.wjgnet.com/1948-9358/full/v16/i10/109782.htm
- DOI: https://dx.doi.org/10.4239/wjd.v16.i10.109782


