Copyright
©The Author(s) 2025.
World J Diabetes. Jan 15, 2025; 16(1): 92711
Published online Jan 15, 2025. doi: 10.4239/wjd.v16.i1.92711
Published online Jan 15, 2025. doi: 10.4239/wjd.v16.i1.92711
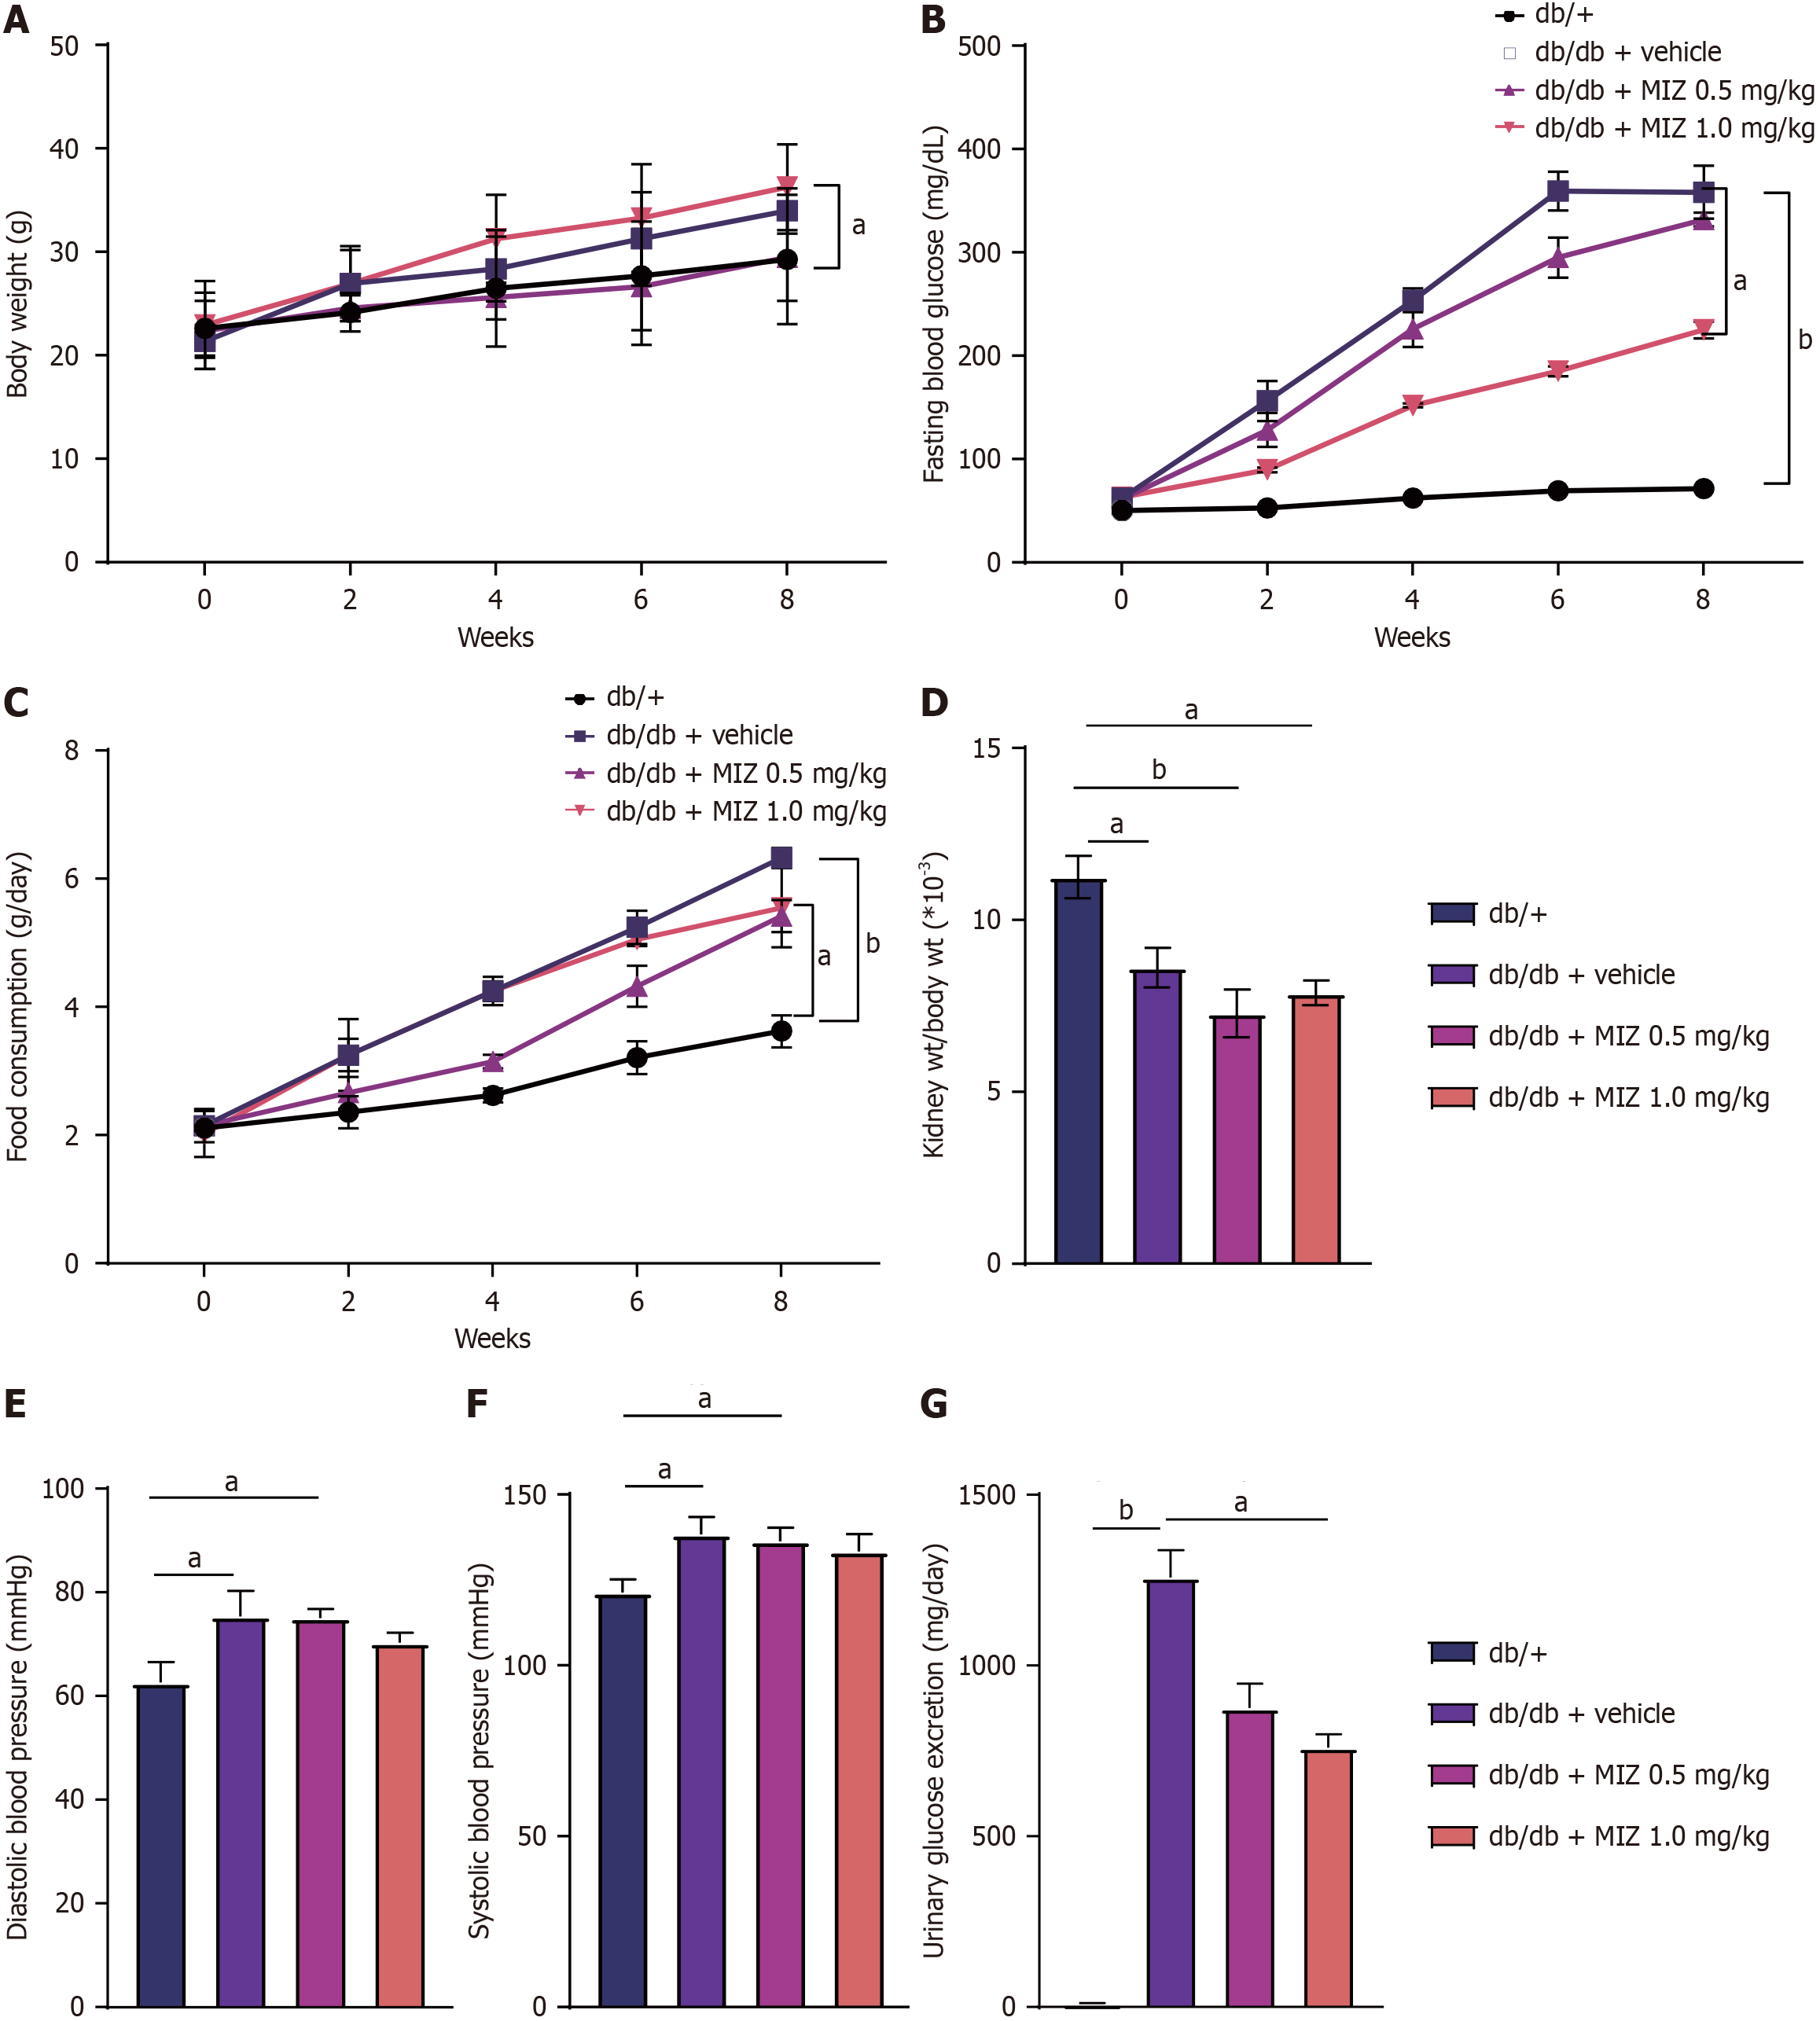
Figure 1 Effect of mizagliflozin treatment on renal damage in diabetic mice.
A: Body weight; B: Fasting blood glucose; C: Food consumption; D: Kidney weight/body weight; E: Diastolic blood pressure; F: Systolic blood pressure; G: Urinary glucose excretion. The values are presented as the mean ± standard error of the mean. aP < 0.05; bP < 0.01. MIZ: Mizagliflozin.
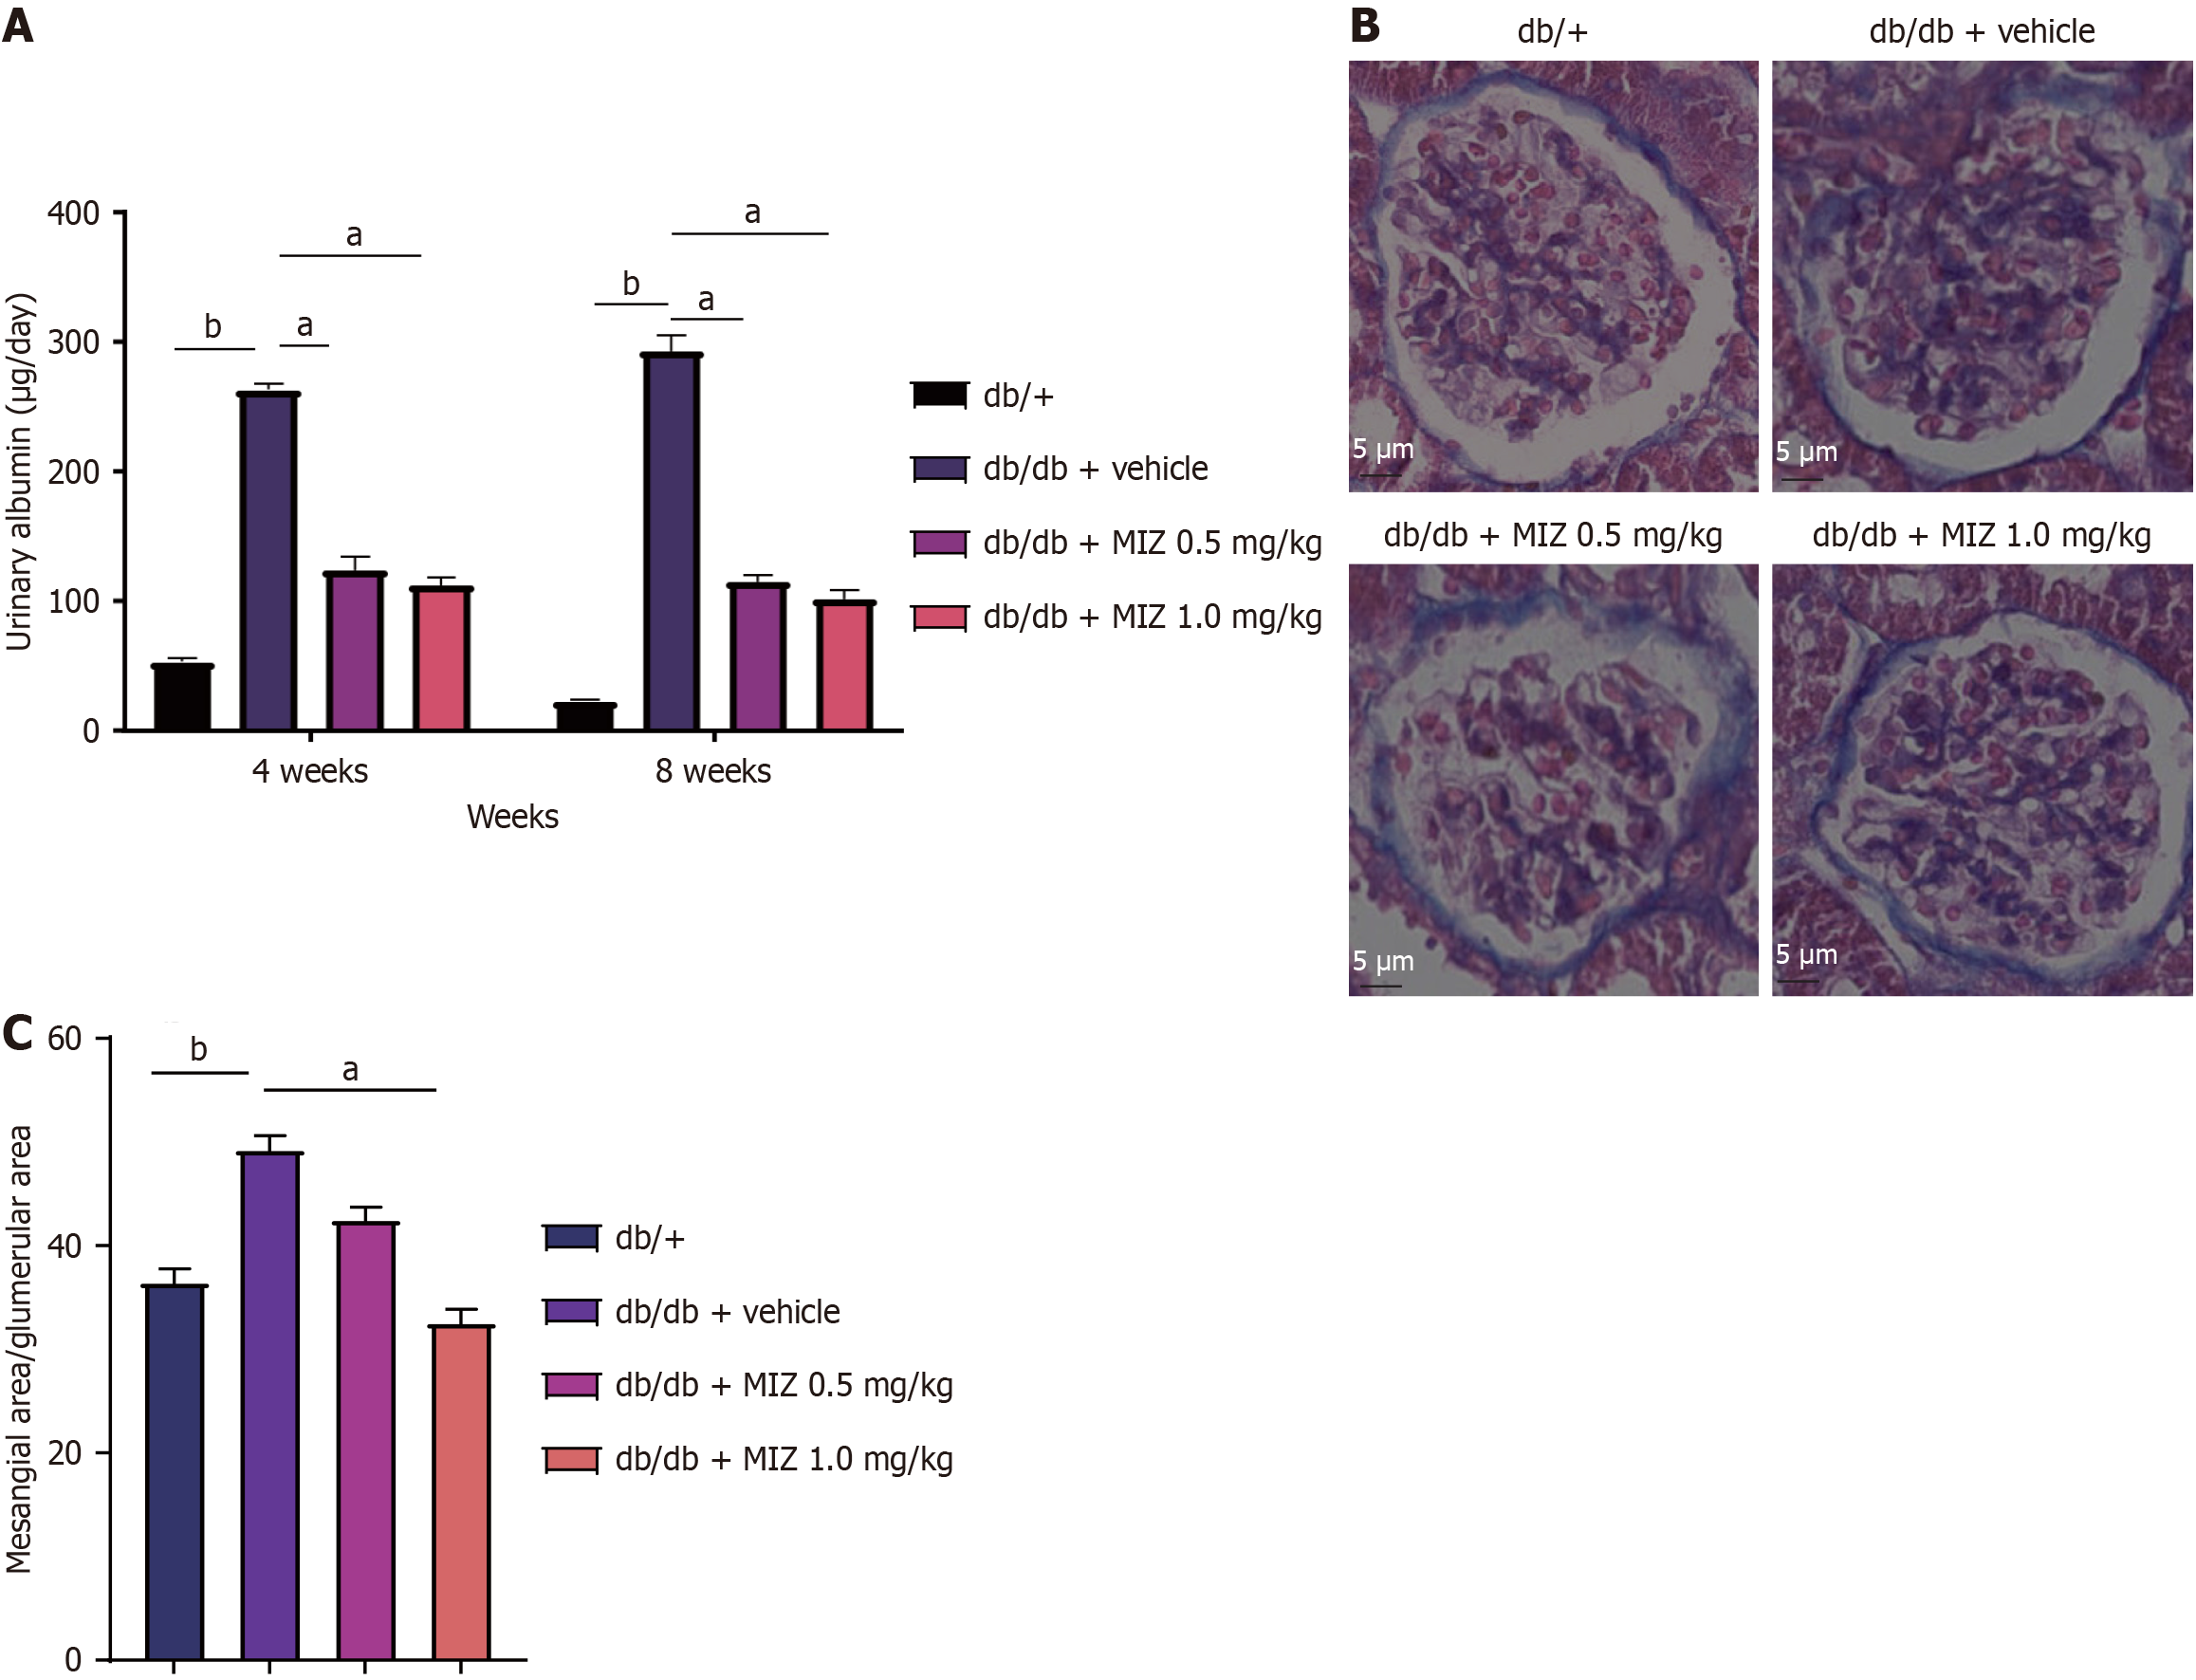
Figure 2 Effect of mizagliflozin treatment on renal histological change in diabetic mice.
A: Urinary albumin; B: Periodic acid Schiff staining of kidney tissue; C: Mesangial area/glumerular area. The values are presented as the mean ± standard error of the mean. aP < 0.05; bP < 0.01. MIZ: Mizagliflozin.
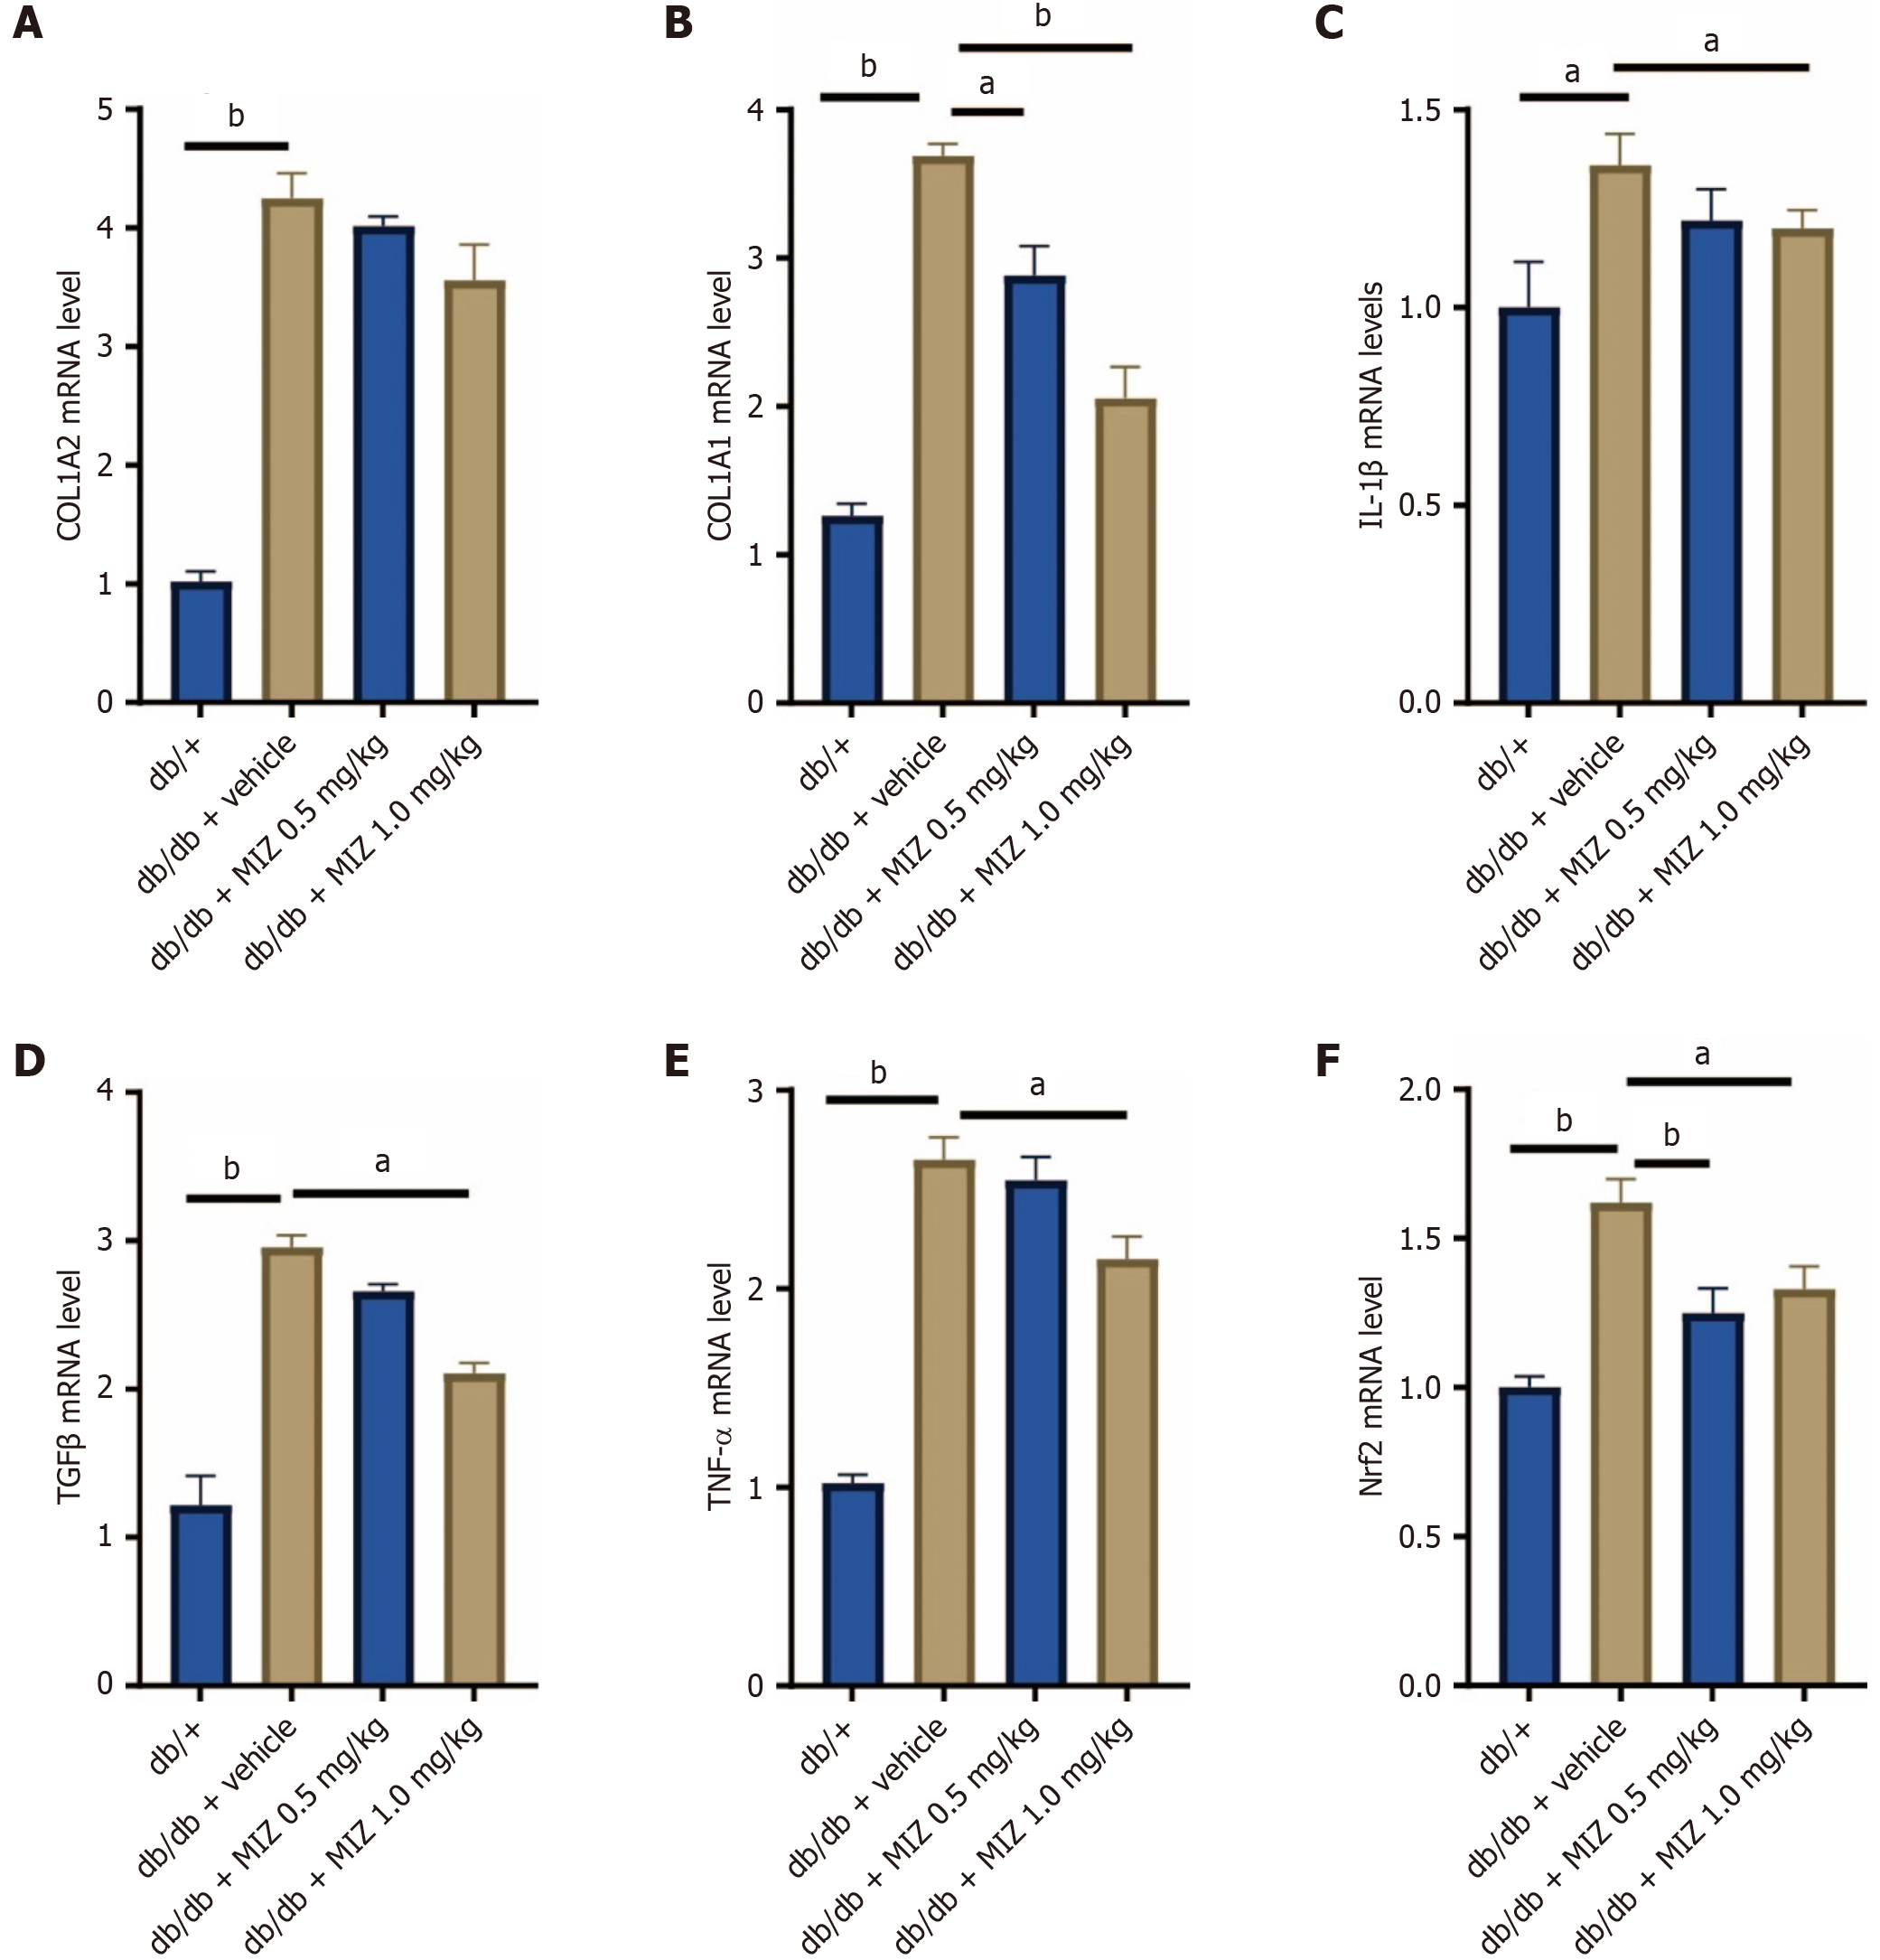
Figure 3 Mizagliflozin decreases extracellular matrix and inflammation-related gene expression in diabetic mice.
A: Collagen type 1 alpha 2 (COL1A2) mRNA level; B: COL1A1 mRNA level; C: Interleukin 1 beta mRNA level; D: Transforming growth factor beta mRNA level; E: Tumour necrosis factor alpha mRNA level; F: NF-E2-related factor-2 mRNA level. The values are presented as the mean ± standard error of the mean. aP < 0.05; bP < 0.01. MIZ: Mizagliflozin; COL1A2: Collagen type 1 alpha 2; IL: Interleukin; TGF: Transforming growth factor; TNF: Tumour necrosis factor; Nrf2: NF-E2-related factor-2.
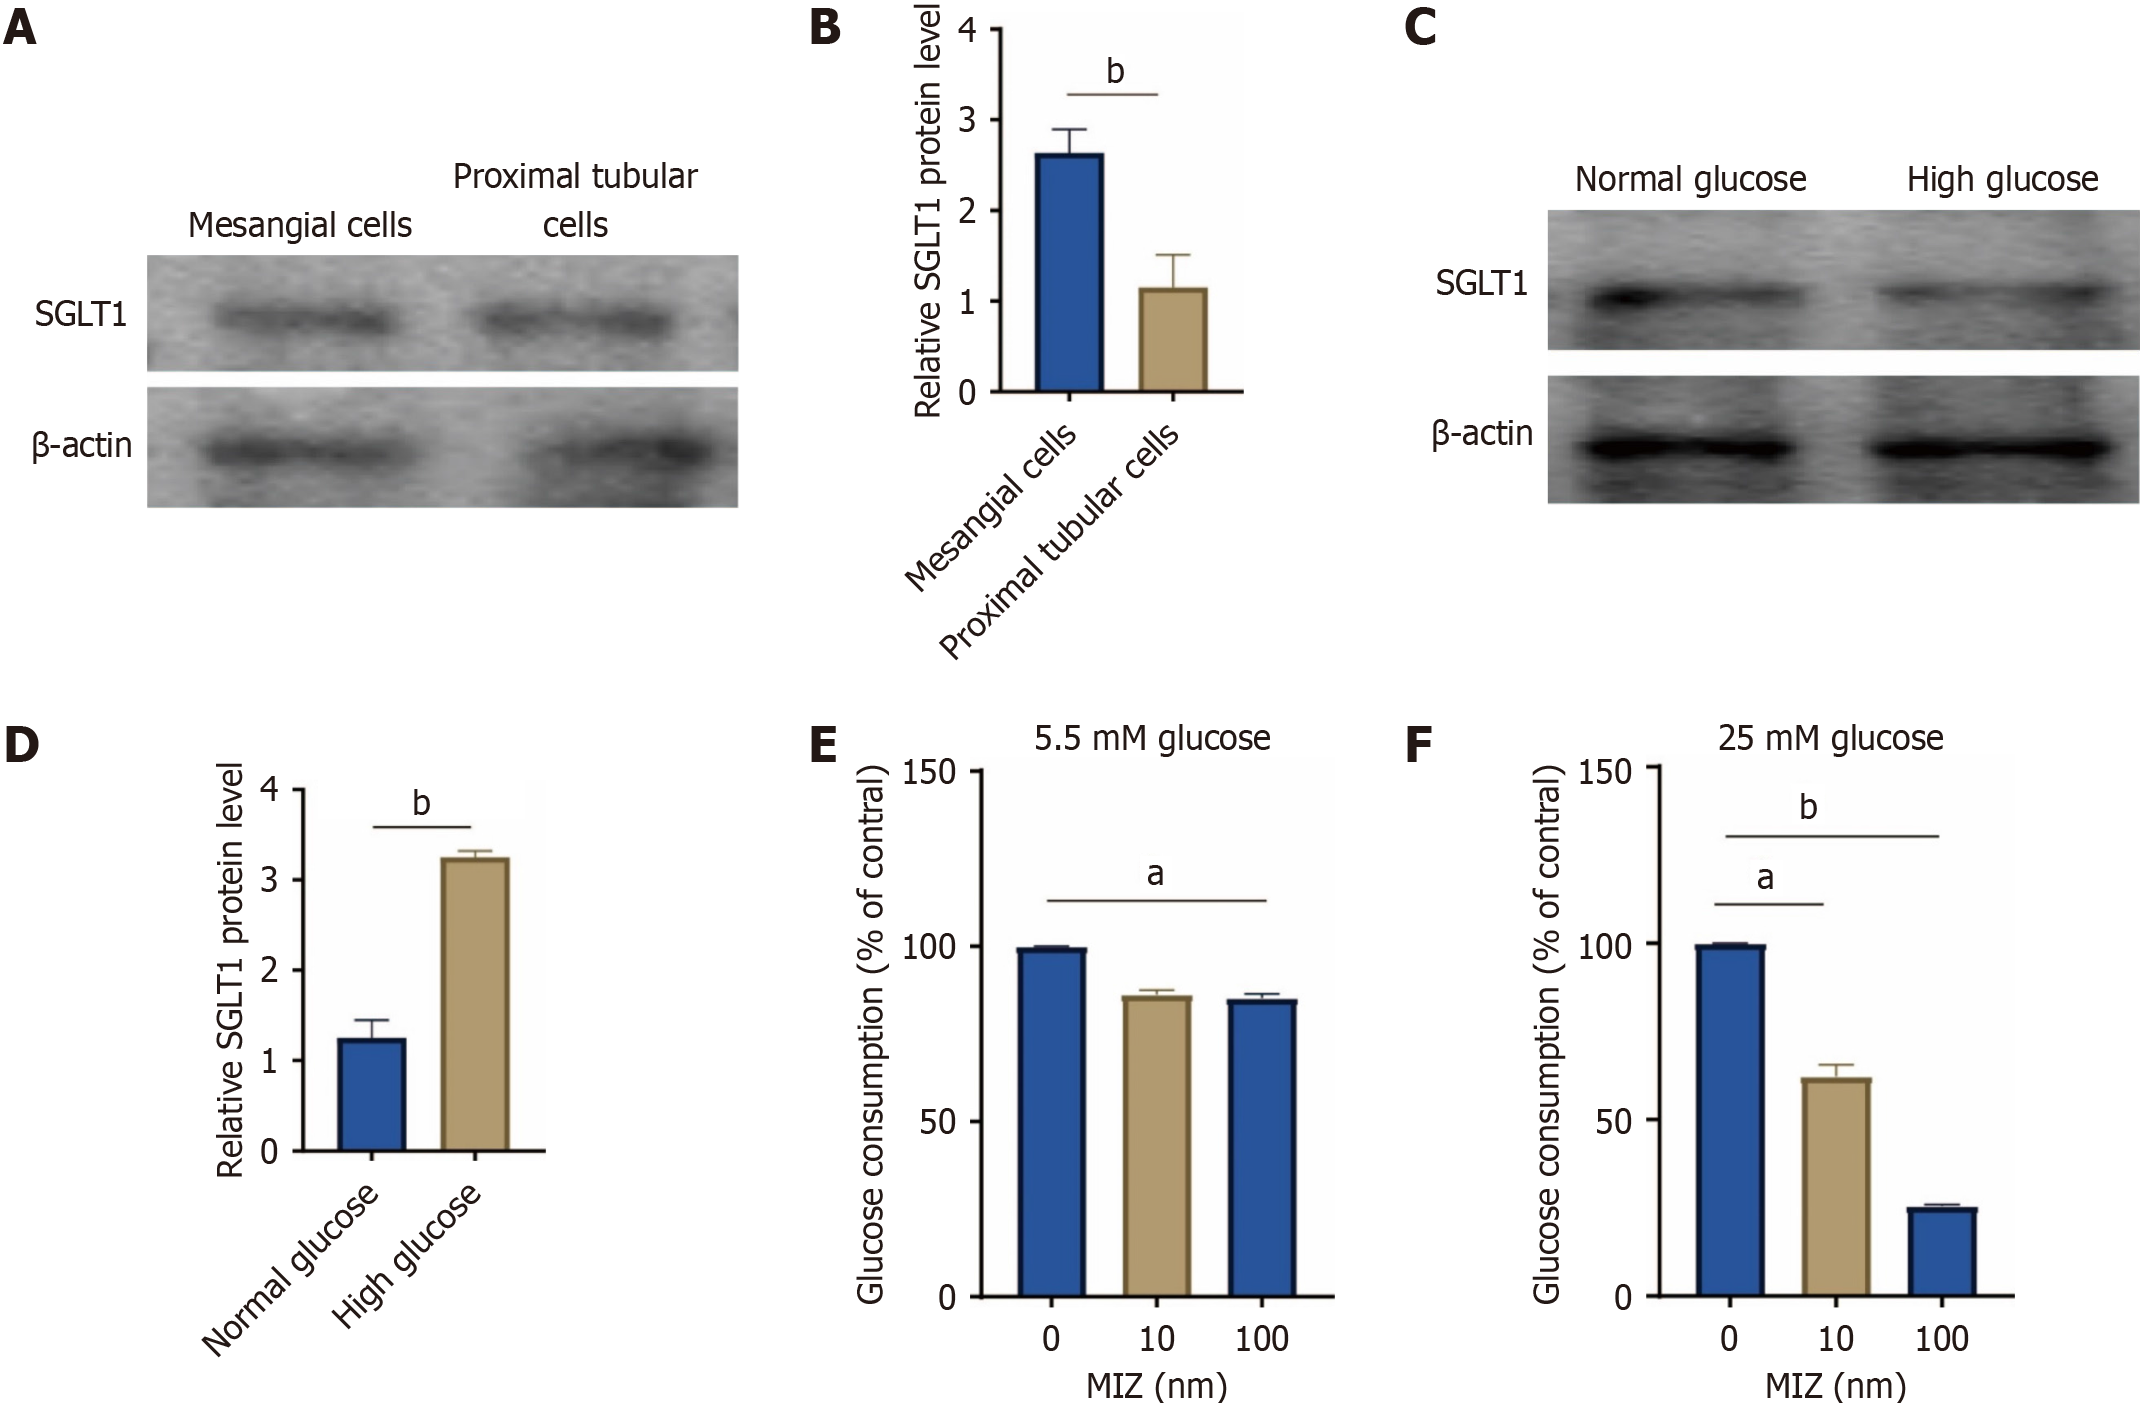
Figure 4 High glucose intervention resulted in a considerable rise in sodium-glucose cotransport protein 1 protein levels.
A and B: Western blot of sodium-glucose cotransport protein 1 (SGLT1) expression in mesangial cells and proximal tubular cells; C and D: Western blot of SGLT1 expression in normal glucose and high glucose treatment with mesangial cells; E: Glucose consumption in 5.5 mmol/L glucose; F: Glucose consumption in 25 mmol/L glucose. The values are presented as the mean ± standard error of the mean. aP < 0.05; bP < 0.01. MIZ: Mizagliflozin; SGLT1: Sodium-glucose cotransport protein 1.
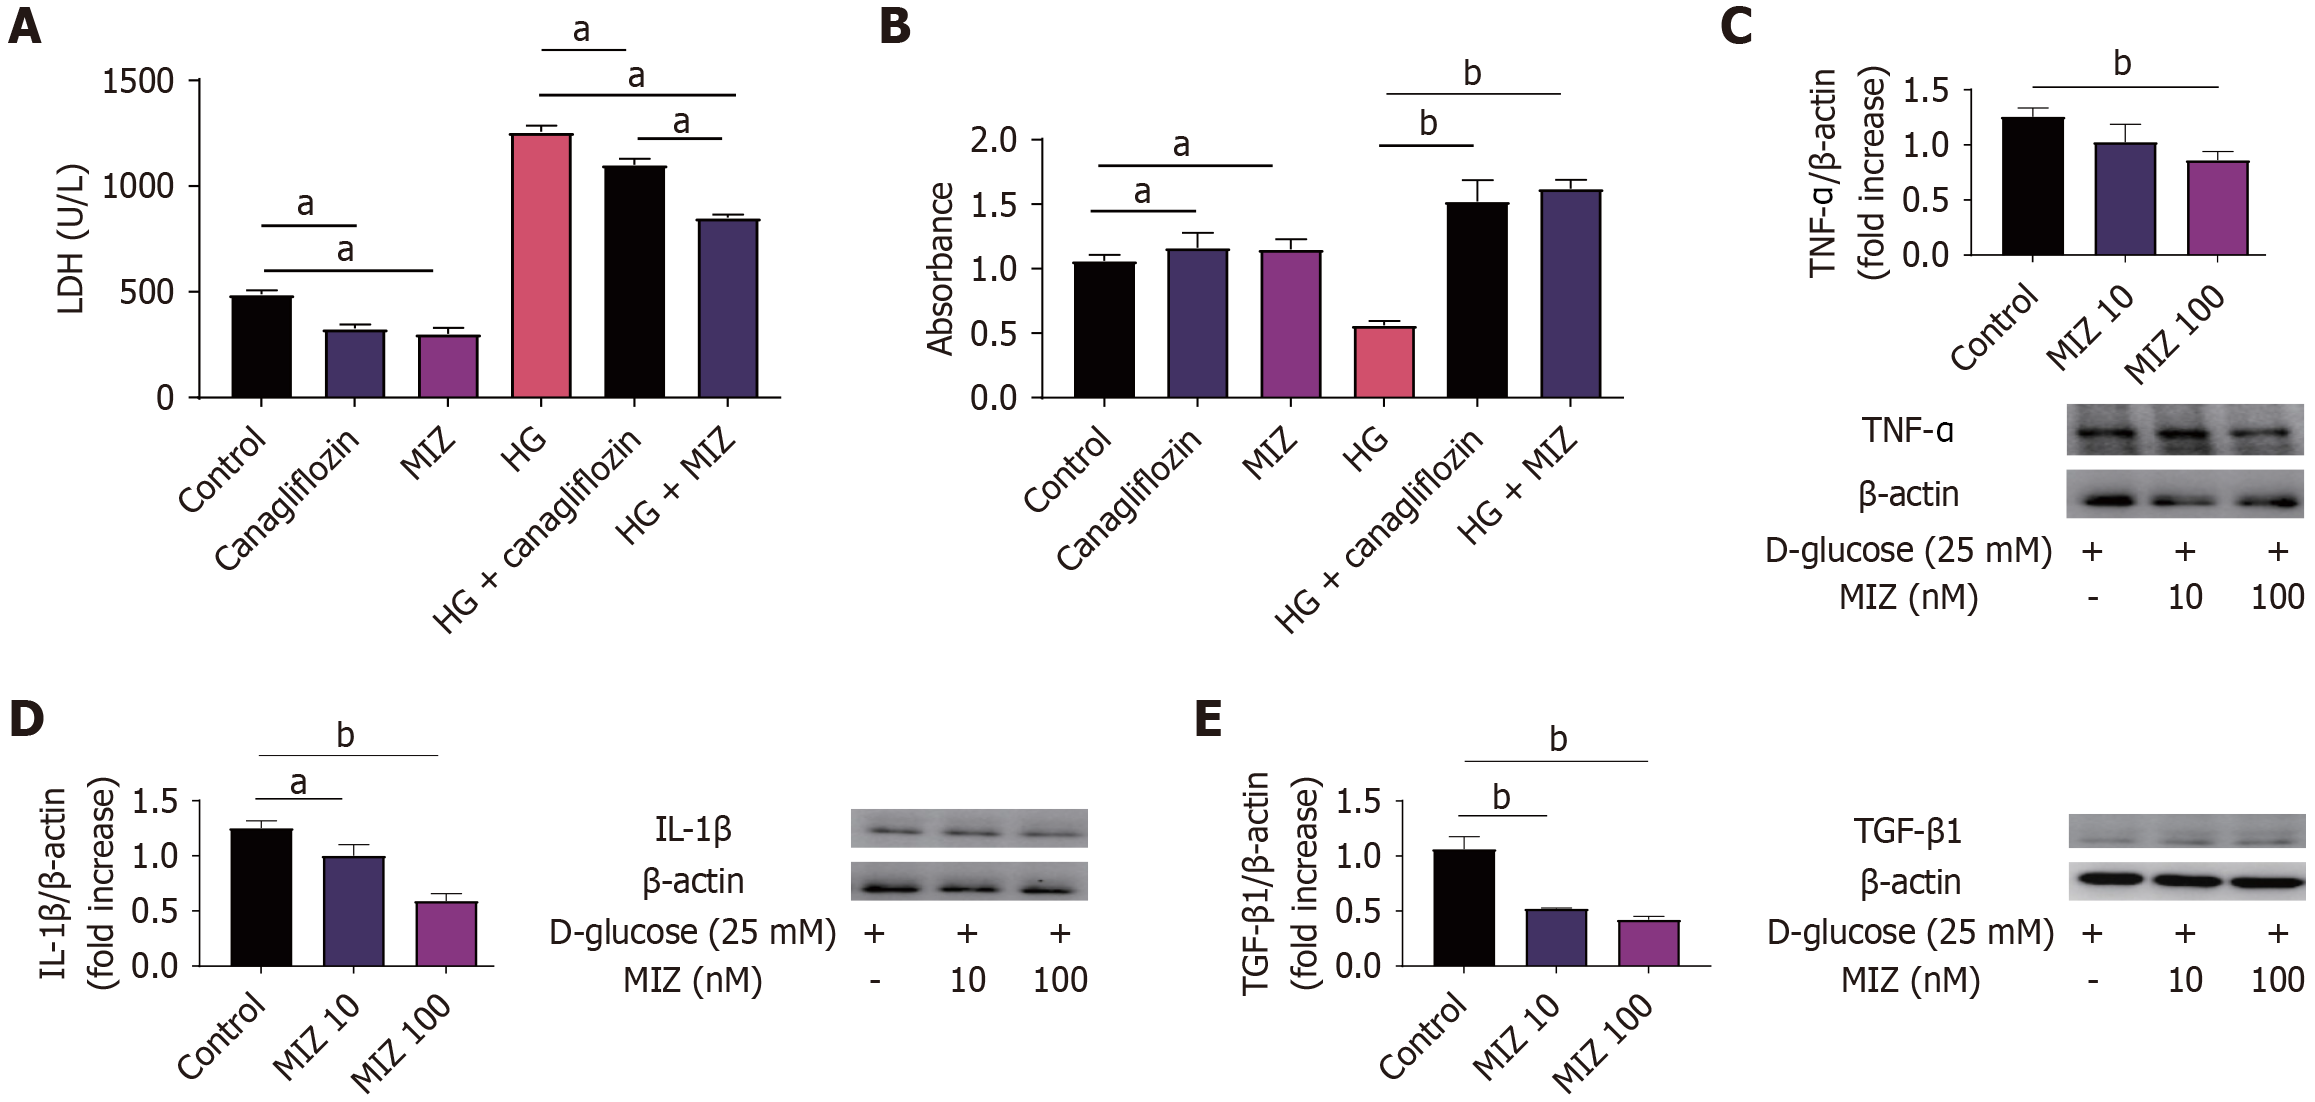
Figure 5 Mizagliflozin intervention improved the lactate dehydrogenase levels of mesangial cells caused by high glucose better than canagliflozin.
A: Lactate dehydrogenase levels; B: Cell Counting Kit-8 test; C: Western blot of tumour necrosis factor-α in high glucose with varying levels of mizagliflozin (MIZ); D: Western blot of interleukin-1β in high glucose with varying levels of MIZ; E: Western blot of transforming growth factor β in high glucose with varying levels of MIZ. The values are presented as the mean ± standard error of the mean. aP < 0.05; bP < 0.01. MIZ: Mizagliflozin; IL: Interleukin; TGF: Transforming growth factor; TNF: Tumour necrosis factor; HG: High glucose.
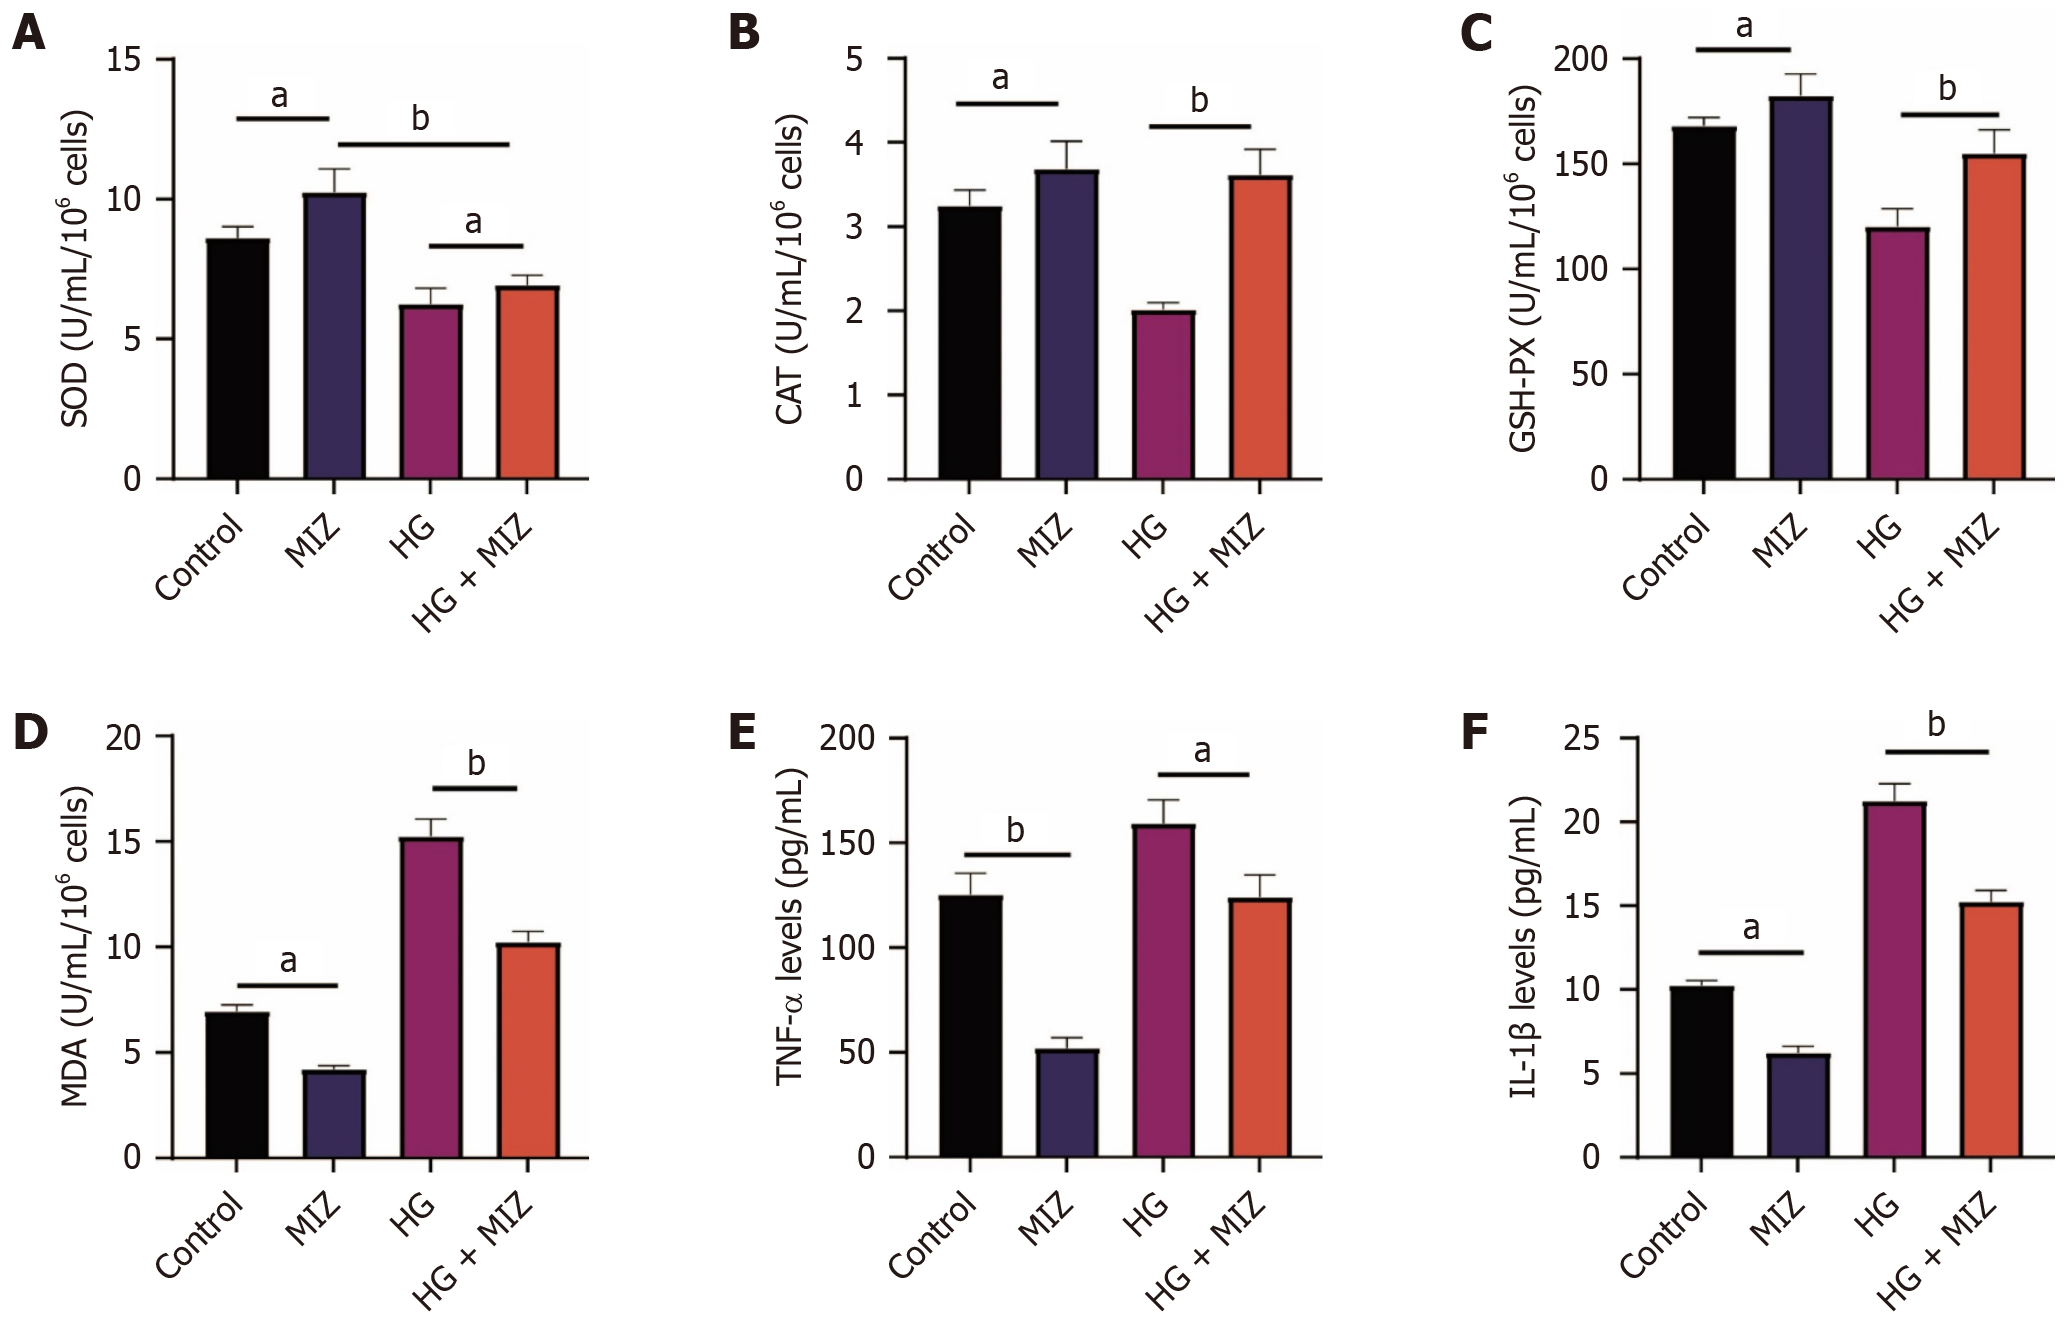
Figure 6 Mizagliflozin regulates oxidative stress and inflammatory factors in mesangial cells exposed to high hyperglycemia.
A: Superoxide dismutase levels; B: Catalase levels; C: Glutathione peroxidase levels; D: Malondialdehyde levels; E: Tumour necrosis factor-α levels; F: Interleukin-1β levels. The data are presented as mean ± SD. aP < 0.05; bP < 0.01. n = 8, experiment duration = 3 days. MIZ: Mizagliflozin; IL: Interleukin; TNF: Tumour necrosis factor; SOD: Superoxide dismutase; CAT: Catalase; GSH-PX: Glutathione peroxidase; MDA: Malondialdehyde.
- Citation: Lin ZM, Gao HY, Shi SH, Li YT. Mizagliflozin ameliorates diabetes induced kidney injury by inhibitor inhibit inflammation and oxidative stress. World J Diabetes 2025; 16(1): 92711
- URL: https://www.wjgnet.com/1948-9358/full/v16/i1/92711.htm
- DOI: https://dx.doi.org/10.4239/wjd.v16.i1.92711


