Copyright
©The Author(s) 2024.
World J Diabetes. Jun 15, 2024; 15(6): 1353-1366
Published online Jun 15, 2024. doi: 10.4239/wjd.v15.i6.1353
Published online Jun 15, 2024. doi: 10.4239/wjd.v15.i6.1353
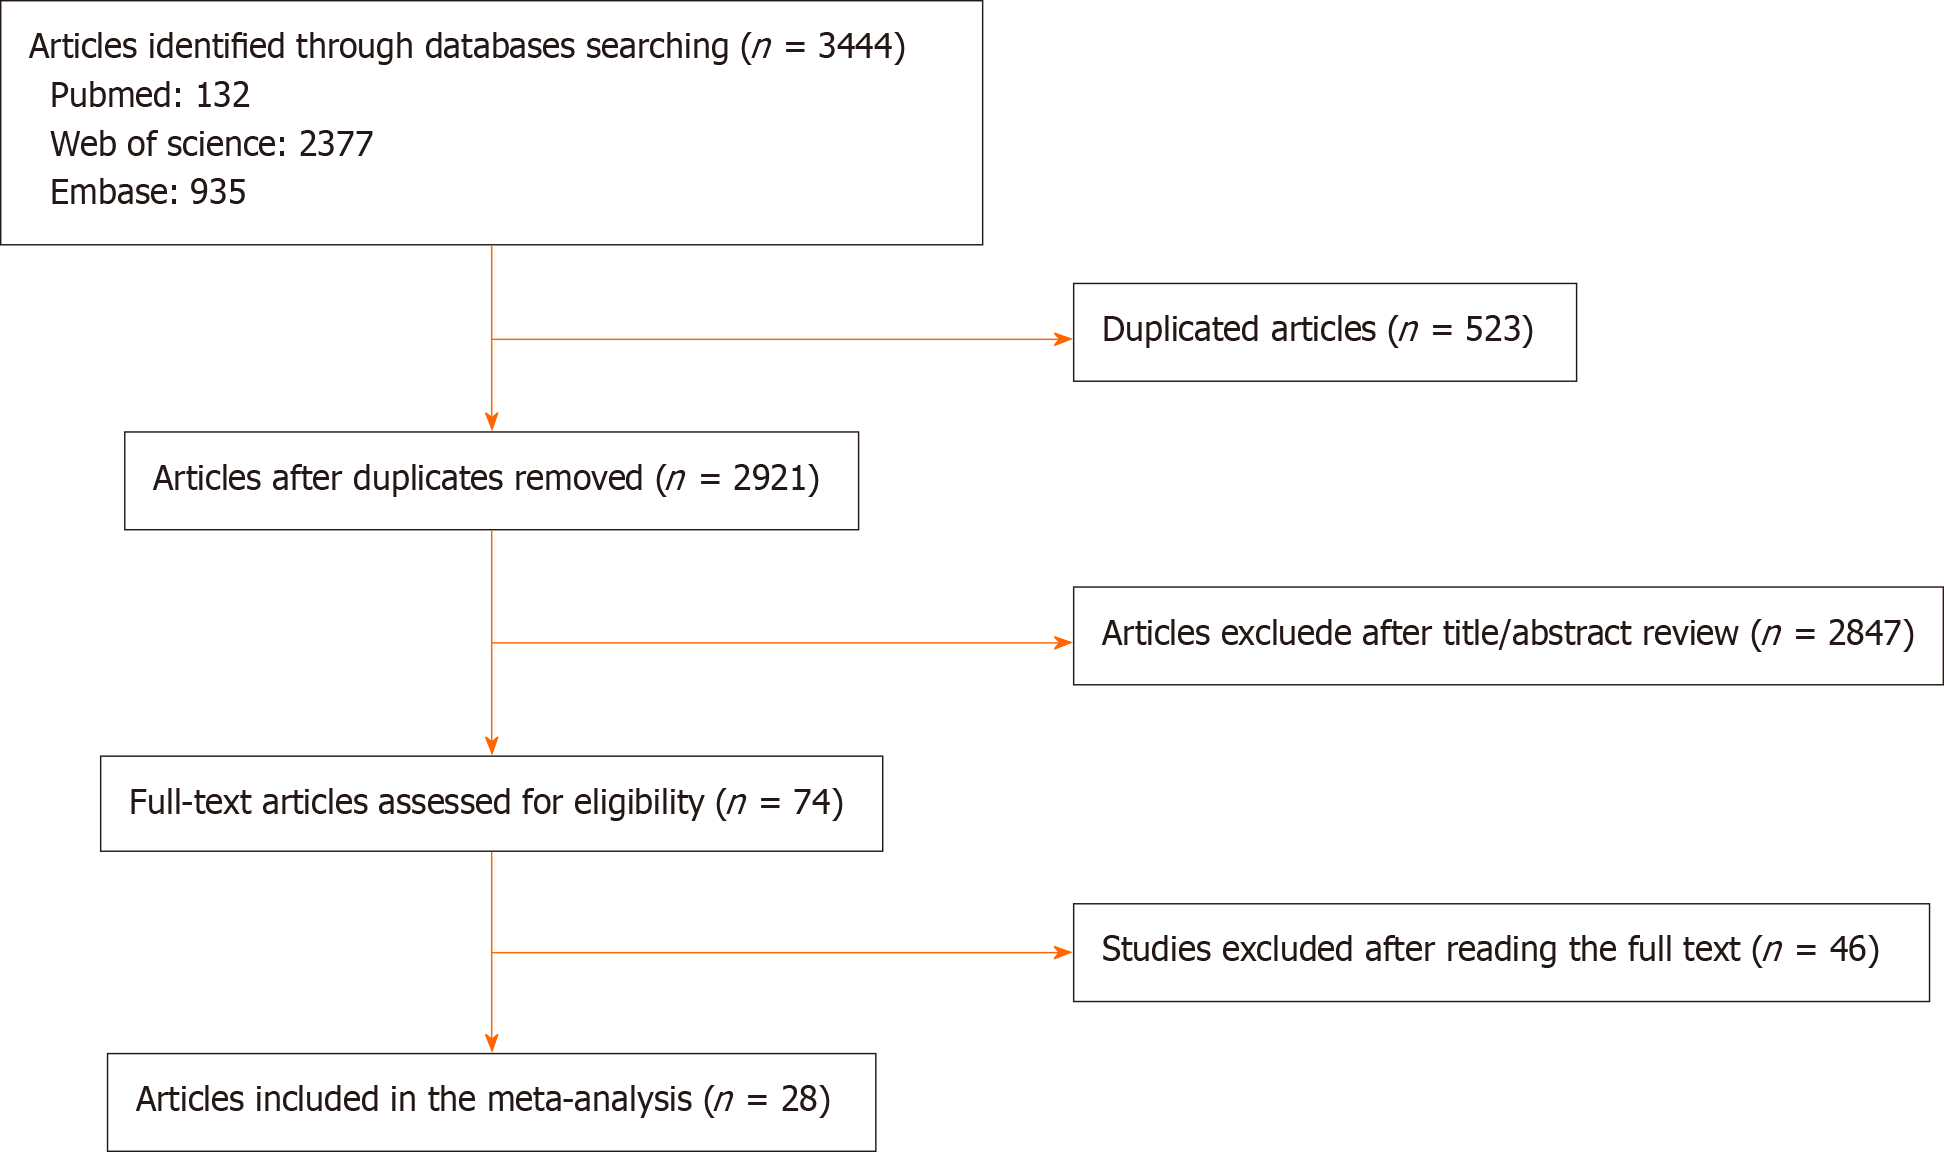
Figure 1
Flow diagram of study selection and identification.
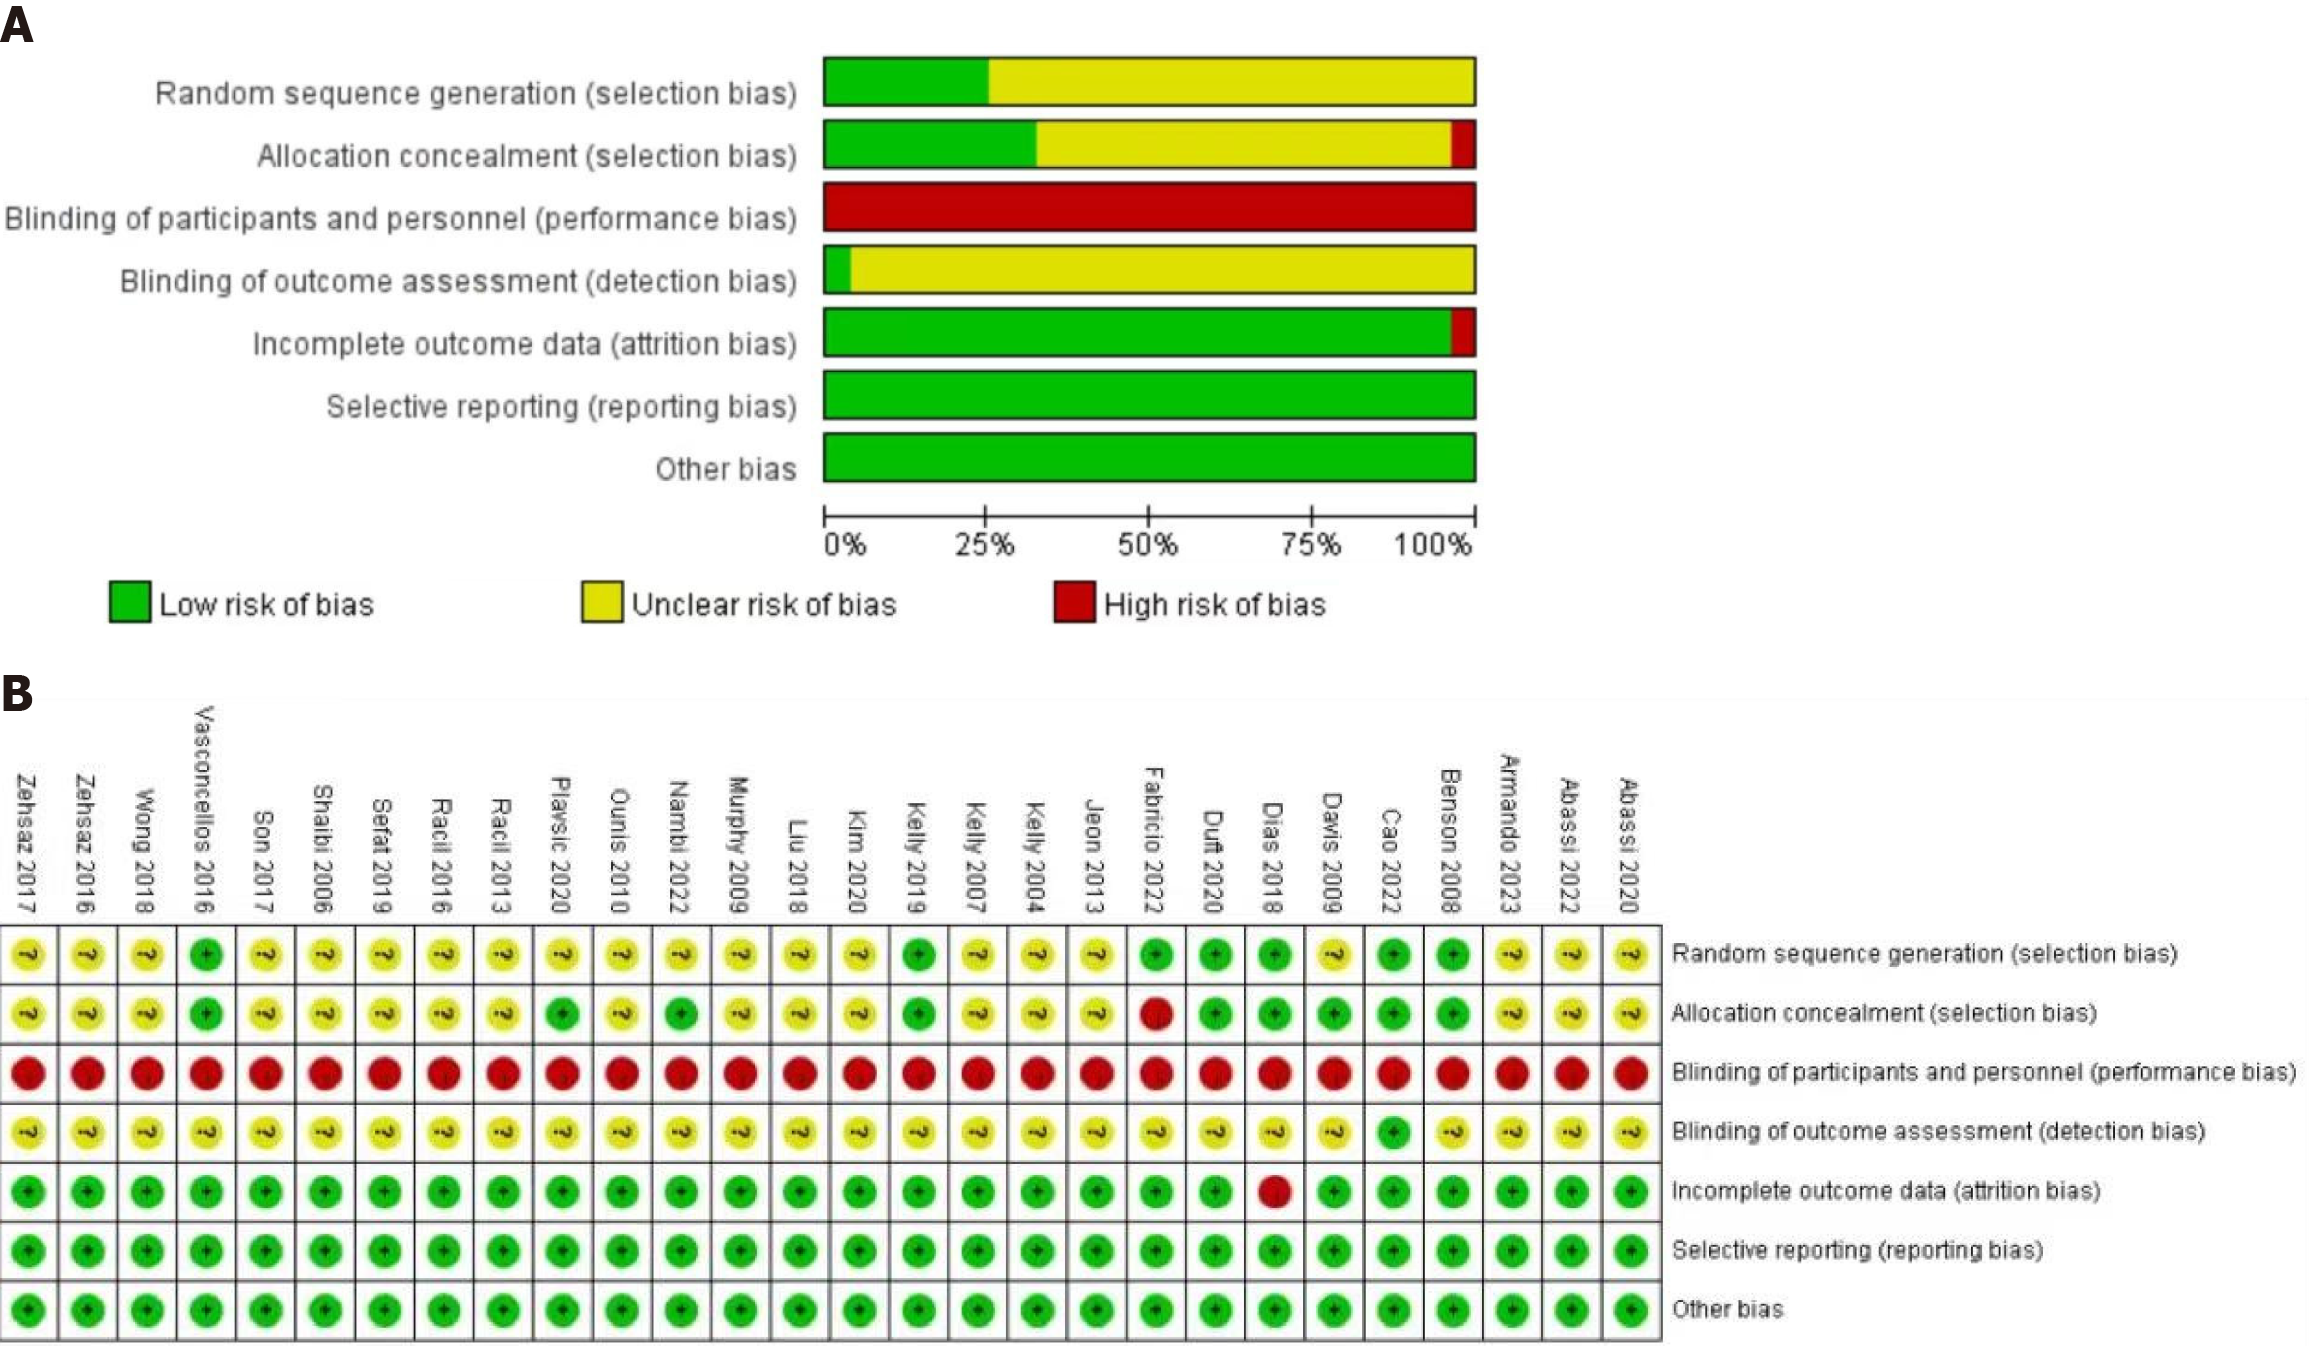
Figure 2 Quality assessment.
A: Risk of bias graph; B: Summary of the quality assessment of the included studies. Green indicates low risk of bias, red indicates high risk of bias, yellow indicates unclear risk of bias.
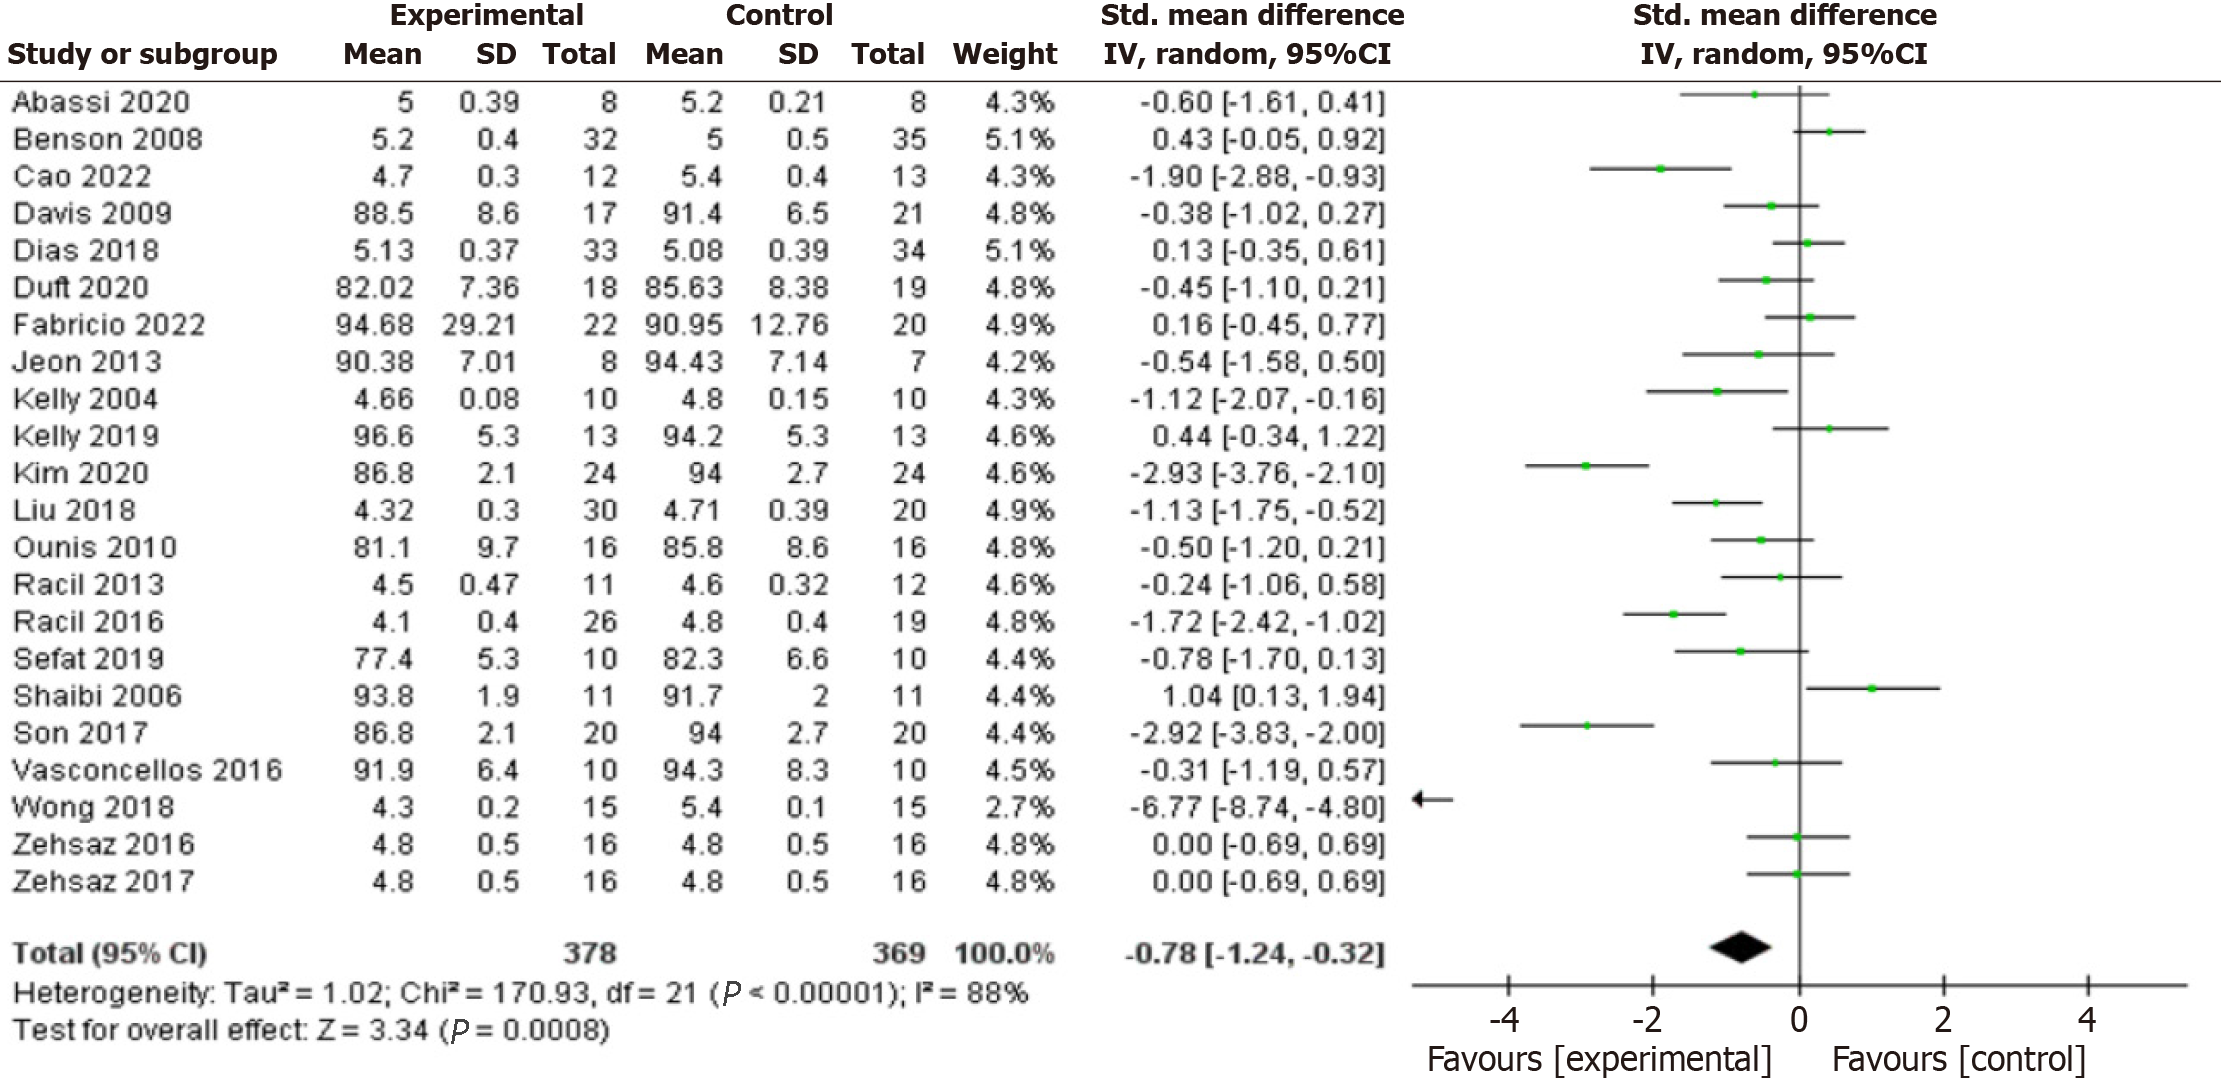
Figure 3 Forest plot of the effects of exercise training versus control on fasting blood glucose.
CI: Confidence interval.
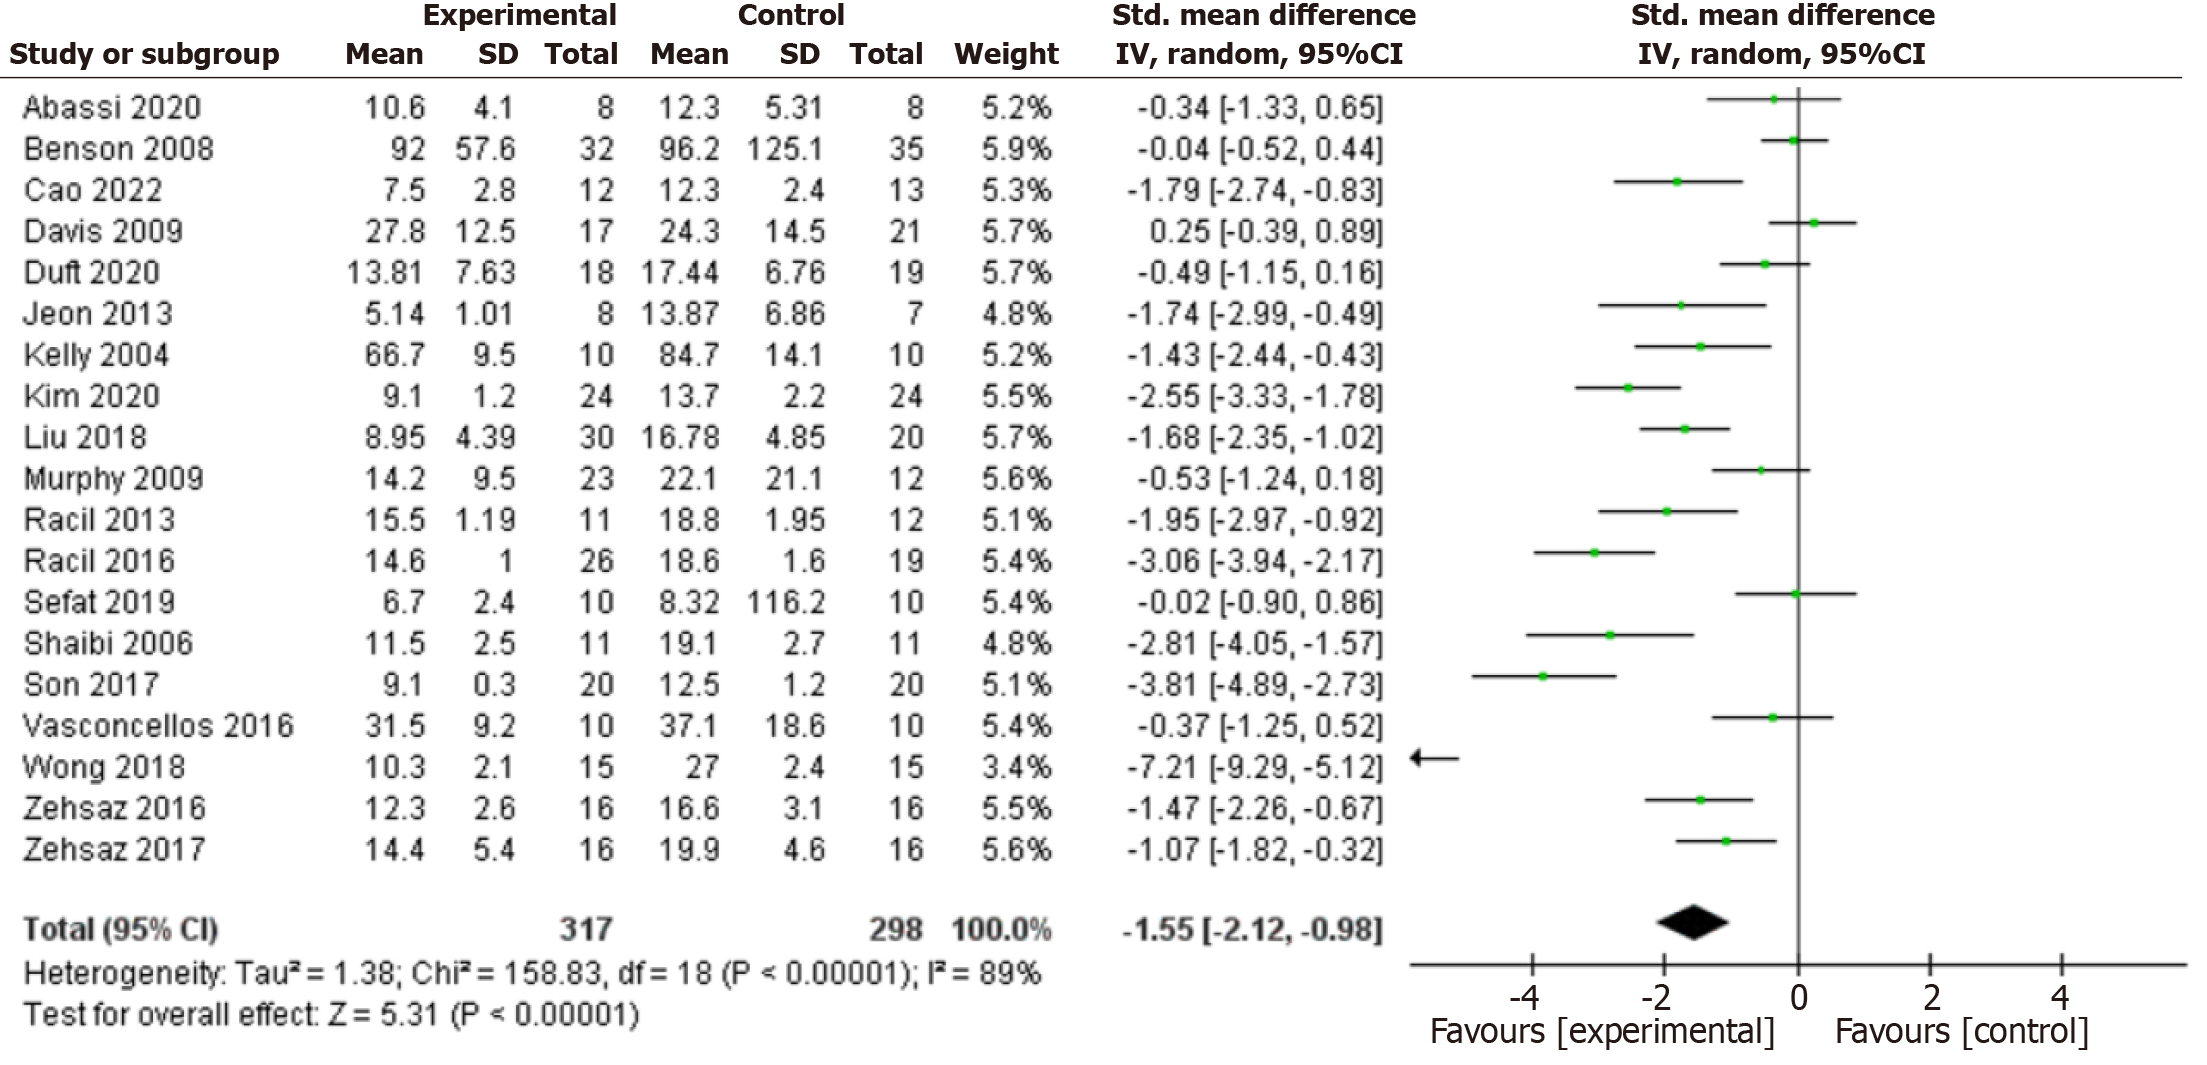
Figure 4 Forest plot of the effects of exercise training versus control on fasting insulin.
CI: Confidence interval.
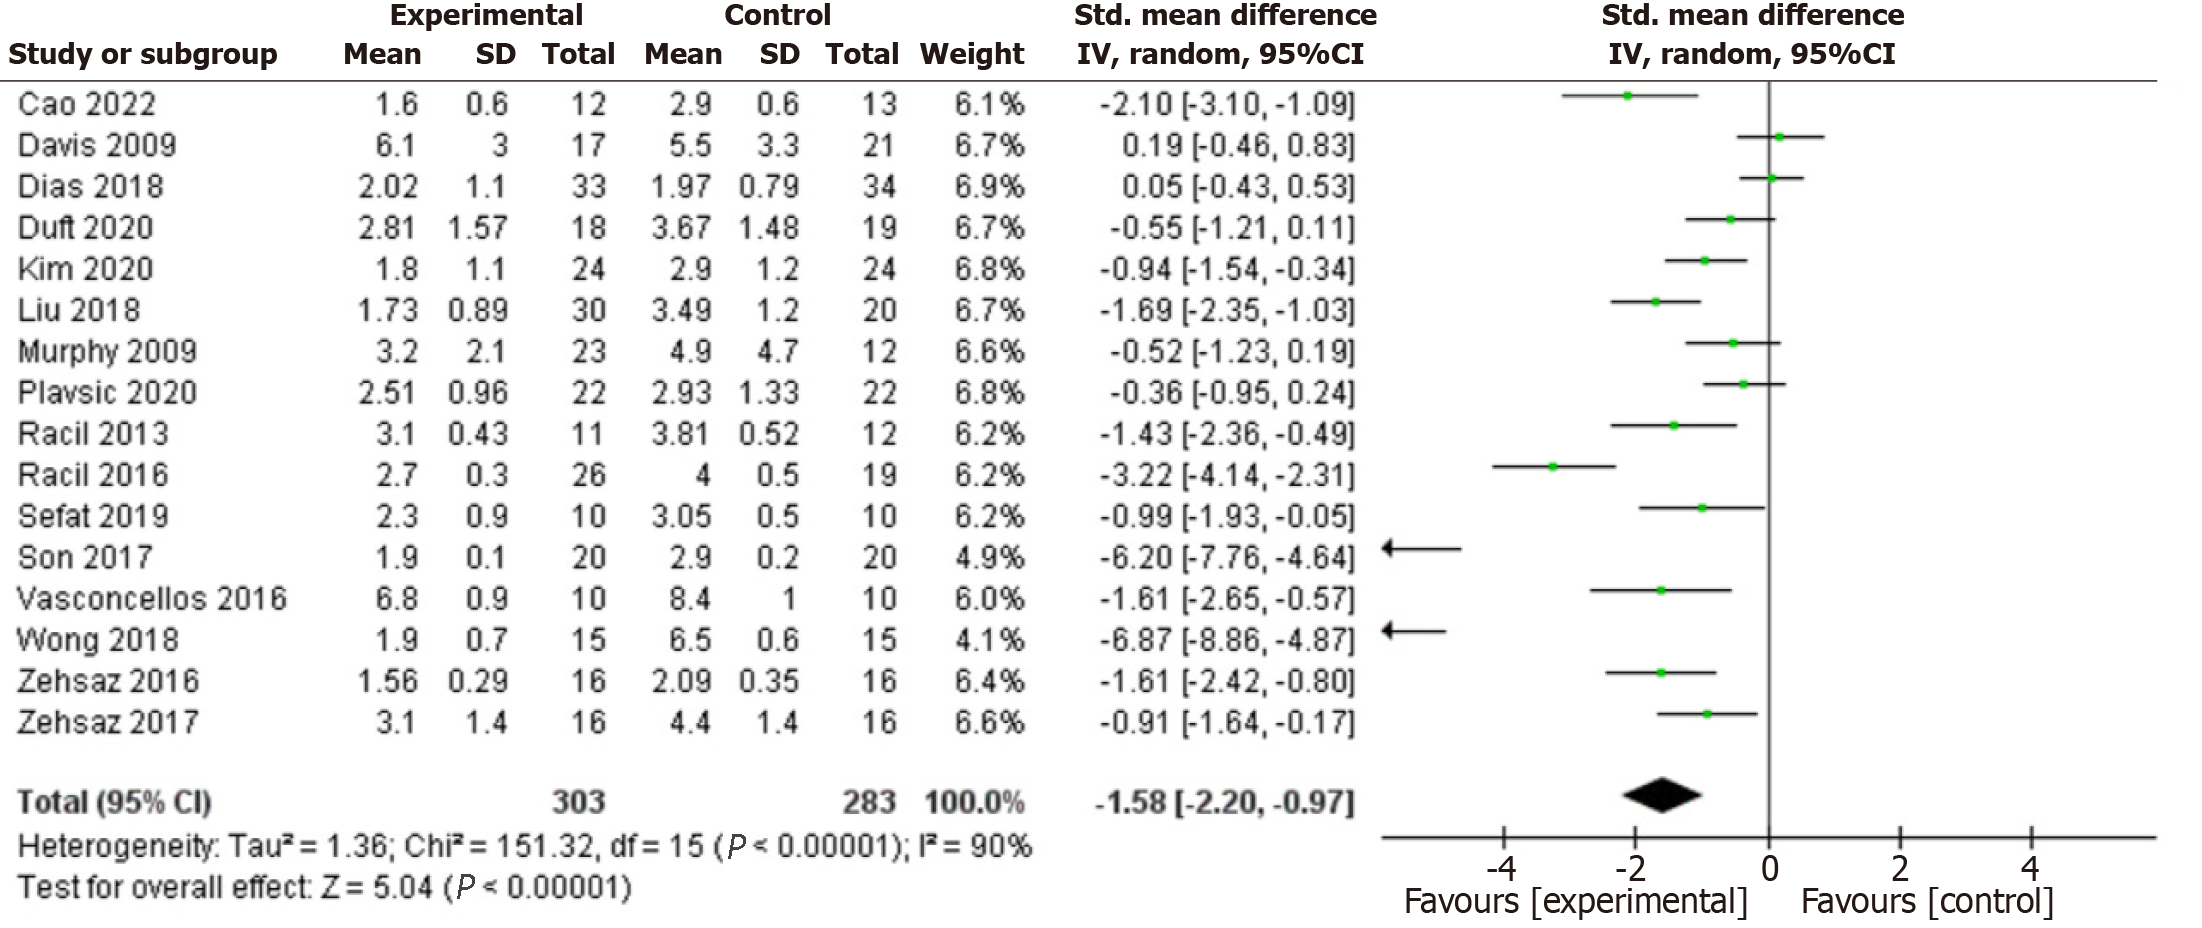
Figure 5 Forest plot of the effects of exercise training on homeostasis model assessment of insulin resistance.
CI: Confidence interval.
Figure 6 Forest plot of the effects of exercise training on interleukin-6.
CI: Confidence interval.
Figure 7 Forest plot of the effects of exercise training on tumor necrosis factor alpha.
CI: Confidence interval.
Figure 8 Forest plot of the effects of exercise training on C-reactive protein.
CI: Confidence interval.
Figure 9 Forest plot of the effects of exercise training on leptin.
CI: Confidence interval.
Figure 10 Forest plot of the effects of exercise training on adiponectin.
CI: Confidence interval.
- Citation: Li LY, Li SM, Pang BX, Wei JP, Wang QH. Effects of exercise training on glucose metabolism indicators and inflammatory markers in obese children and adolescents: A meta-analysis. World J Diabetes 2024; 15(6): 1353-1366
- URL: https://www.wjgnet.com/1948-9358/full/v15/i6/1353.htm
- DOI: https://dx.doi.org/10.4239/wjd.v15.i6.1353


