Copyright
©The Author(s) 2024.
World J Diabetes. Jun 15, 2024; 15(6): 1263-1271
Published online Jun 15, 2024. doi: 10.4239/wjd.v15.i6.1263
Published online Jun 15, 2024. doi: 10.4239/wjd.v15.i6.1263
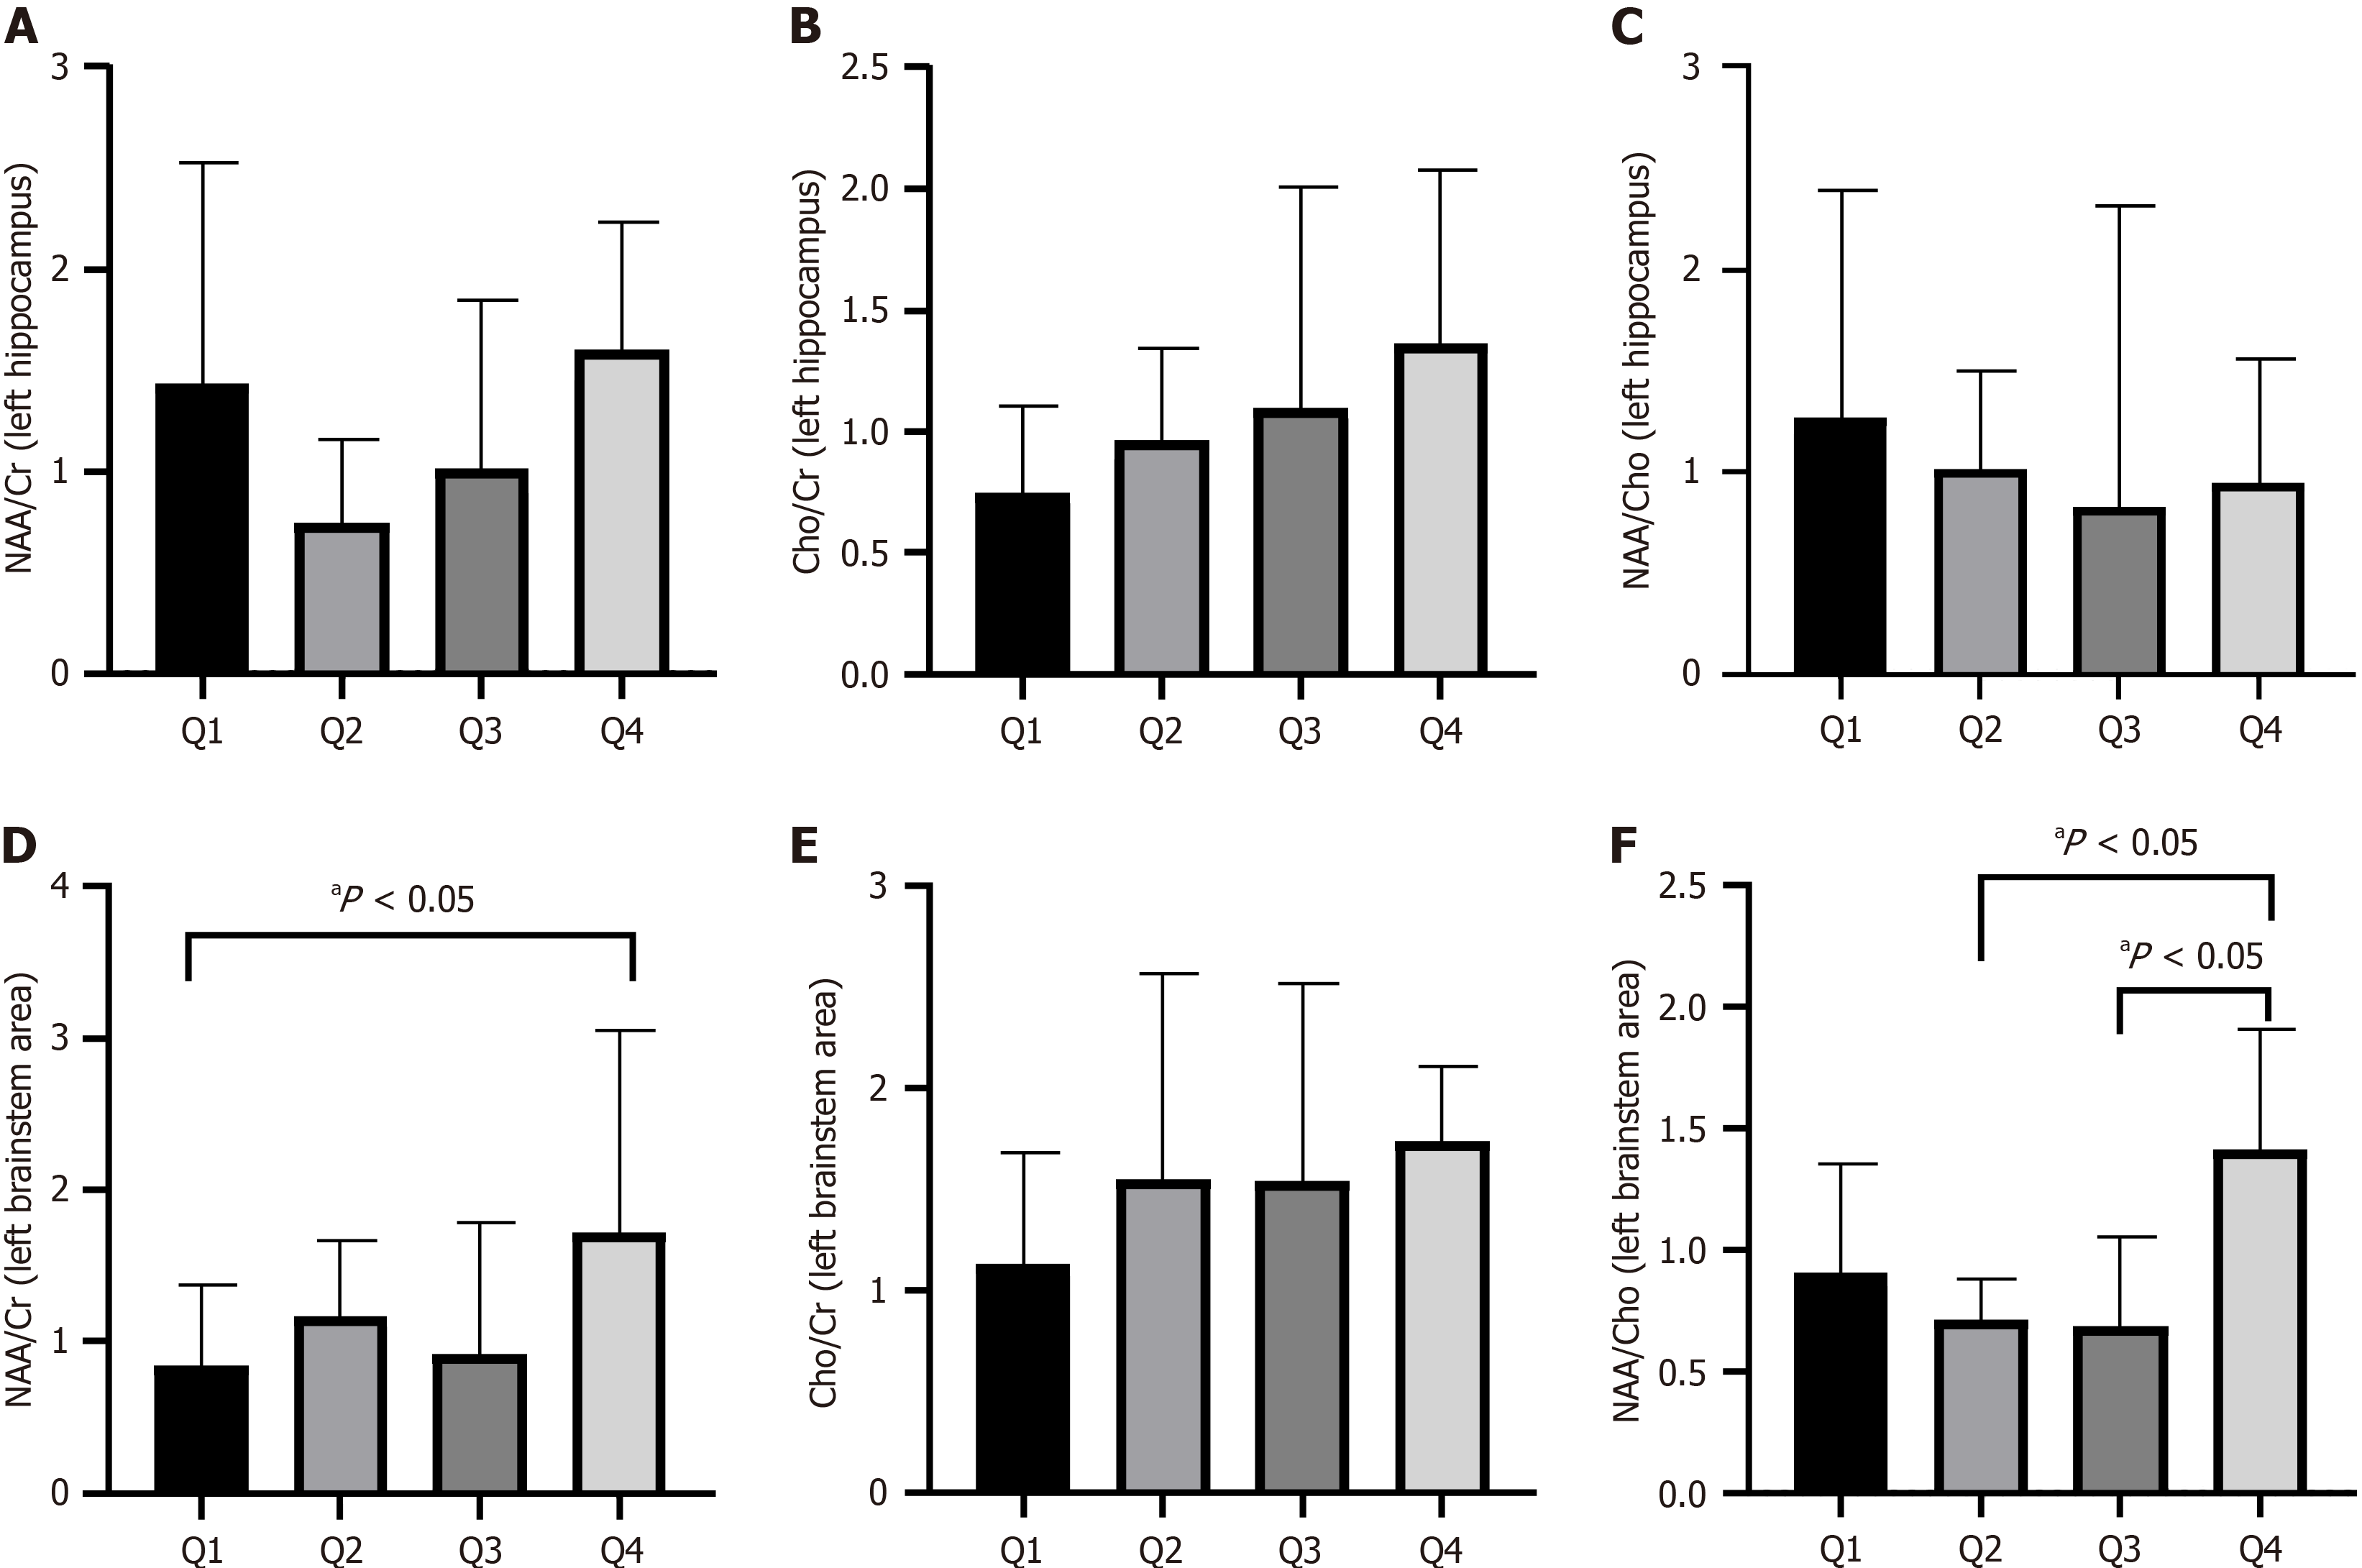
Figure 1 Cerebral neurotransmitters concentrations measured using proton magnetic resonance spectroscopy with different levels of hemoglobin A1c in patients with type 2 diabetes mellitus.
A: N-acetylaspartate/creatine (NAA/Cr, left hippocampus); B: Choline (Cho)/Cr (left hippocampus); C: NAA/Cho (left hippocampus); D: NAA/Cr (left brainstem area); E: Cho/Cr (left brainstem area); F: NAA/Cho (left brainstem area). Q1: Hemoglobin A1c (HbA1c) < 7.875%; Q2: HbA1c 7.875%-9.050%; Q3: HbA1c 9.050%-11.200%; Q4: HbA1c ≥ 11.200%. NAA: N-acetylaspartate; Cr: Creatine; Cho: Choline.
- Citation: Gao XY, Zhou CX, Li HM, Cheng M, Chen D, Li ZY, Feng B, Song J. Correlation between cerebral neurotransmitters levels by proton magnetic resonance spectroscopy and HbA1c in patients with type 2 diabetes. World J Diabetes 2024; 15(6): 1263-1271
- URL: https://www.wjgnet.com/1948-9358/full/v15/i6/1263.htm
- DOI: https://dx.doi.org/10.4239/wjd.v15.i6.1263


