©The Author(s) 2024.
World J Diabetes. Nov 15, 2024; 15(11): 2203-2219
Published online Nov 15, 2024. doi: 10.4239/wjd.v15.i11.2203
Published online Nov 15, 2024. doi: 10.4239/wjd.v15.i11.2203
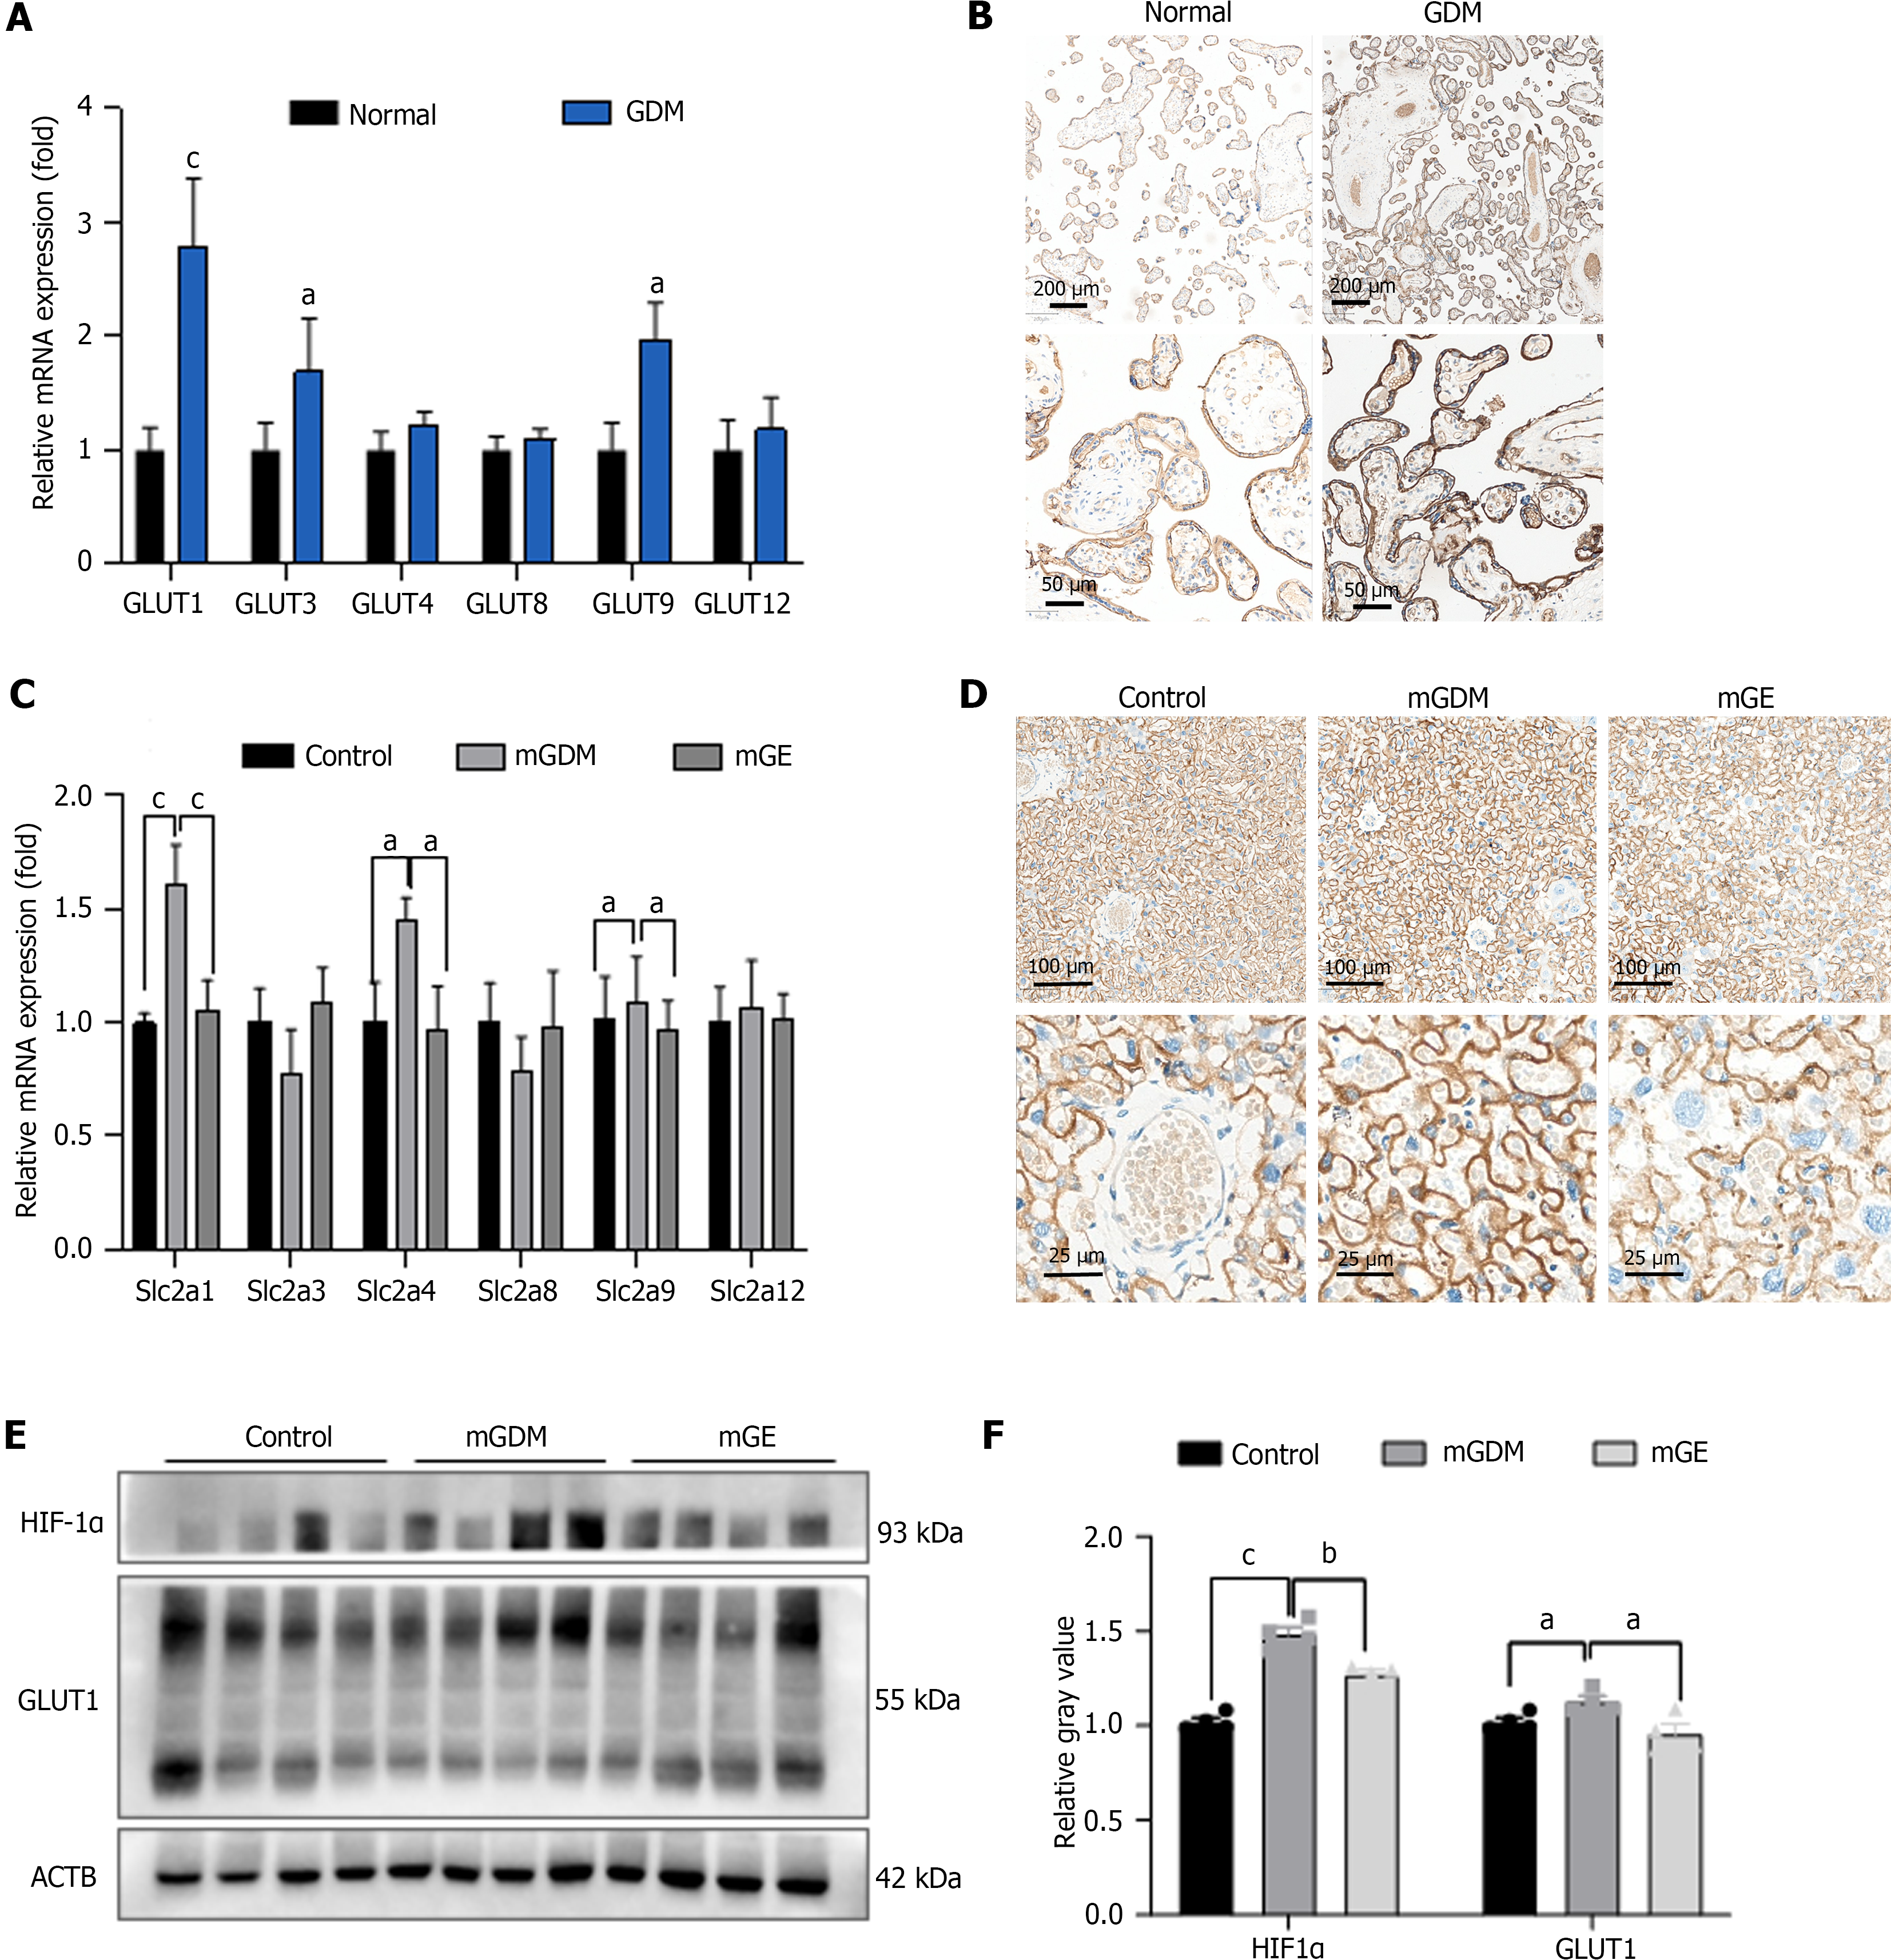
Figure 1 The expression of glucose transporter in placentas of humans and mice.
A: Reverse-transcriptase polymerase chain reaction (RT-PCR) analysis results of glucose transporter (GLUT) 1, 3, 4, 8, 9, and 12 expression levels in human placenta,normal (n = 20), GDM (n = 20),; B: The immunohistochemistry analysis results of GLUT 1 expression in human placenta. Scale bar = 200 μm and 50 μm; C: The RT-PCR analysis results of slc2a1, slc2a3, slc2a4, slc2a8, slc2a9, and slc2a12 expression in mice placenta, control (n= 5), mGDM (n = 5), and mGE (n = 5); D: Immunohistochemistry analysis results of GLUT 1 expression in mice placenta. Scale bar = 100 μm and 25μm; E: Western blot analysis results of hypoxia inducible factor-1α (HIF-1α), GLUT 1 expression in mice placenta; Relative gray value of HIF-1α, GLUT1 expression in the control, mGDM and mGE groups. Data are presented as the mean ± SEM. aP < 0.05; bP < 0.01; cP < 0.001. GLUT: Glucose transporter; HIF-1α: Hypoxia inducible factor-1α; GDM: Gestational diabetes mellitus; mGDM: Mouse with gestational diabetes mellitus; ACTB: β-Actin.
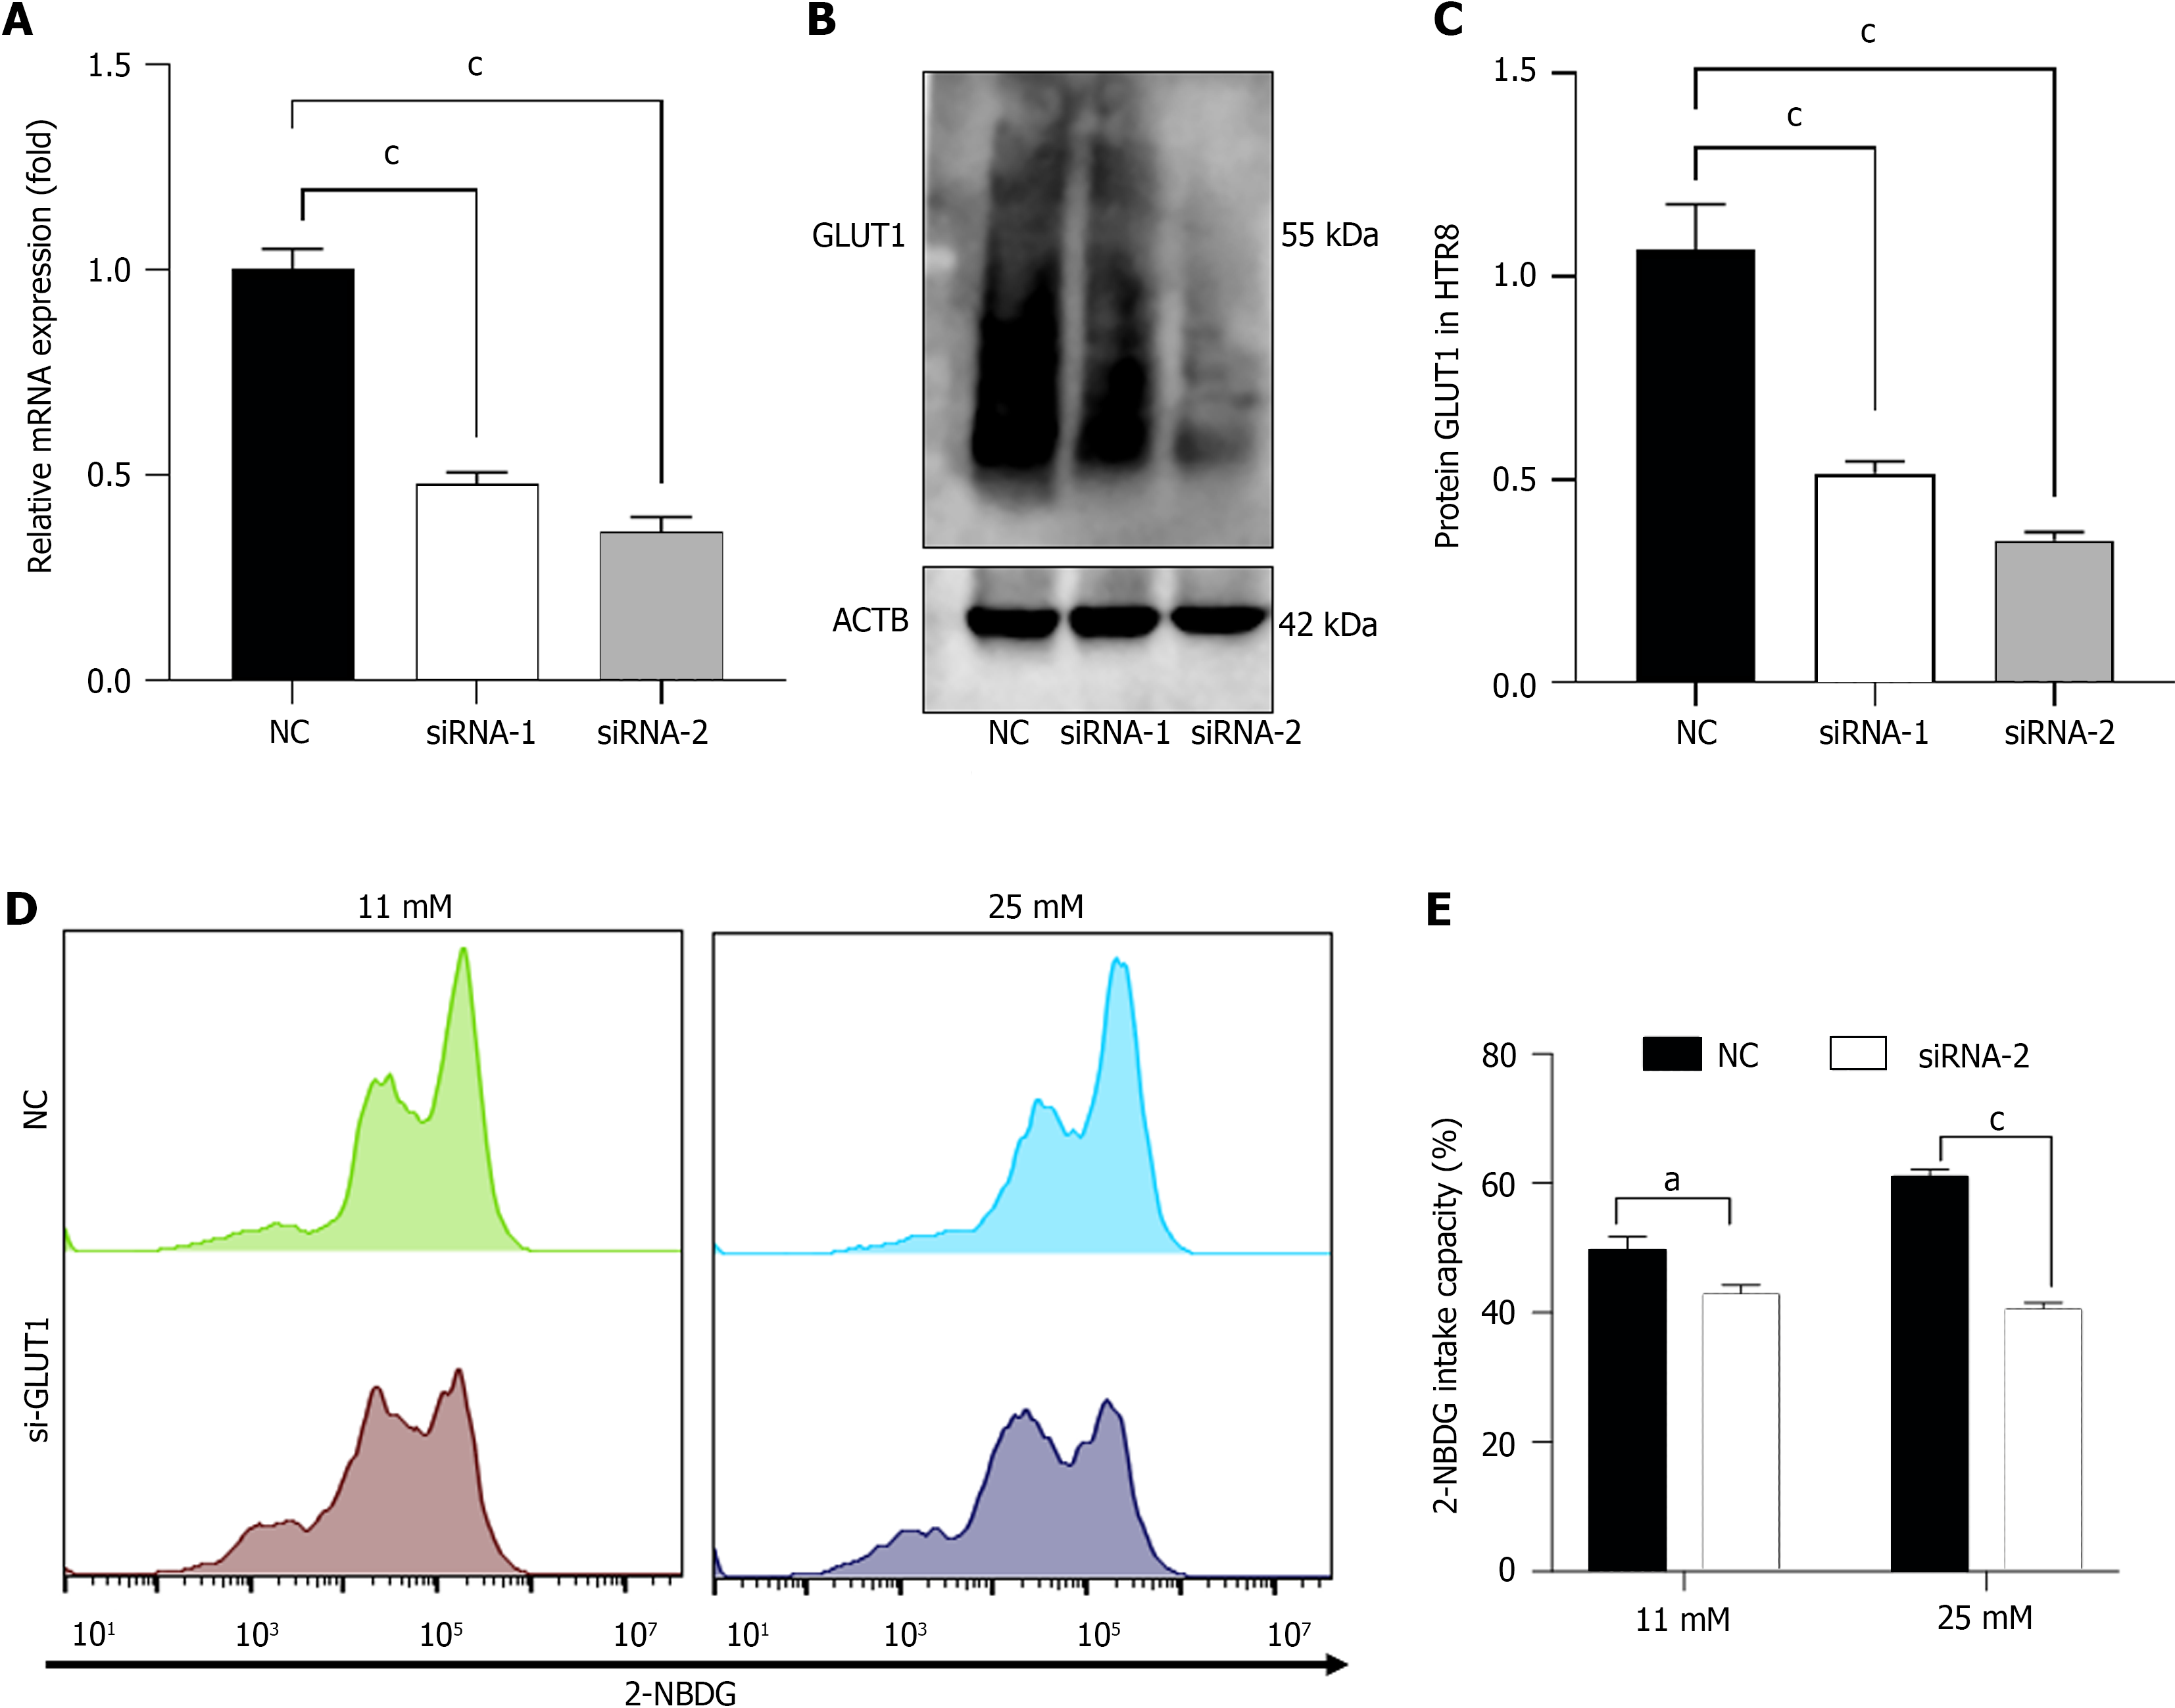
Figure 2 Downregulation of glucose transporter 1 inhibits the glucose intake capability of high glucose-treated HTR8/SVneo cells.
A and B: mRNA and protein expression of glucose transporter 1 in high glucose-treated transfected HTR8/SVneo cells were detected by reverse-transcriptase polymerase chain reaction and western blotting; C and D: Glucose intake capacity of HTR8/SVneo cells was analyzed using flow cytometry. Data are presented as the mean ± SEM. aP < 0.05; bP < 0.01; cP < 0.001. aP < 0.05; bP < 0.01; cP < 0.001. GLUT: Glucose transporter; NC: Negative control; 2-NBDG: 2-Deoxy-2- [(7-nitro-2,1,3-benzoxadiazol-4-yl) amino]-D-glucose; ACTB: β-Actin.
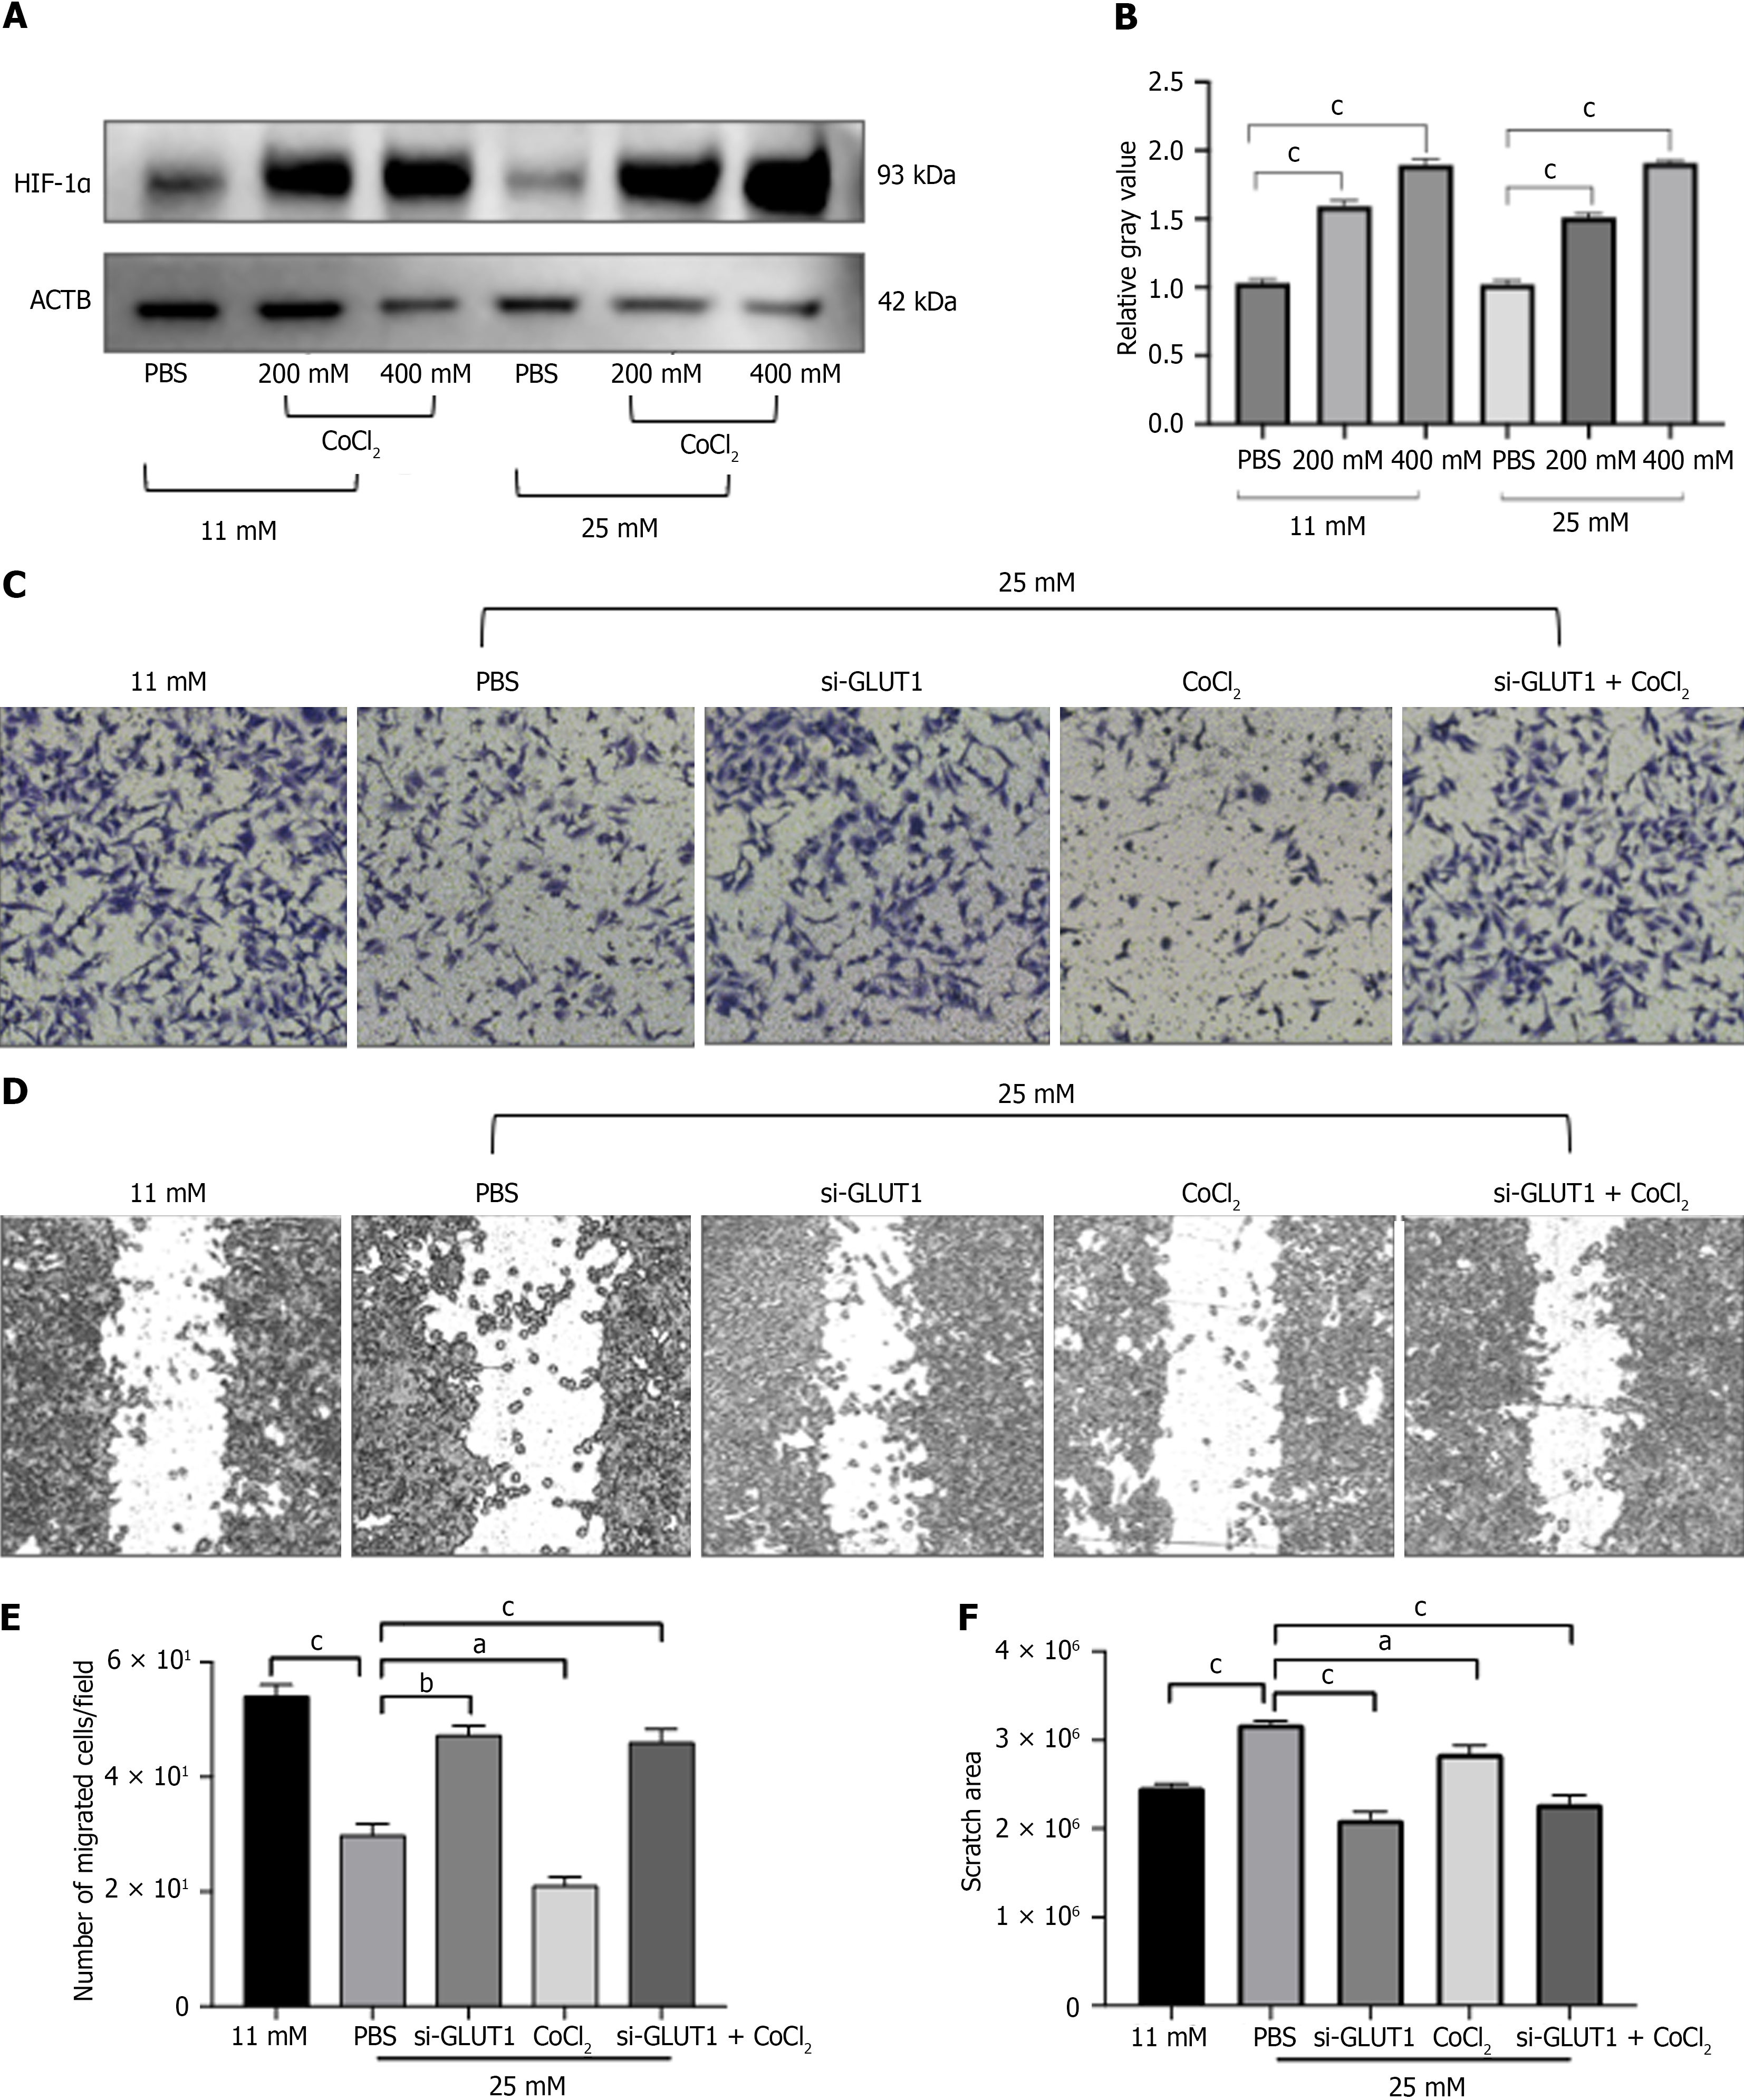
Figure 3 High glucose and hypoxia inhibit the migration capacity of HTR8/SVneo cells.
A: Western blot analysis results of HIF-1a expression in HTR8/SVneo cells after treatment with 200 μM and 400 μM CoCl2; B and D: Migration capacity of HTR8/SVneo cells analyzed by Transwell assay; C and E: Wound-healing assay. Data are presented as the mean ± SEM. aP < 0.05; bP < 0.01; cP < 0.001. GLUT: Glucose transporter; HIF-1α: Hypoxia inducible factor-1α; CoCl2: Cobalt chloride; ACTB: β-Actin; PBS: Phosphate buffered saline.
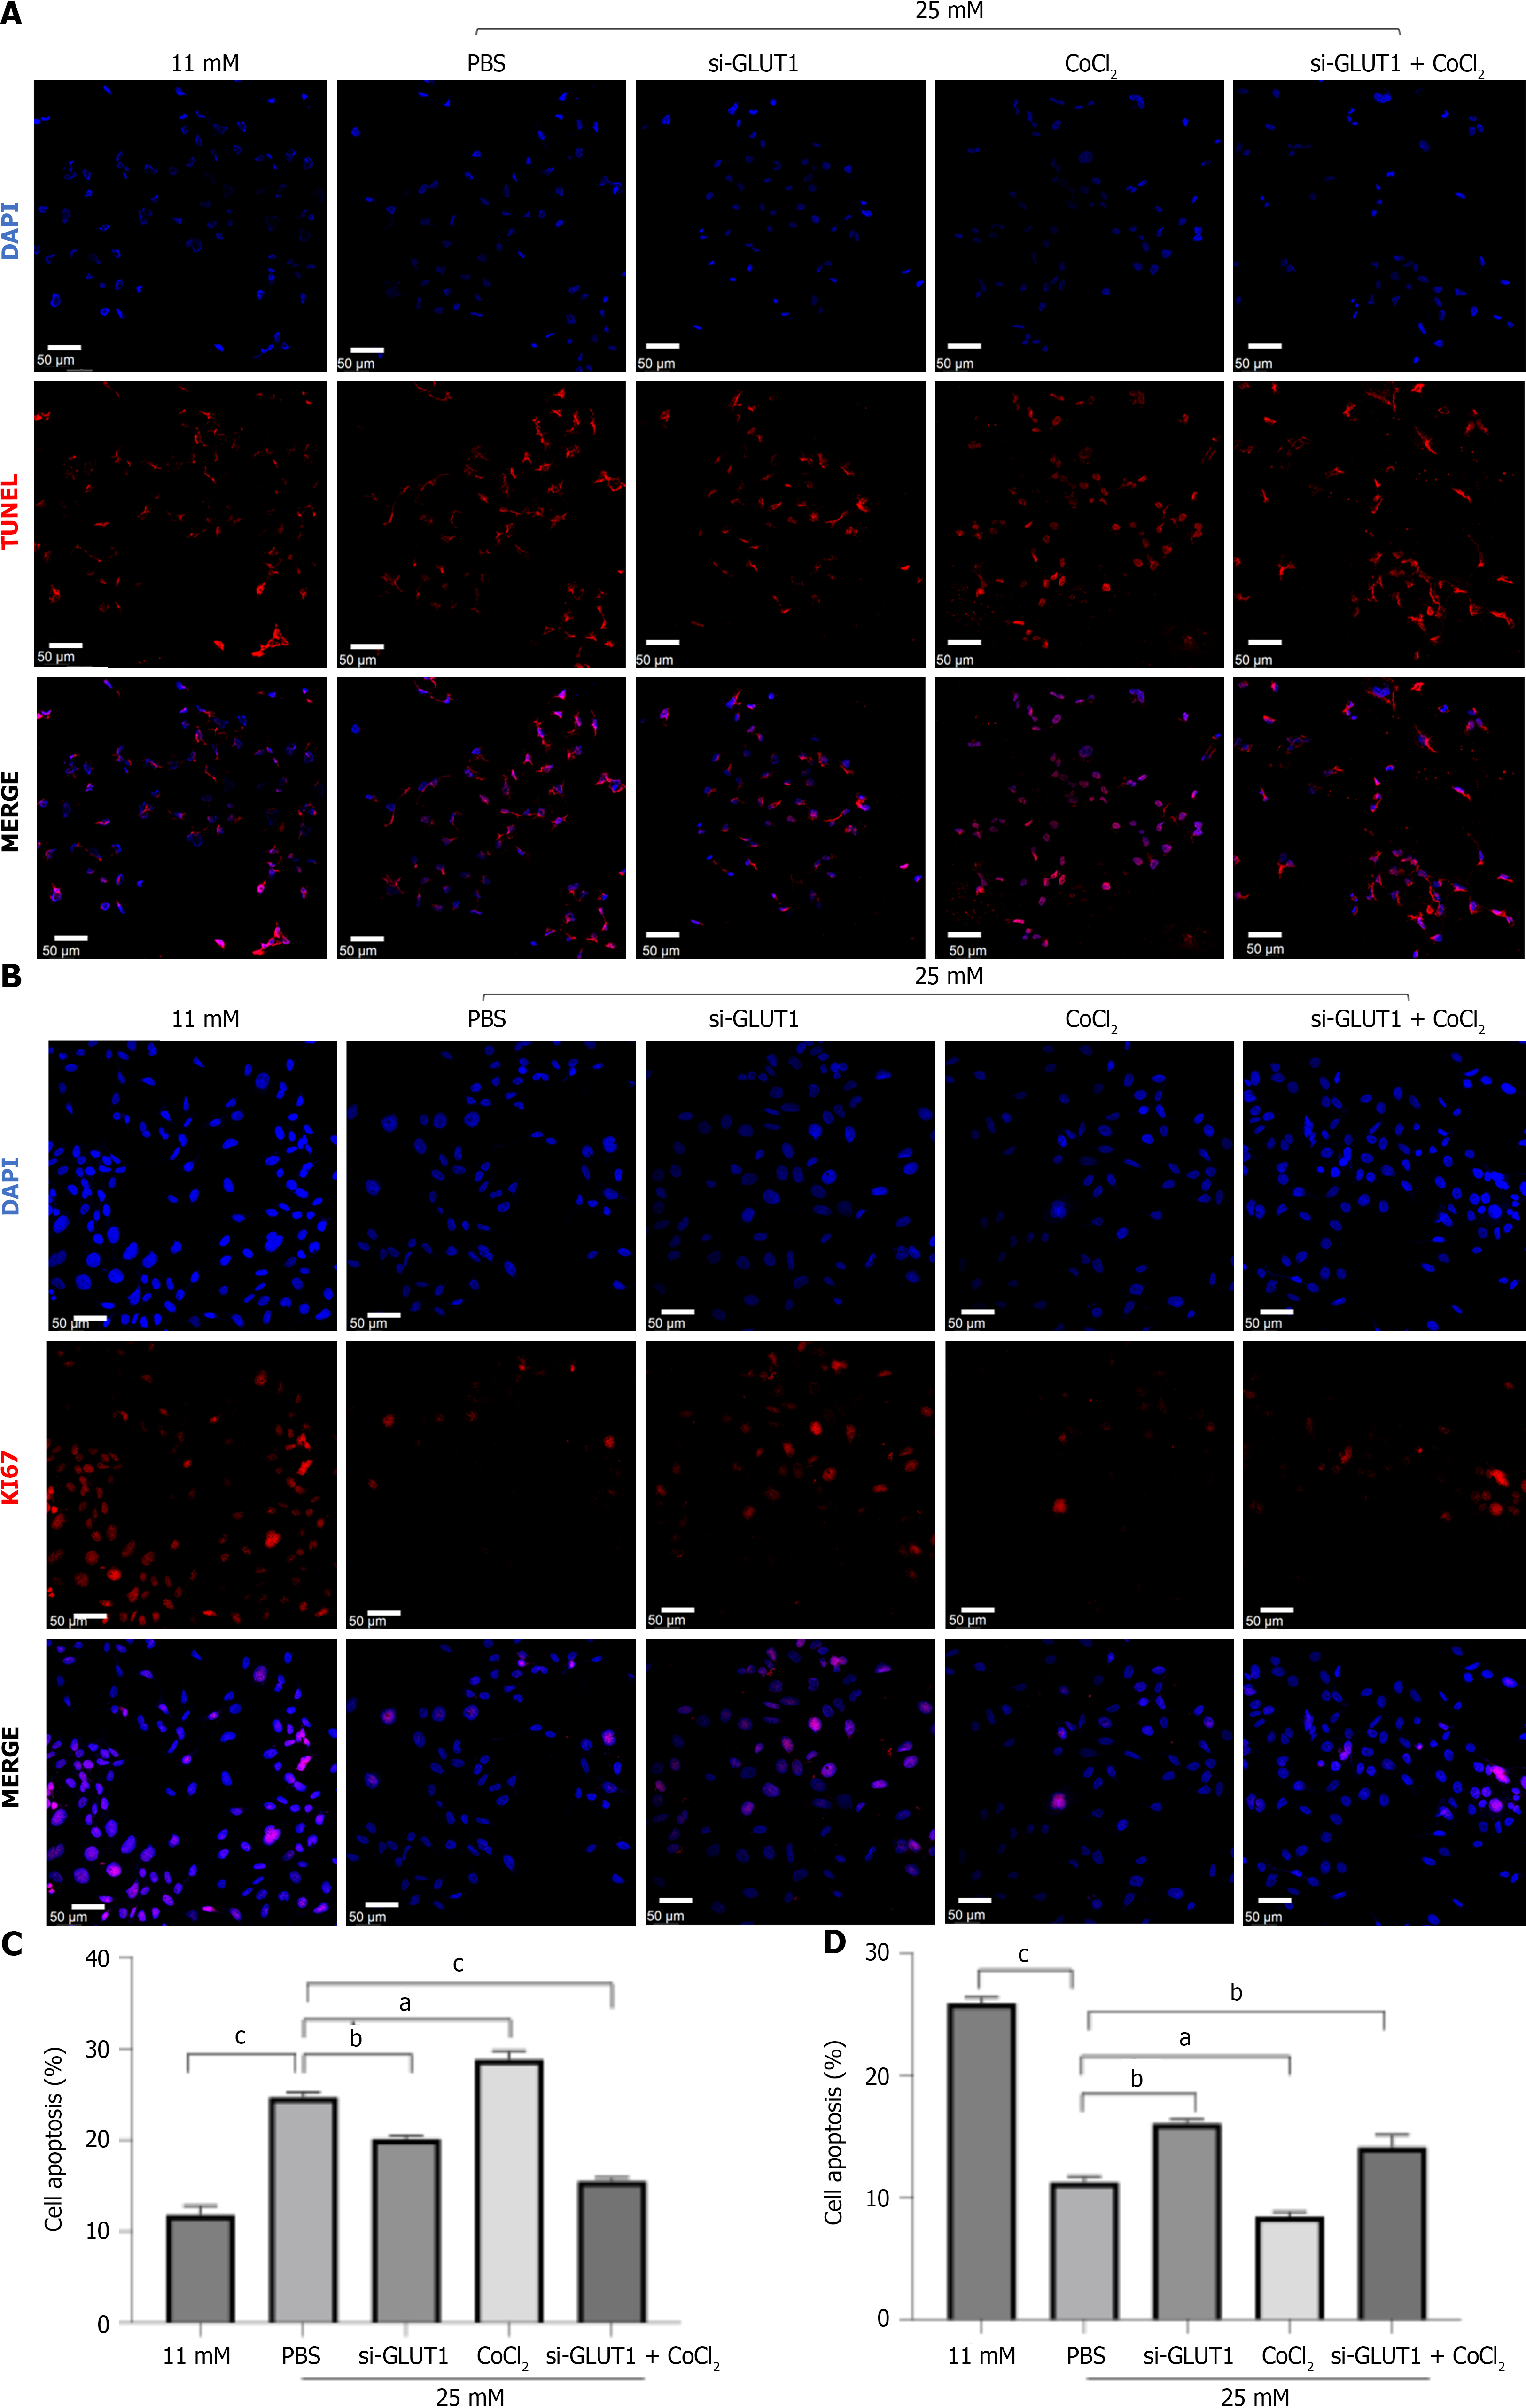
Figure 4 High glucose and hypoxia promote apoptosis and inhibit proliferation of HTR8/SVneo cells.
A and C: TUNEL staining assay results of cell apoptosis; B and D: Ki67 immunofluorescence results of cell proliferation. Data are presented as the mean ± SEM. aP < 0.05; bP < 0.01; cP < 0.001. GLUT: Glucose transporter; CoCl2: Cobalt chloride; ACTB: β-Actin; PBS: Phosphate buffered saline.
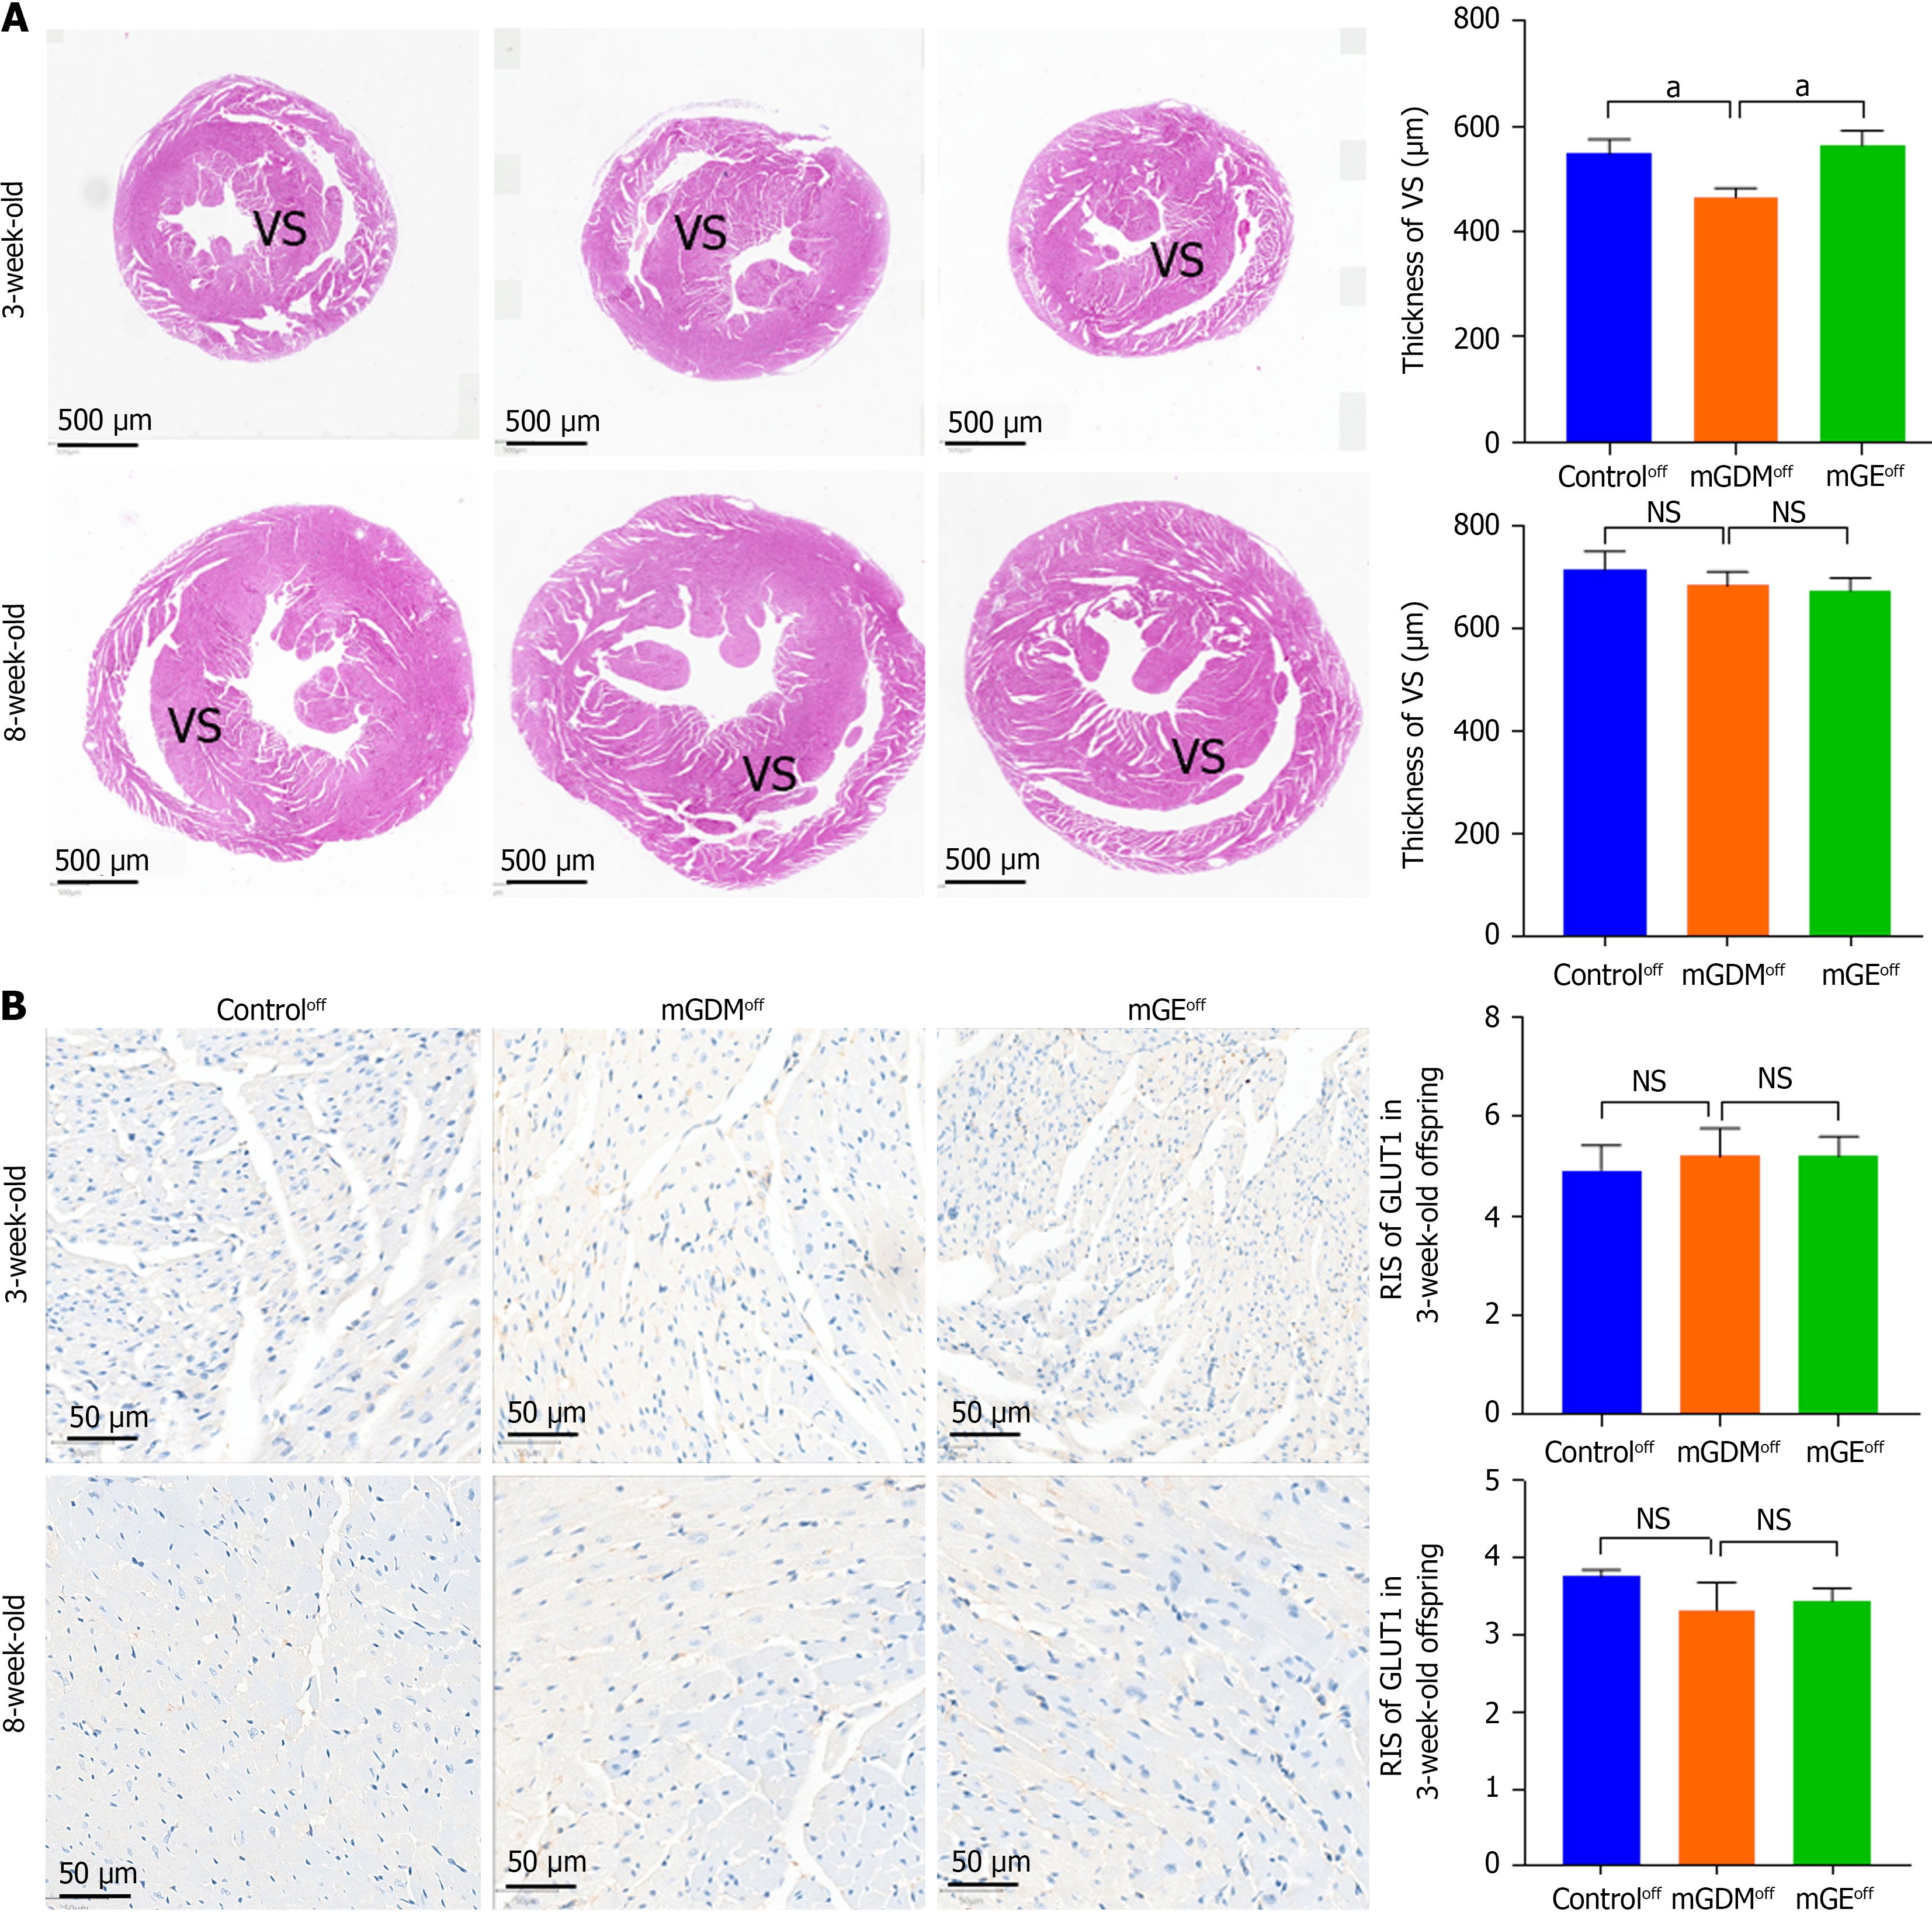
Figure 5 Development and glucose transporter 1 expression in the heart of offspring in the offspring of control group, offspring of mouse with gestational diabetes mellitus group, and offspring of gestational diabetes mellitus mouse models with exercise group.
A: Hematoxylin and eosin staining was used to evaluate ventricular septum of 3- and 8-week-old offspring. Scale bar = 500 μm; B: Immunohistochemical analysis results of glucose transporter 1 expression in the hearts of 3- and 8-week-old offspring. Scale bar = 50 μm. Offspring of control group (n = 5); Offspring of mouse with gestational diabetes mellitus group (n = 5); Offspring of gestational diabetes mellitus mouse models with exercise group (n = 5). Data are presented as the mean ± SEM. aP < 0.05; bP < 0.01; cP < 0.001.
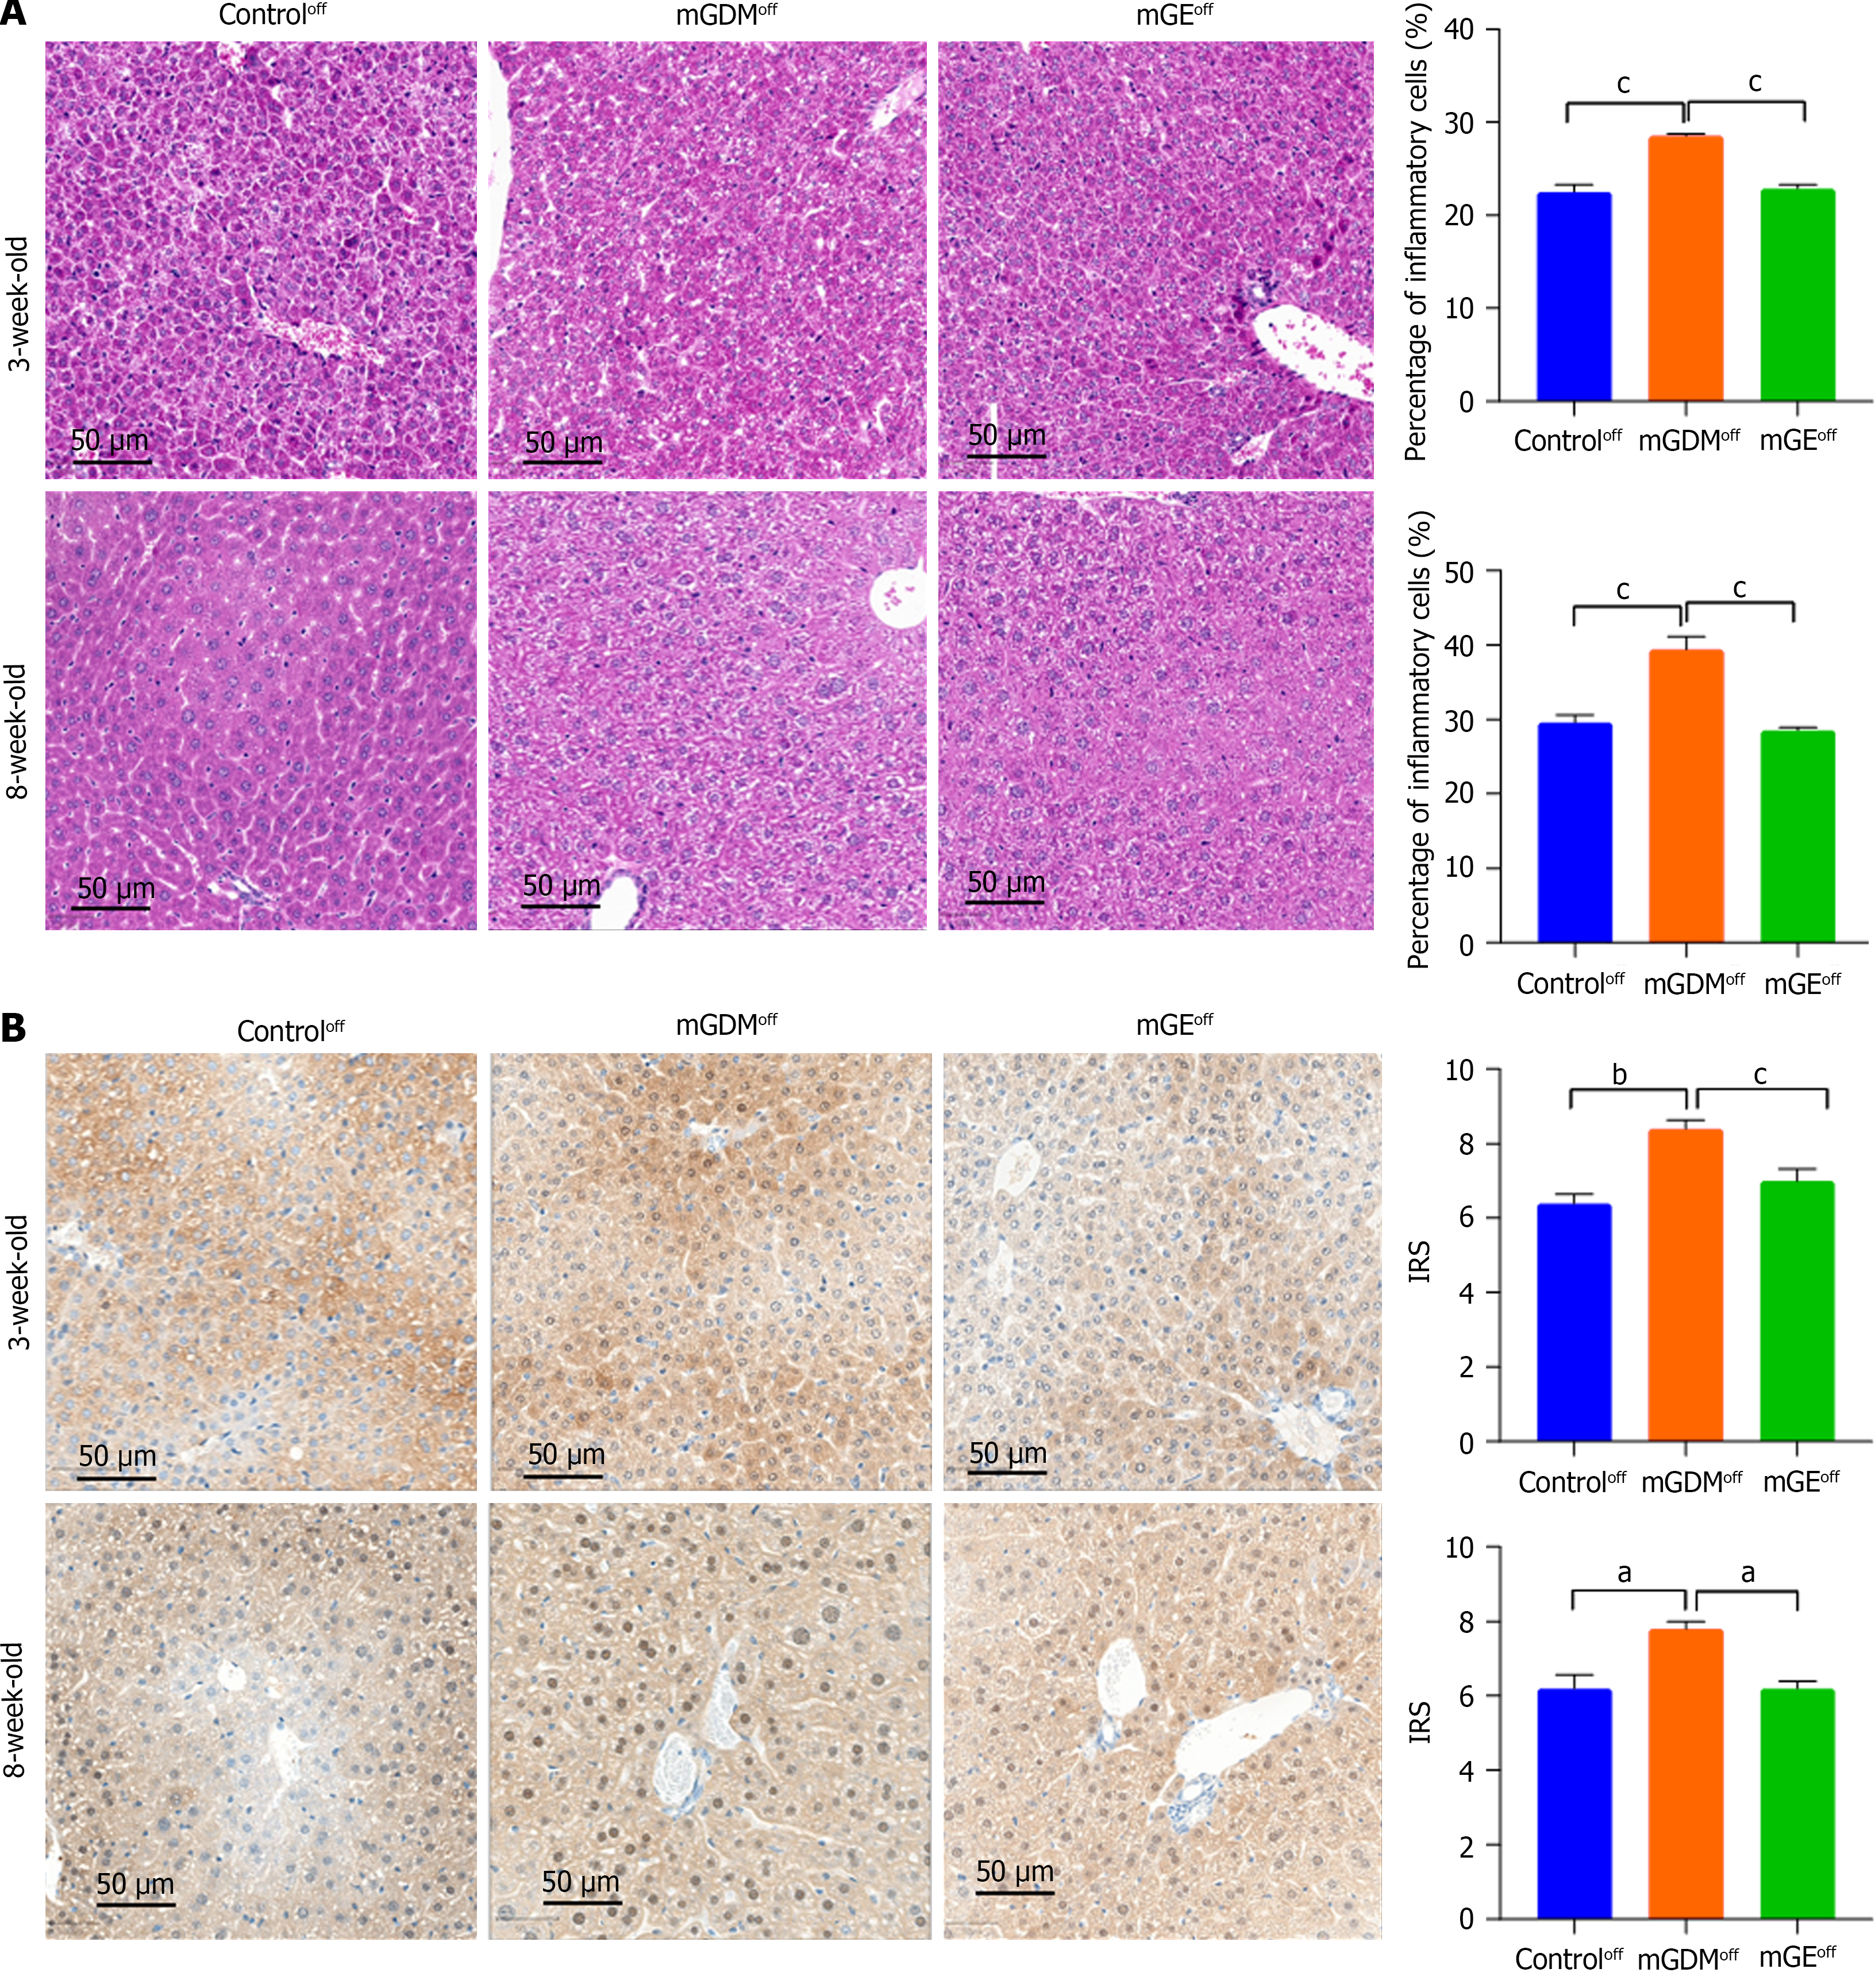
Figure 6 Development and glucose transporter 1 expression in the livers of offspring in the offspring of control group, offspring of mouse with gestational diabetes mellitus group, and offspring of gestational diabetes mellitus mouse models with exercise group.
A: Hematoxylin and eosin staining of inflammatory cells analysis are shown for the livers of 3- and 8-week-old offspring. Scale bar = 50 μm; B: The immunohistochemistry analysis of glucose transporter 1 expression for the livers of 3- and 8-week-old offspring. Scale bar = 50 μm. Offspring of control group (n = 5); Offspring of mouse with gestational diabetes mellitus group (n = 5); Offspring of gestational diabetes mellitus mouse models with exercise group (n = 5). Data are presented as the mean ± SEM. aP < 0.05; bP < 0.01; cP < 0.001. mGDM: Mouse with gestational diabetes mellitus; mGE: Gestational diabetes mellitus mouse models with exercise.
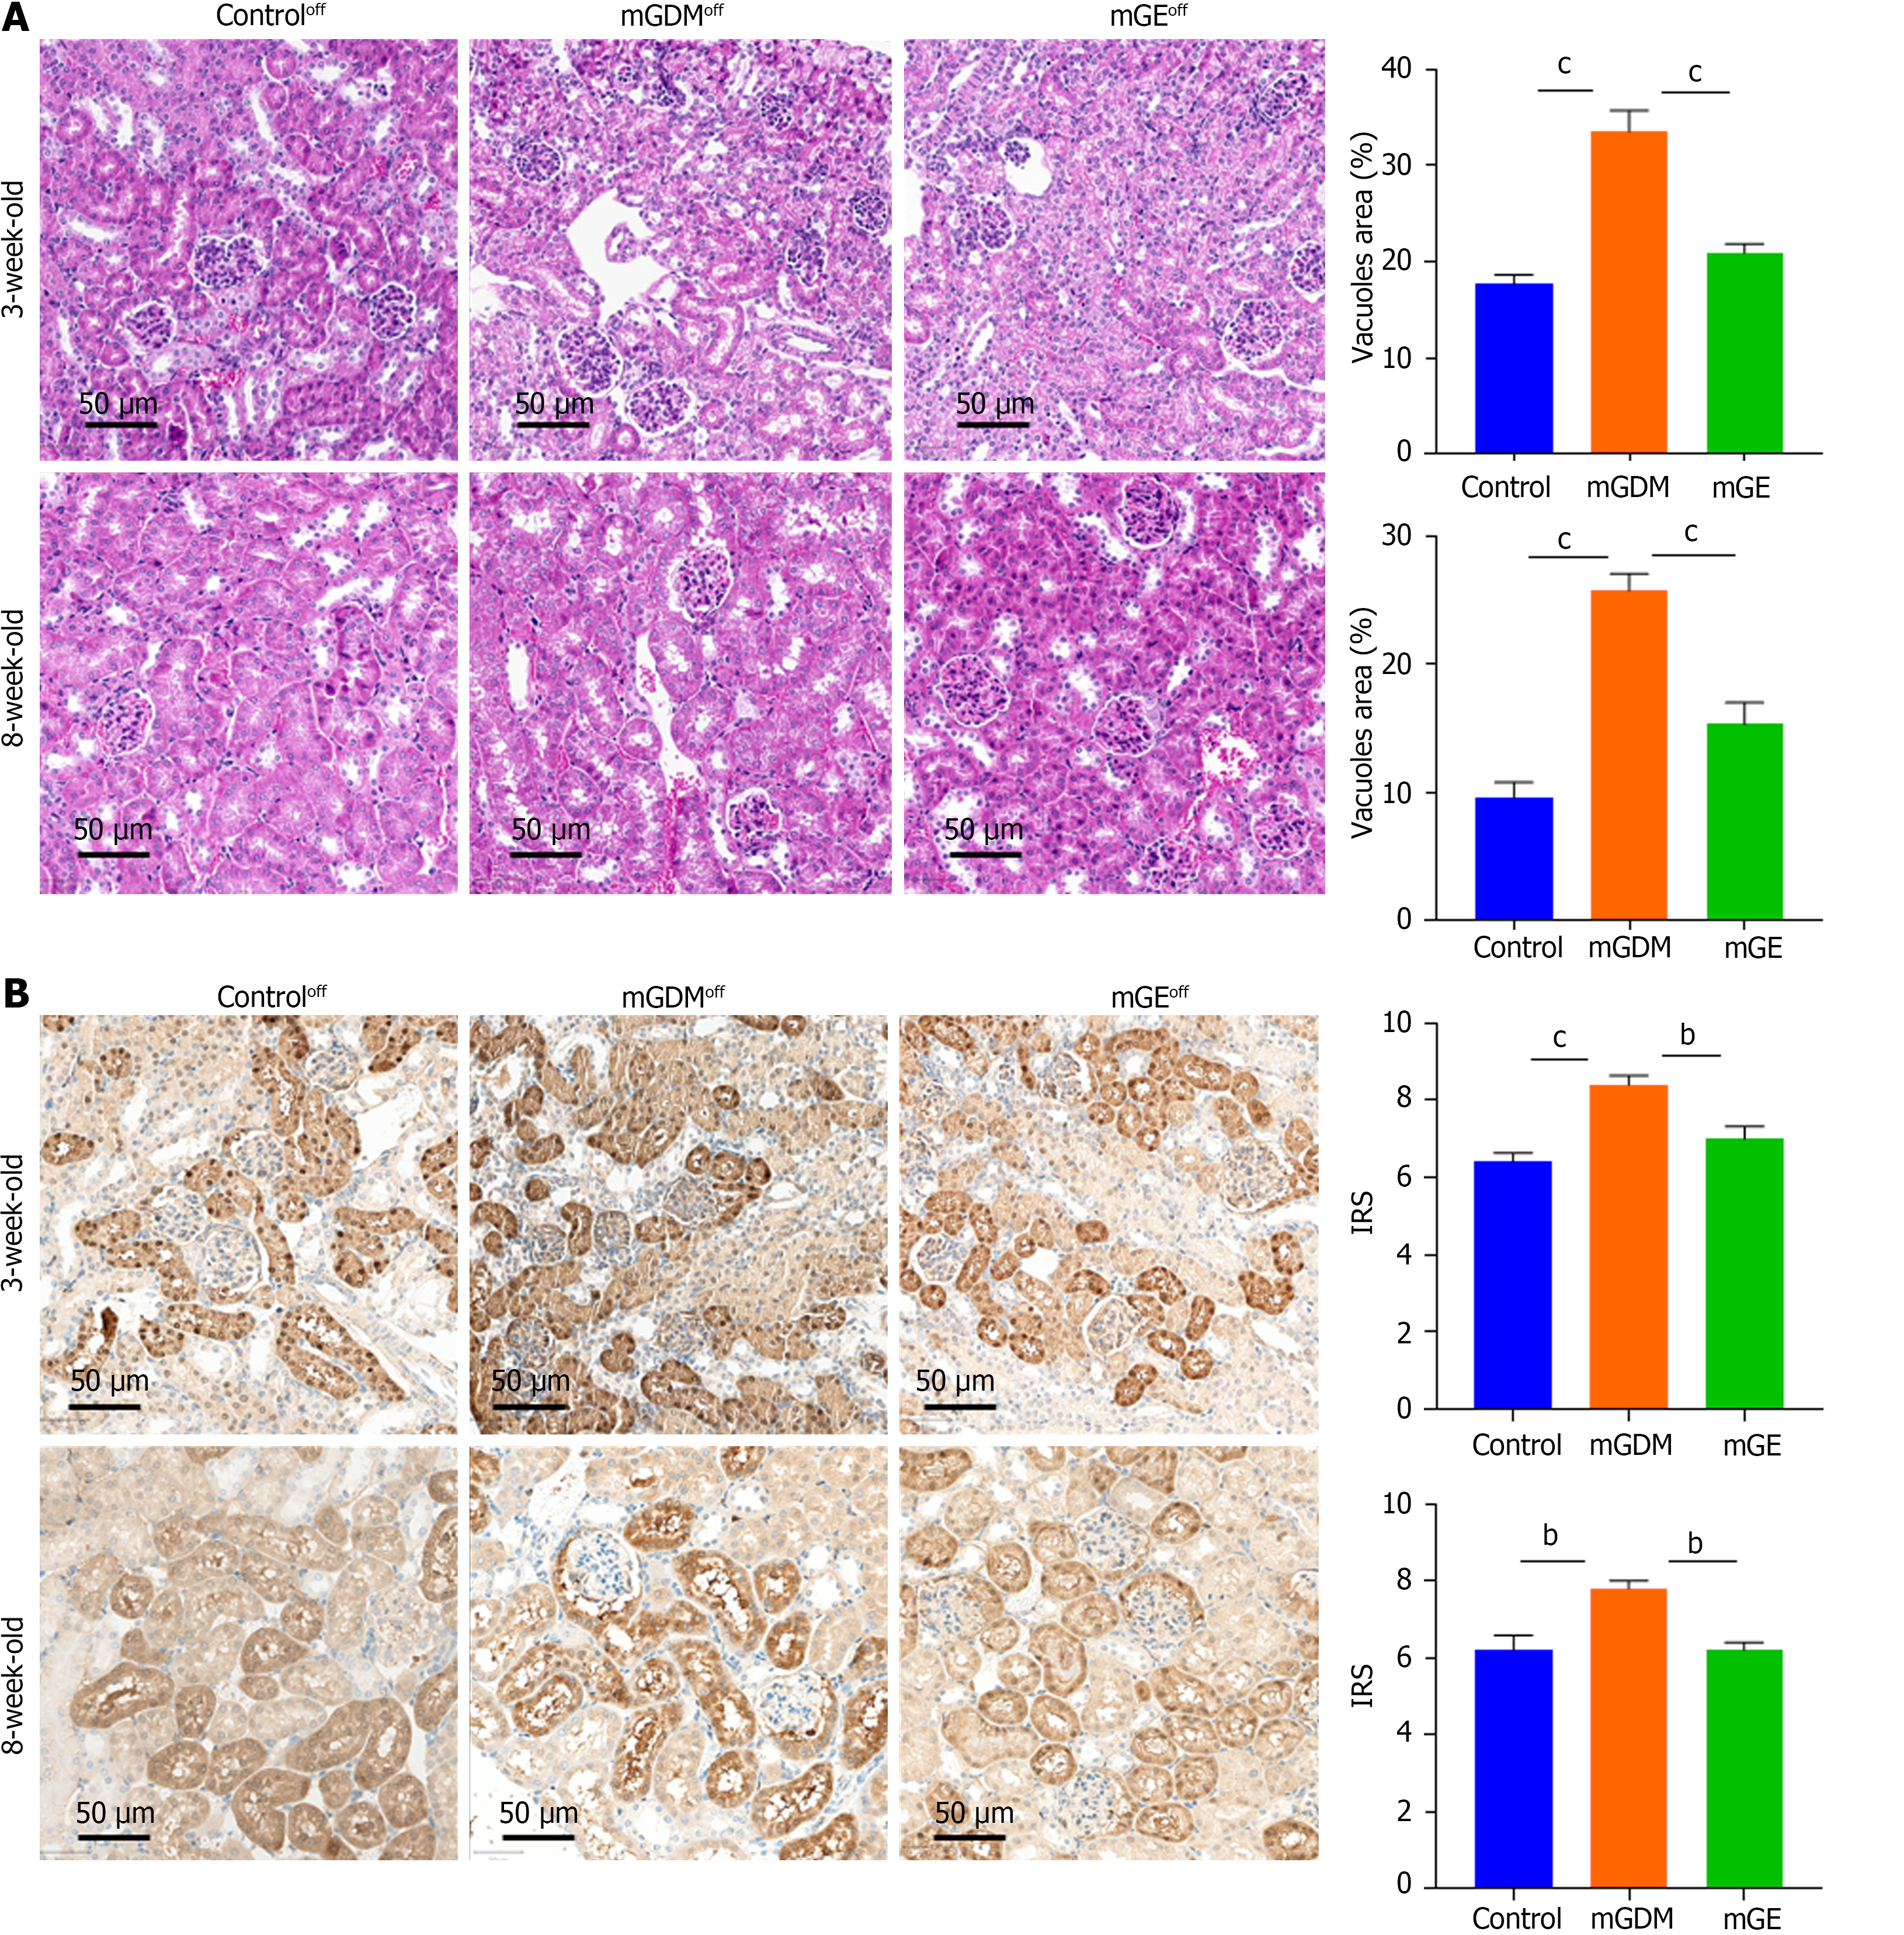
Figure 7 Development and glucose transporter 1 expression in kidneys of offspring in the offspring of control group, offspring of mouse with gestational diabetes mellitus group, and offspring of gestational diabetes mellitus mouse models with exercise group.
A: The hematoxylin and eosin staining of vacuole area for the kidneys of 3- and 8-wk-old offspring. Scale bar = 50 μm; B. Immunohistochemistry analysis of glucose transporter 1 expression in the kidneys of 3- and 8-week-old offspring. Scale bar = 50 μm. Offspring of control group (n = 5); Offspring of mouse with gestational diabetes mellitus group (n = 5); Offspring of gestational diabetes mellitus mouse models with exercise group (n = 5). Data are presented as the mean ± SEM. aP < 0.05; bP < 0.01; cP < 0.001. mGDM: Mouse with gestational diabetes mellitus; mGE: Gestational diabetes mellitus mouse models with exercise.
- Citation: Tang YB, Wang LS, Wu YH, Zhang LX, Hu LY, Wu Q, Zhou ML, Liang ZX. Effect of exercise during pregnancy on offspring development through ameliorating high glucose and hypoxia in gestational diabetes mellitus. World J Diabetes 2024; 15(11): 2203-2219
- URL: https://www.wjgnet.com/1948-9358/full/v15/i11/2203.htm
- DOI: https://dx.doi.org/10.4239/wjd.v15.i11.2203


