©The Author(s) 2024.
World J Diabetes. Oct 15, 2024; 15(10): 2070-2080
Published online Oct 15, 2024. doi: 10.4239/wjd.v15.i10.2070
Published online Oct 15, 2024. doi: 10.4239/wjd.v15.i10.2070
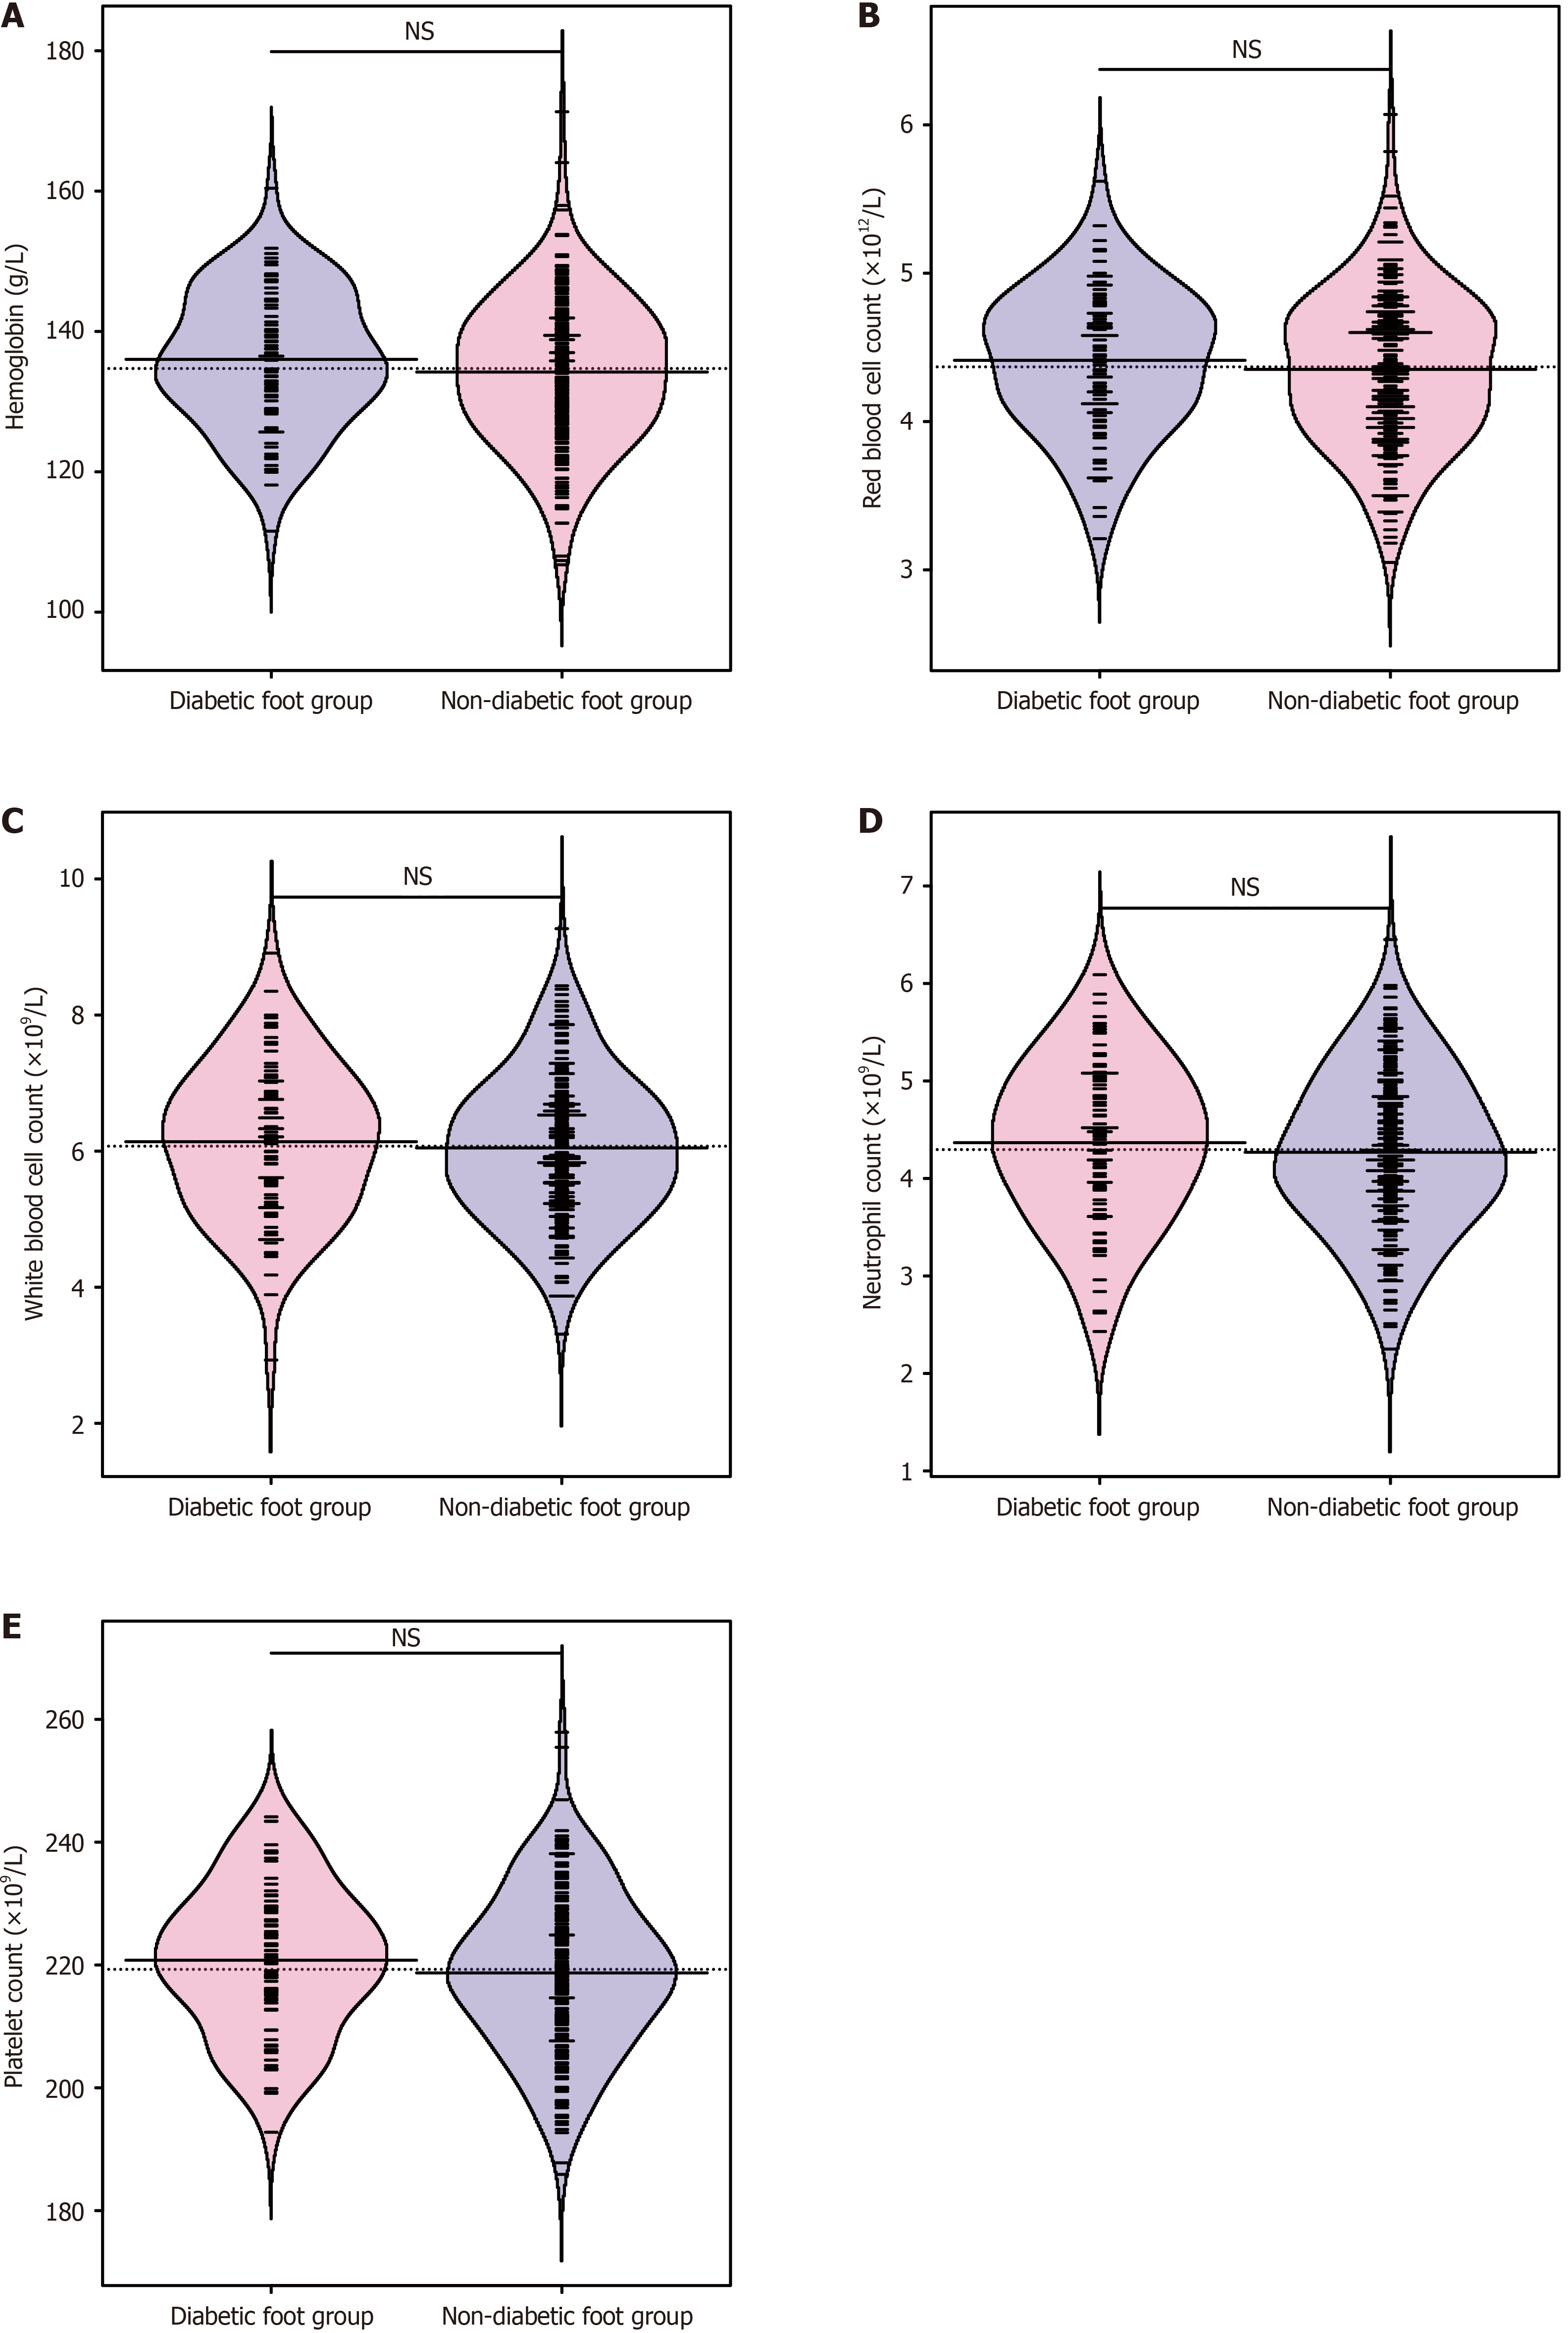
Figure 1 Blood Routine Examination.
A: Hemoglobin concentration; B: Red blood cell count; C: White blood cell count; D: Neutrophil count; E: Platelet. NS: No significant difference.
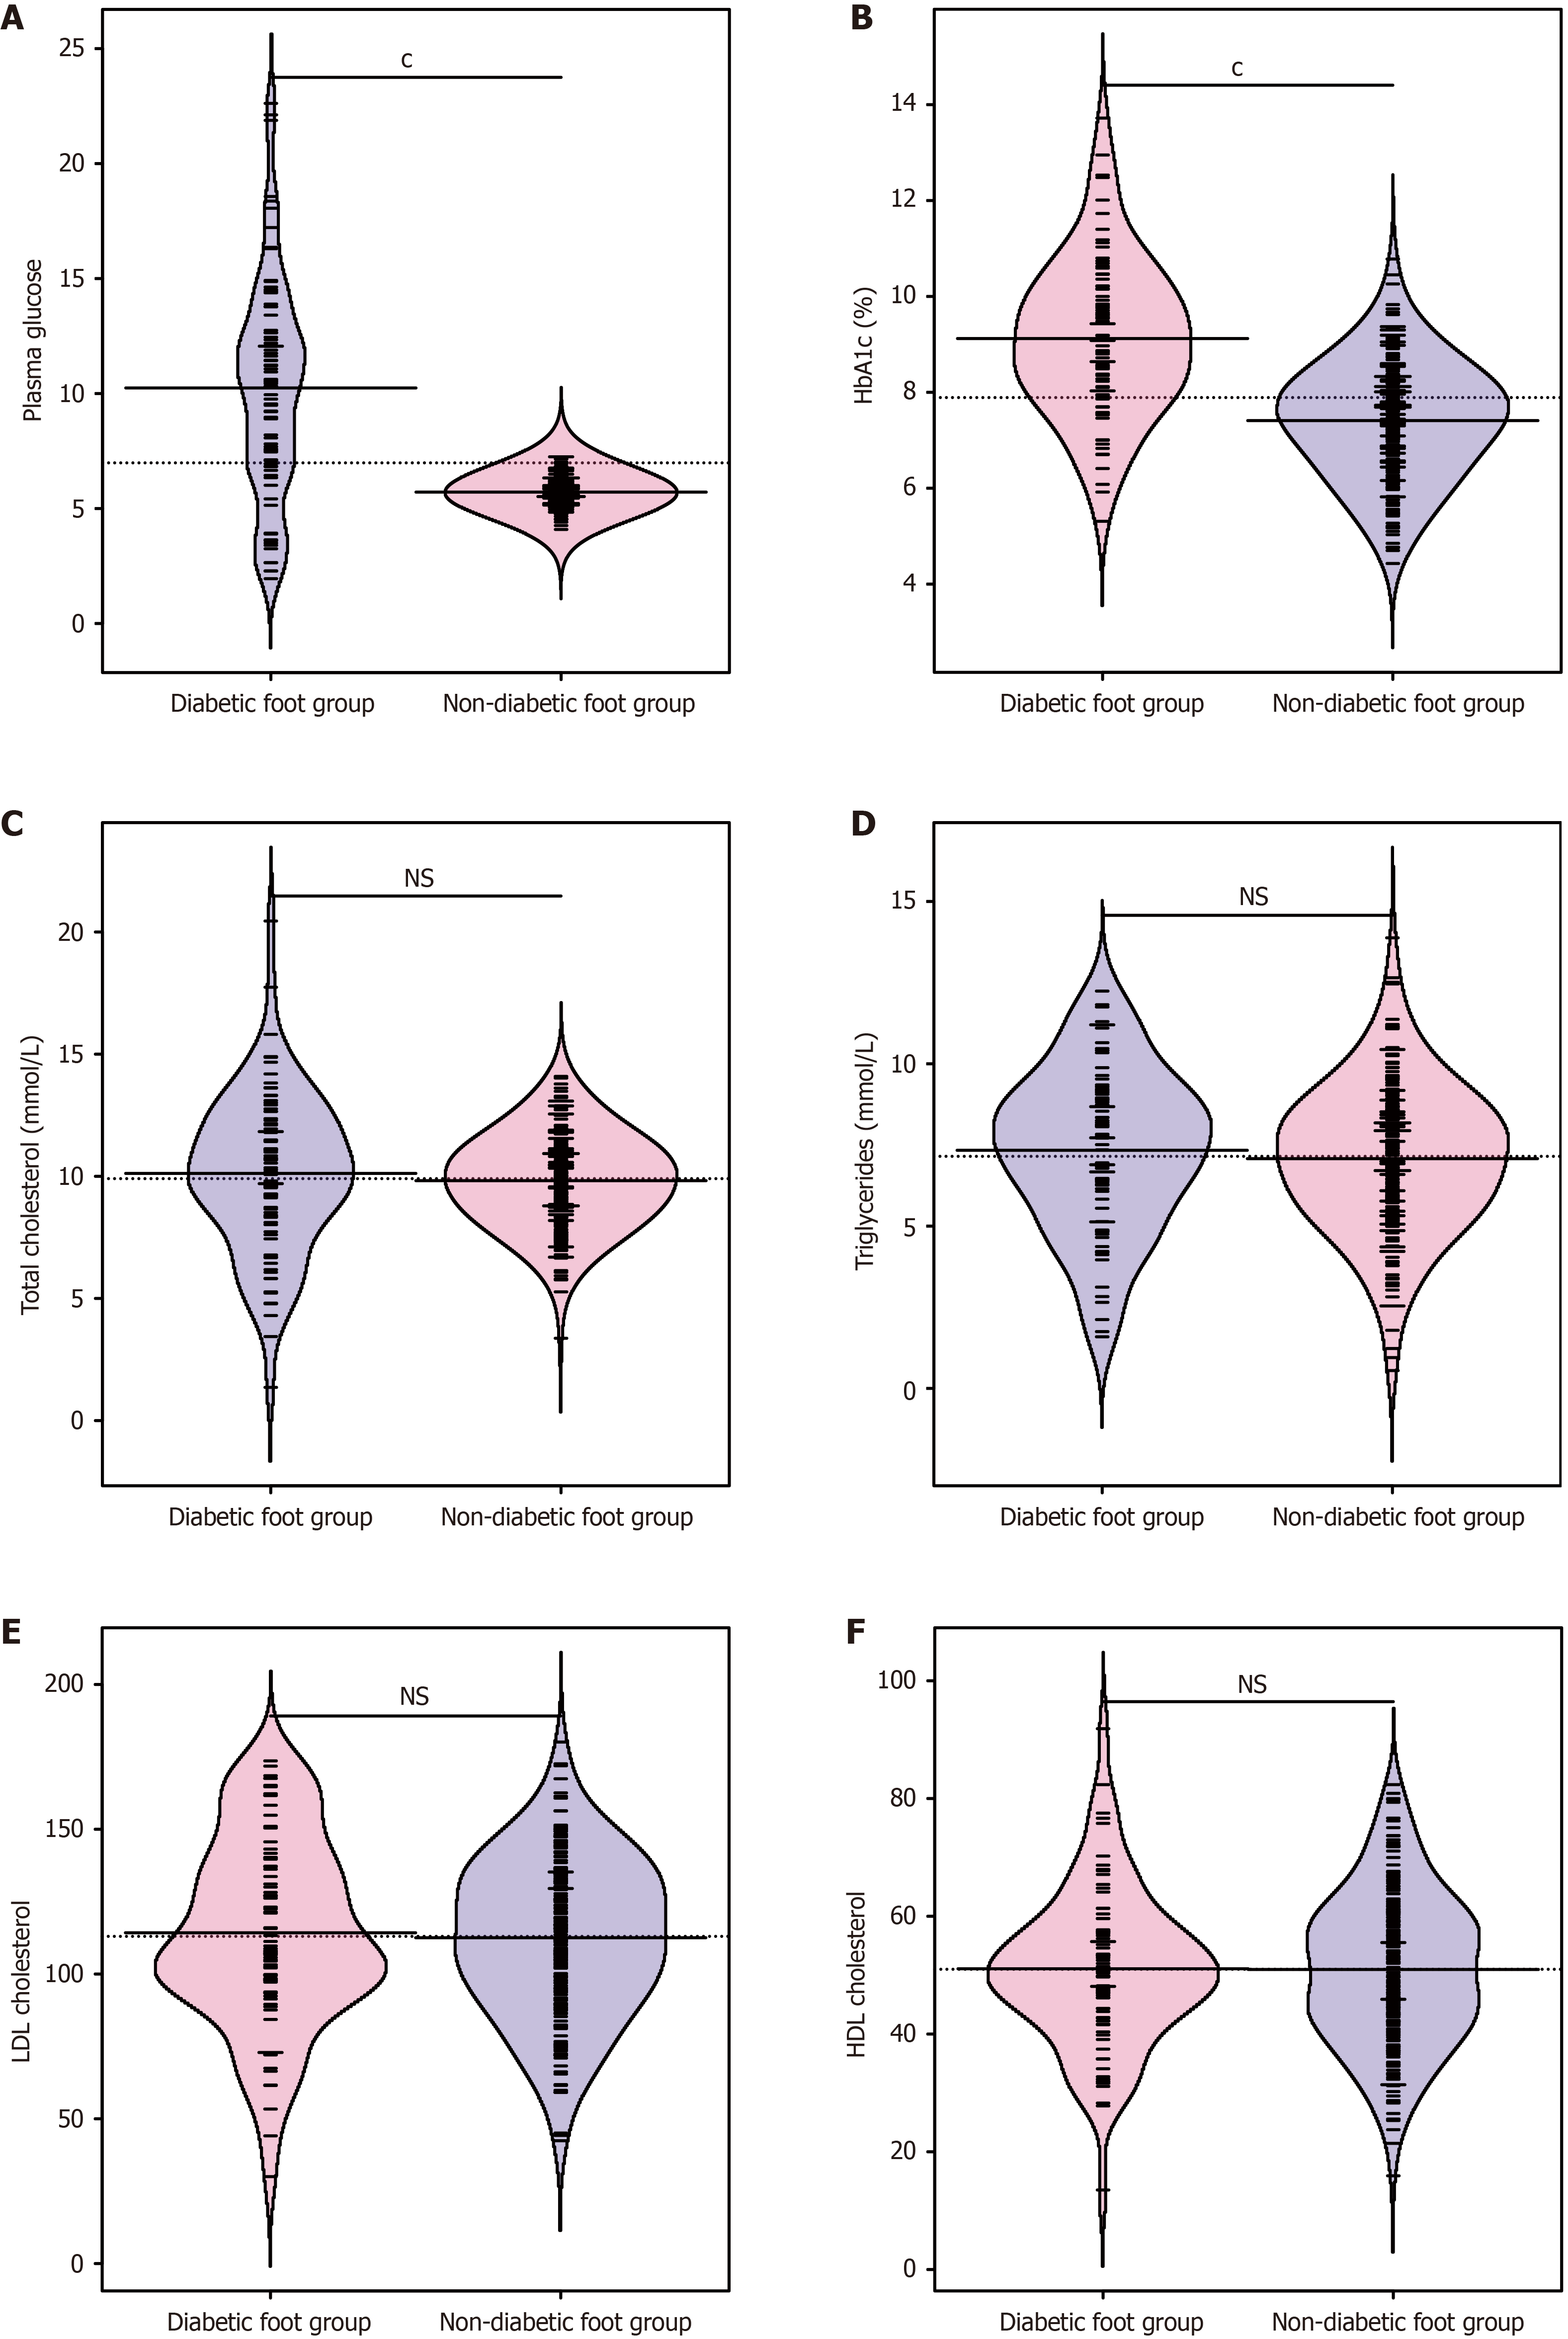
Figure 2 Blood glucose and lipid levels.
A: Plasma glucose; B: HbA1c; C: Total cholesterol; D: Triglycerides; E: Low-density lipoprotein cholesterol; F: High-density lipoprotein cholesterol. cP < 0.001; NS: No significant difference.
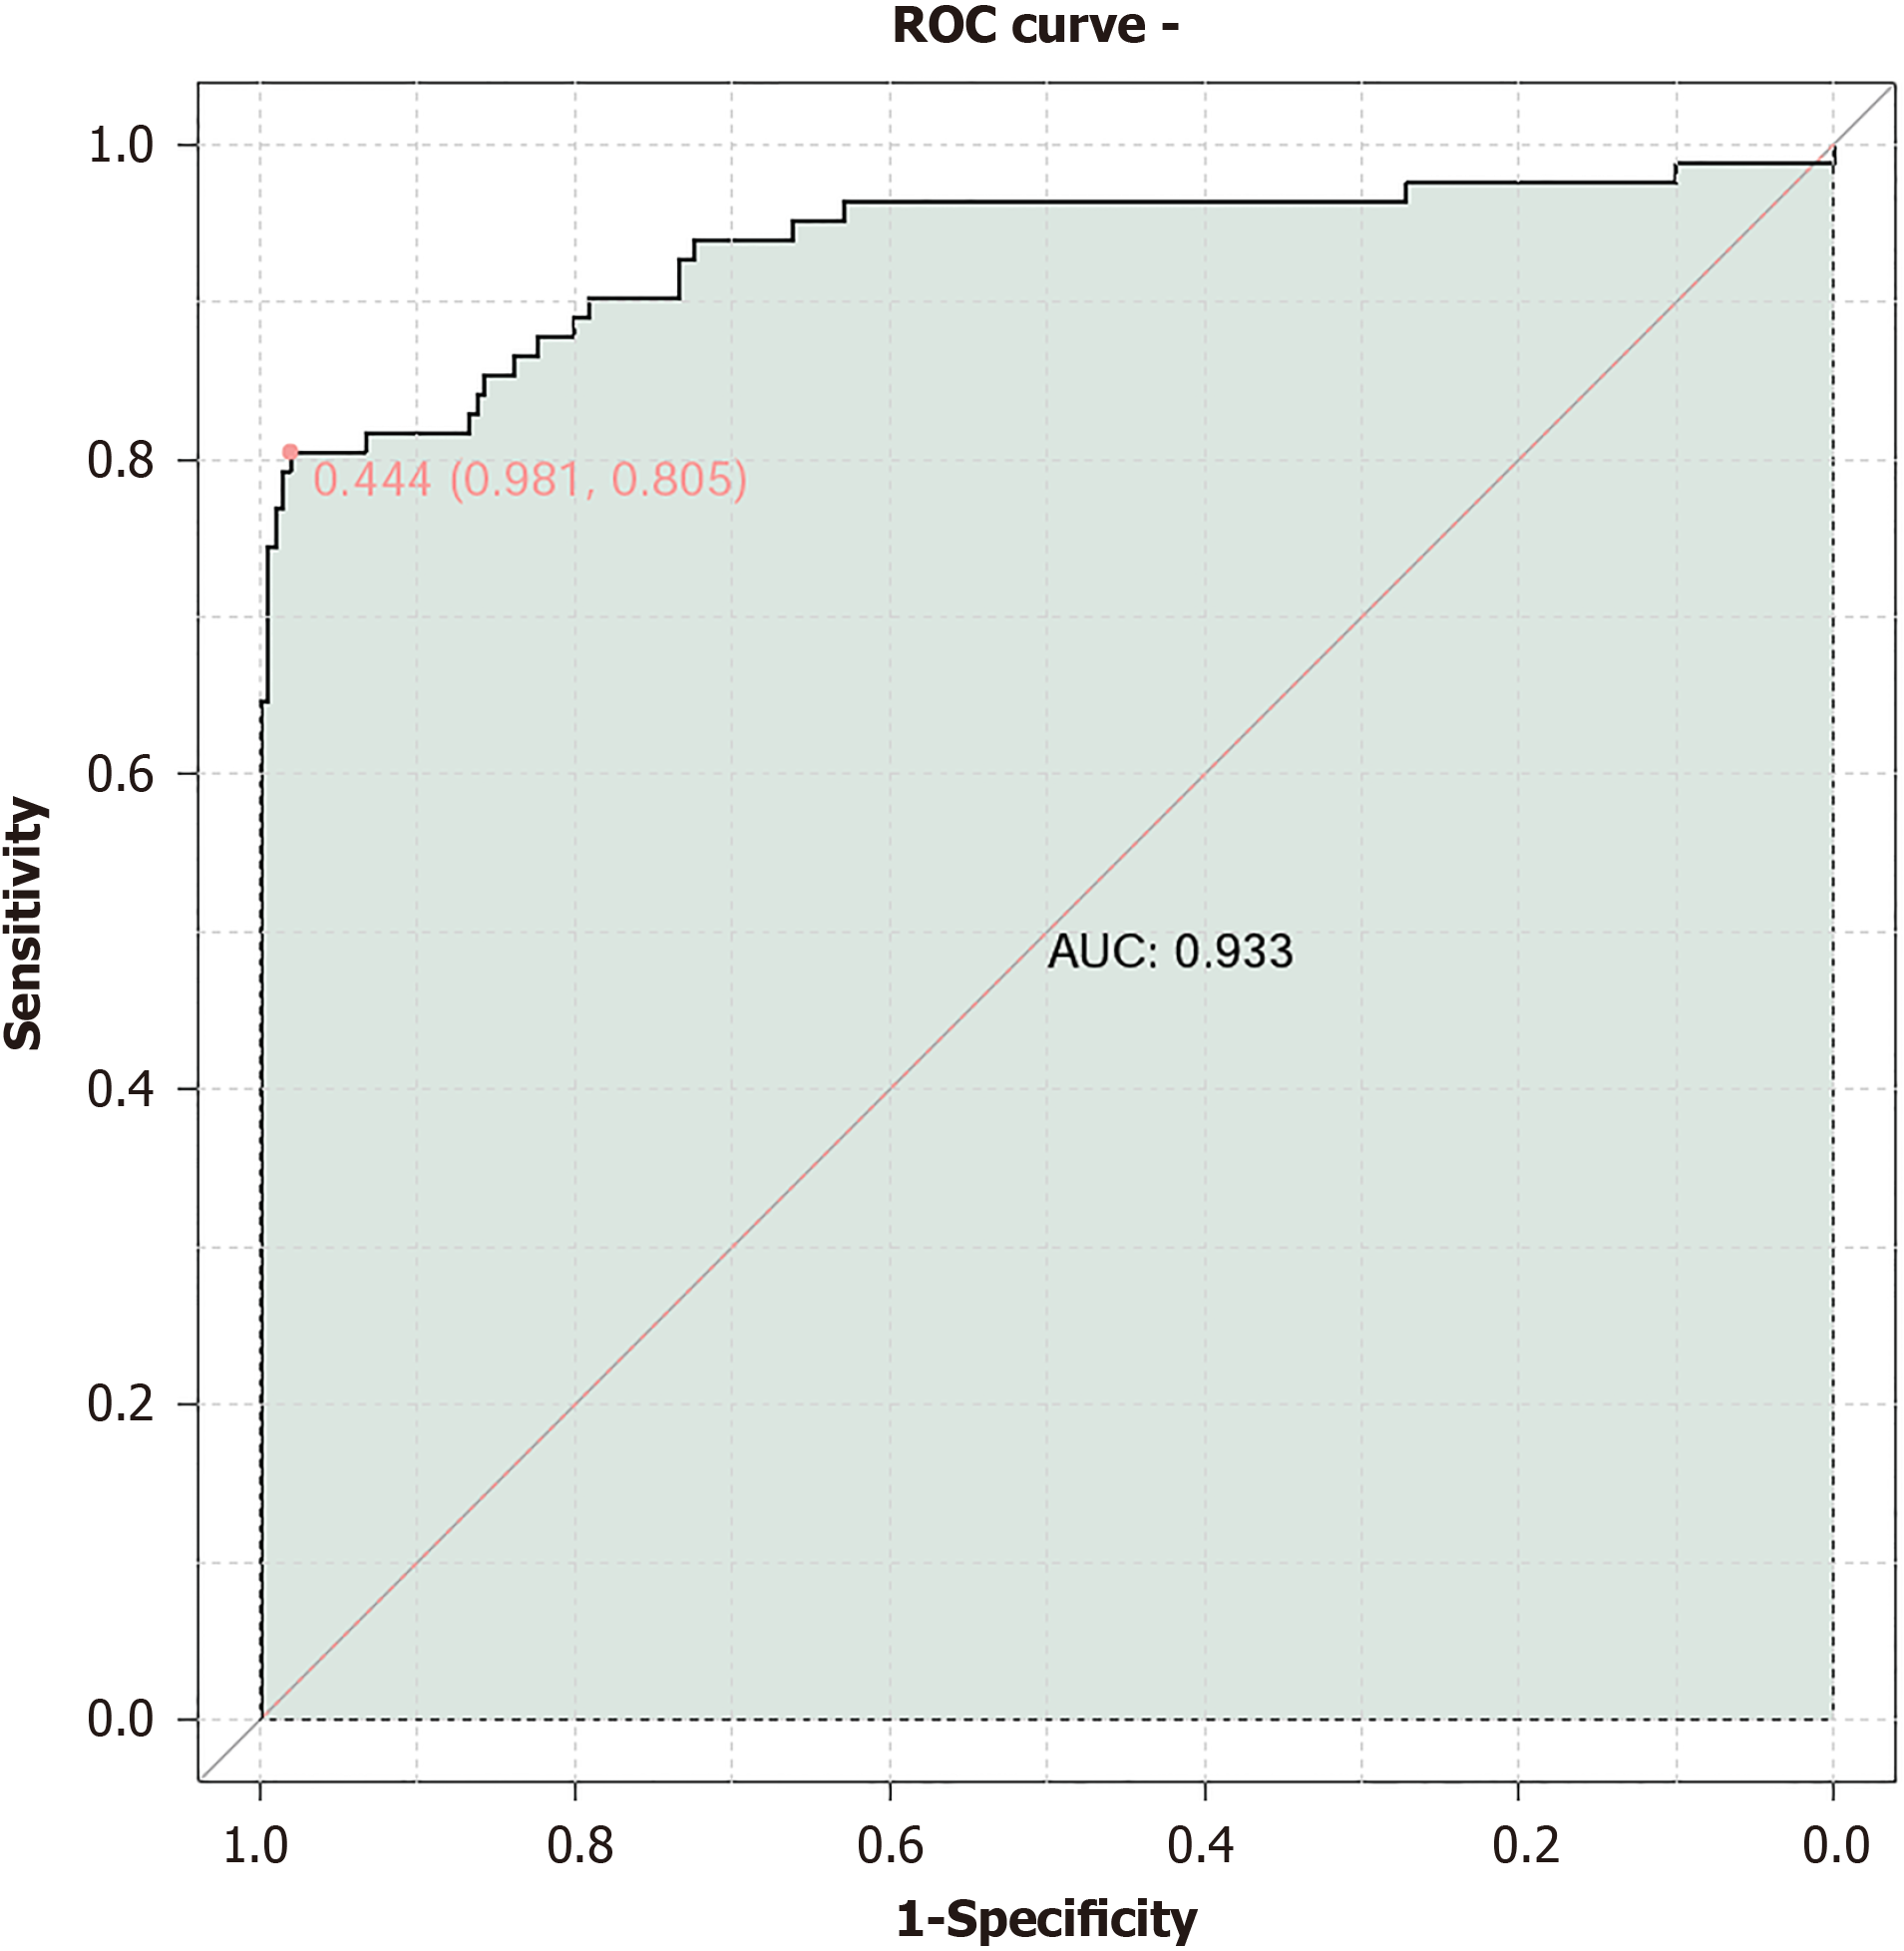
Figure 3 Analysis of the combined predictive model for plasma glucose, HbA1c, and medical delay.
ROC: Receiver operating characteristic; AUC: Area under the curve.
- Citation: Chen H, Xi Y. Delayed treatment of diabetic foot ulcer in patients with type 2 diabetes and its prediction model. World J Diabetes 2024; 15(10): 2070-2080
- URL: https://www.wjgnet.com/1948-9358/full/v15/i10/2070.htm
- DOI: https://dx.doi.org/10.4239/wjd.v15.i10.2070


