Copyright
©The Author(s) 2023.
World J Diabetes. Jun 15, 2023; 14(6): 862-882
Published online Jun 15, 2023. doi: 10.4239/wjd.v14.i6.862
Published online Jun 15, 2023. doi: 10.4239/wjd.v14.i6.862
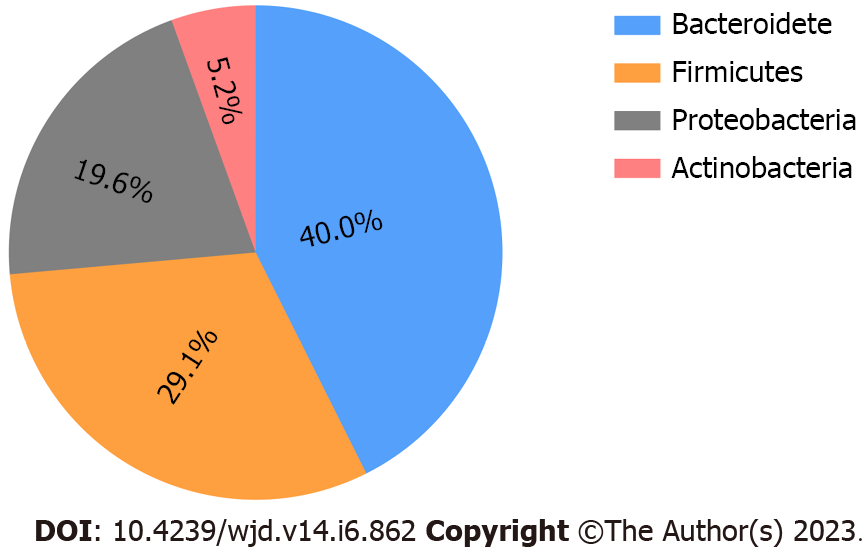
Figure 1 The pie shows average relative abundances of the most four dominated phyla.
Relative abundances are presented as percentage.
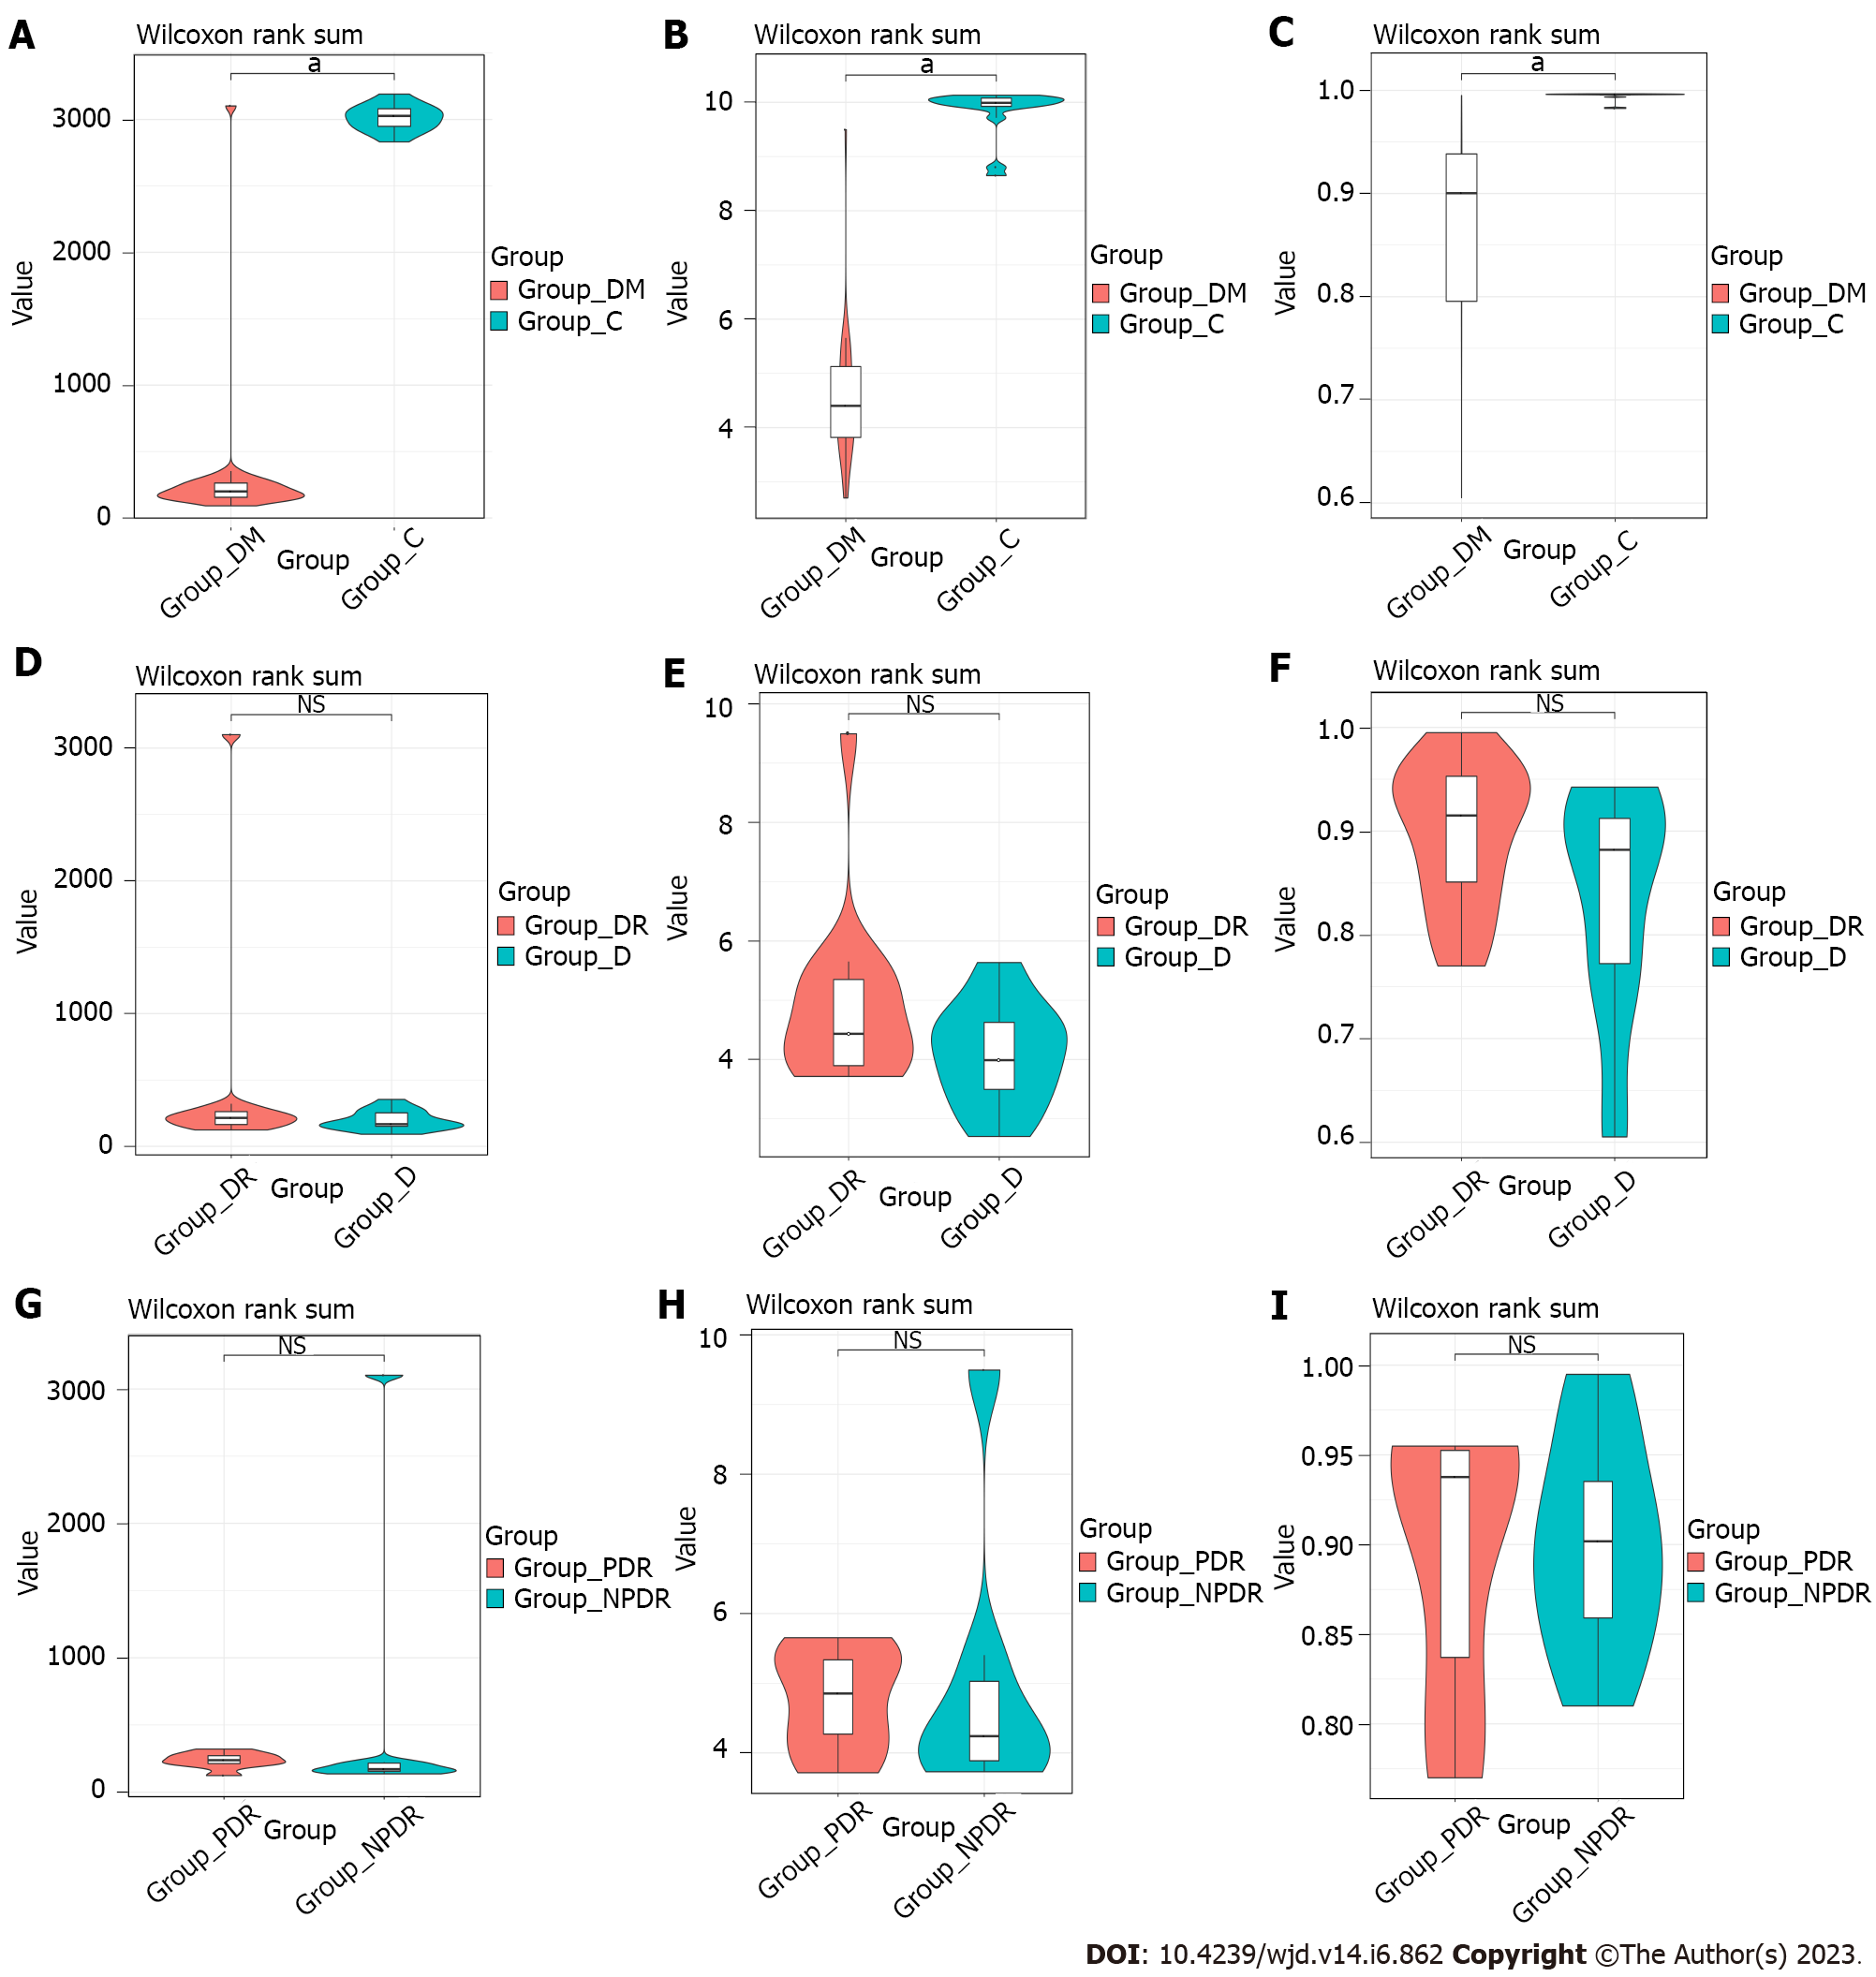
Figure 2 Alpha diversity analysis of microbiota in the six groups.
A: The Chao1 index between Group DM and Group C; B: The Shannon index between Group DM and Group C; C: The simpson index between Group DM and Group C; D: The Chao1 index between Group DR and Group D; E: The Shannon index between Group DR and Group D; F: The simpson index between Group DR and Group D; G: The Chao1 index between Group PDR and Group NPDR; H: The Shannon index between Group PDR and Group NPDR; I: The simpson index between Group PDR and Group NPDR. aP < 0.05. NS: Not significant. Group C: Samples with non-diabetics; Group DM: Samples with diabetics; Group DR: Samples with diabetic retinopathy; Group D: Samples without diabetic retinopathy; Group PDR: Patients with proliferative diabetic retinopathy; Group NPDR: Patients without proliferative diabetic retinopathy.
Figure 3 Beta diversity analysis of microbiota in the six groups.
A and B: Weighted and unweighted PCoA between between Group DM and Group C; C and D: Weighted and unweighted PCoA between between Group DR and Group D; E and F: Weighted and unweighted PCoA between between Group PDR and Group NPDR. Differences were assessed by Adonis. Group C: Samples with non-diabetics; Group DM: Samples with diabetics; Group DR: Samples with diabetic retinopathy; Group D: Samples without diabetic retinopathy; Group PDR: Patients with proliferative diabetic retinopathy; Group NPDR: Patients without proliferative diabetic retinopathy.
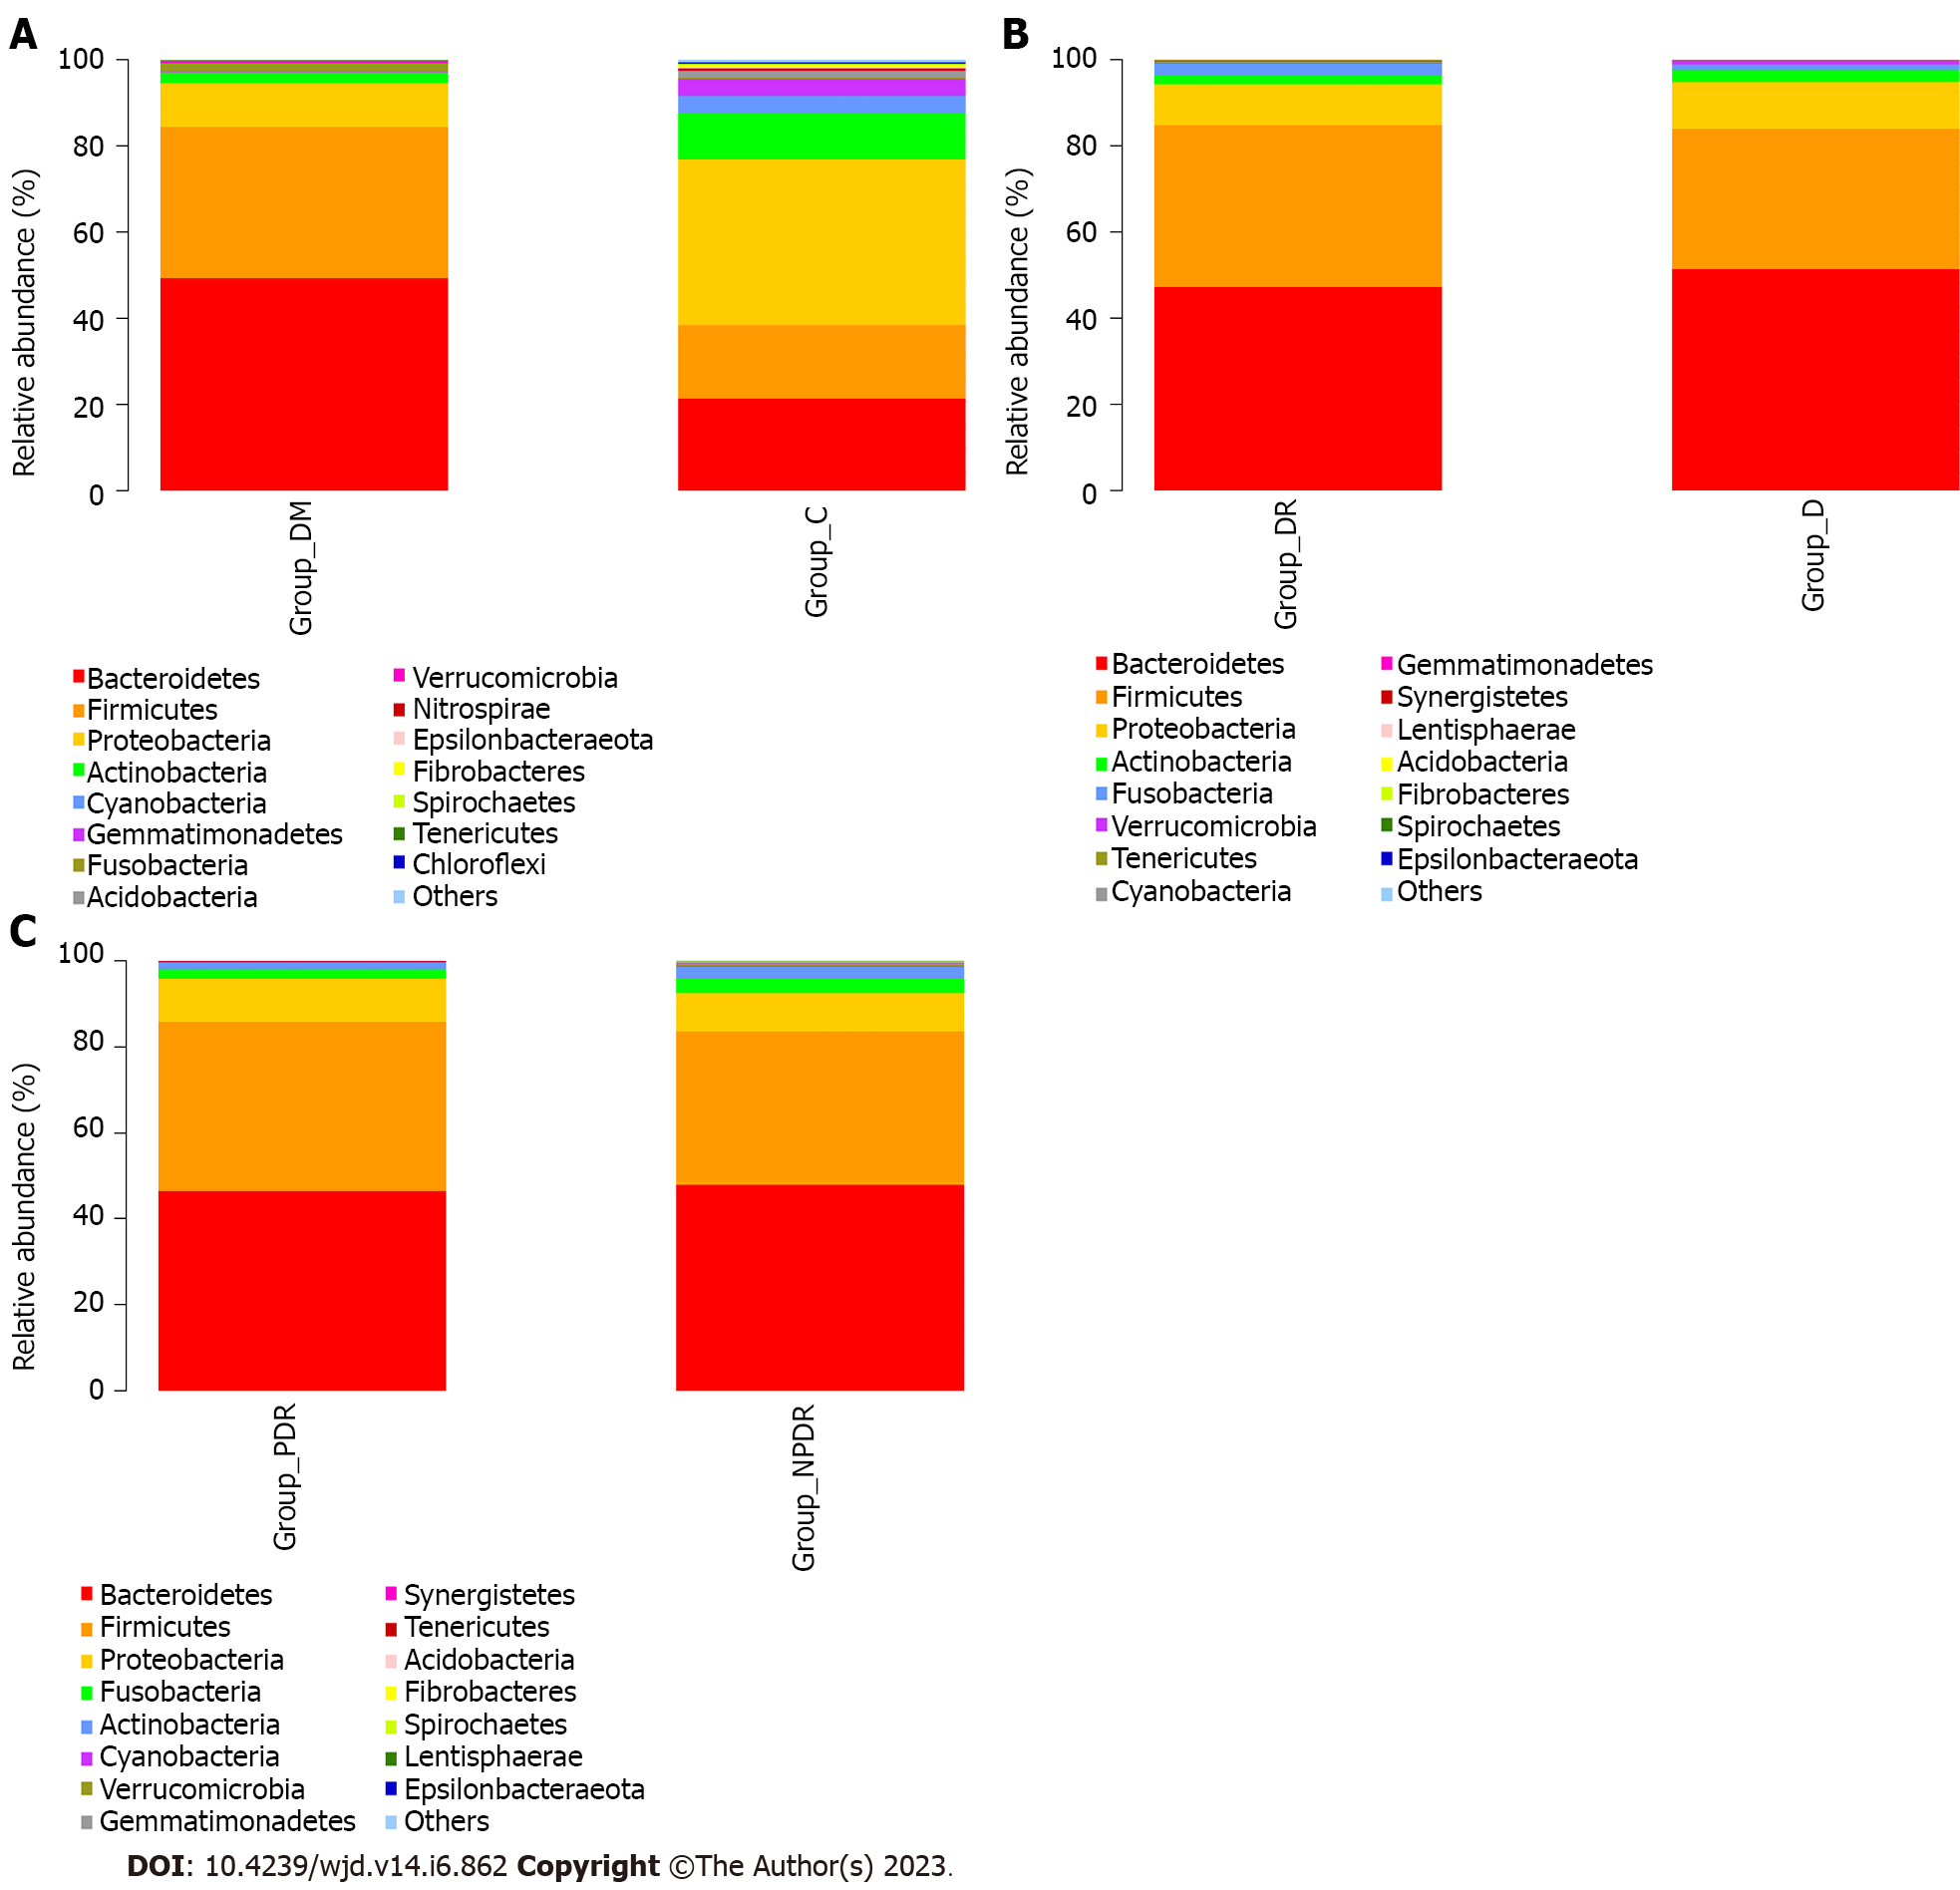
Figure 4 The composition at phylum level in the six groups.
A: The composition at phylum level in Group DM and Group C. The abundance of Firmicutes, Bacteroidetes, Proteobacteria and Actinobacteria varied between the two groups; B: The composition at phylum level in Group DR and Group D. The relative mean abundance of phylum Bacteroidetes and Firmicutes between Group D and Group DR were similar (P = 0.33, P = 0.37); C: The composition at phylum level in Group PDR and Group NPDR. The relative mean abundance of phylum Bacteroidetes, Firmicutes and showed a similarity between Group PDR and NPDR (P = 0.71, P = 0.33). Group C: Samples with non-diabetics; Group DM: Samples with diabetics; Group DR: Samples with diabetic retinopathy; Group D: Samples without diabetic retinopathy; Group PDR: Patients with proliferative diabetic retinopathy; Group NPDR: Patients without proliferative diabetic retinopathy.
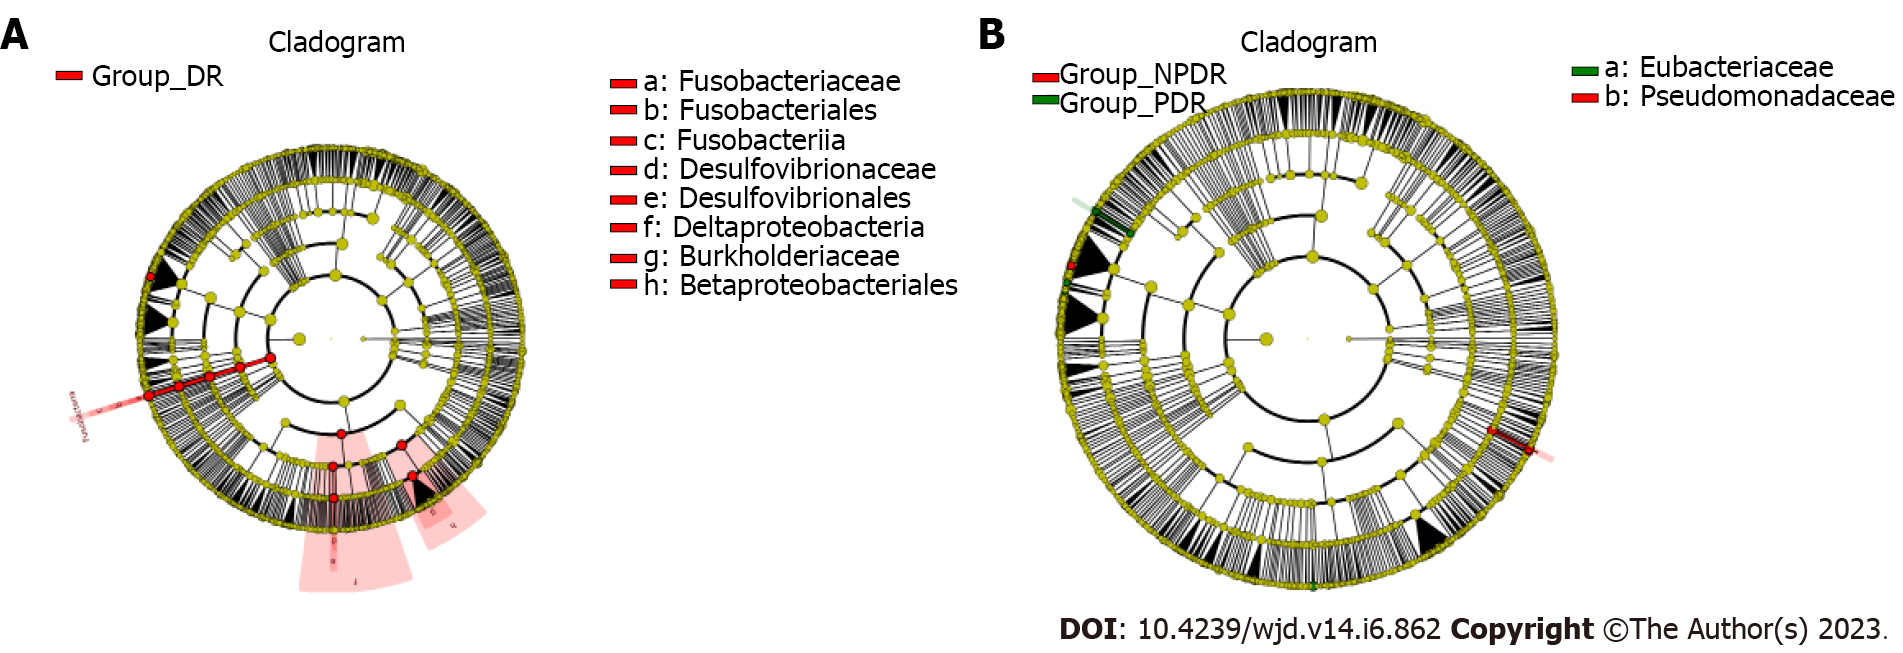
Figure 5 Results of linear discriminant analysis effect size in the six groups.
Wilcoxon signed rank test was used for statistical analyzing. The threshold of linear discriminant analysis score was set to 2.0. A and B: Red nodes designated microorganism that only been detected in Group DR. The regions marked with yellow indicated no significant difference between Group DR and Group D as well as Group PDR and NPDR. Group DR: Samples with diabetic retinopathy; Group D: Samples without diabetic retinopathy; Group PDR: Patients with proliferative diabetic retinopathy; Group NPDR: Patients without proliferative diabetic retinopathy.
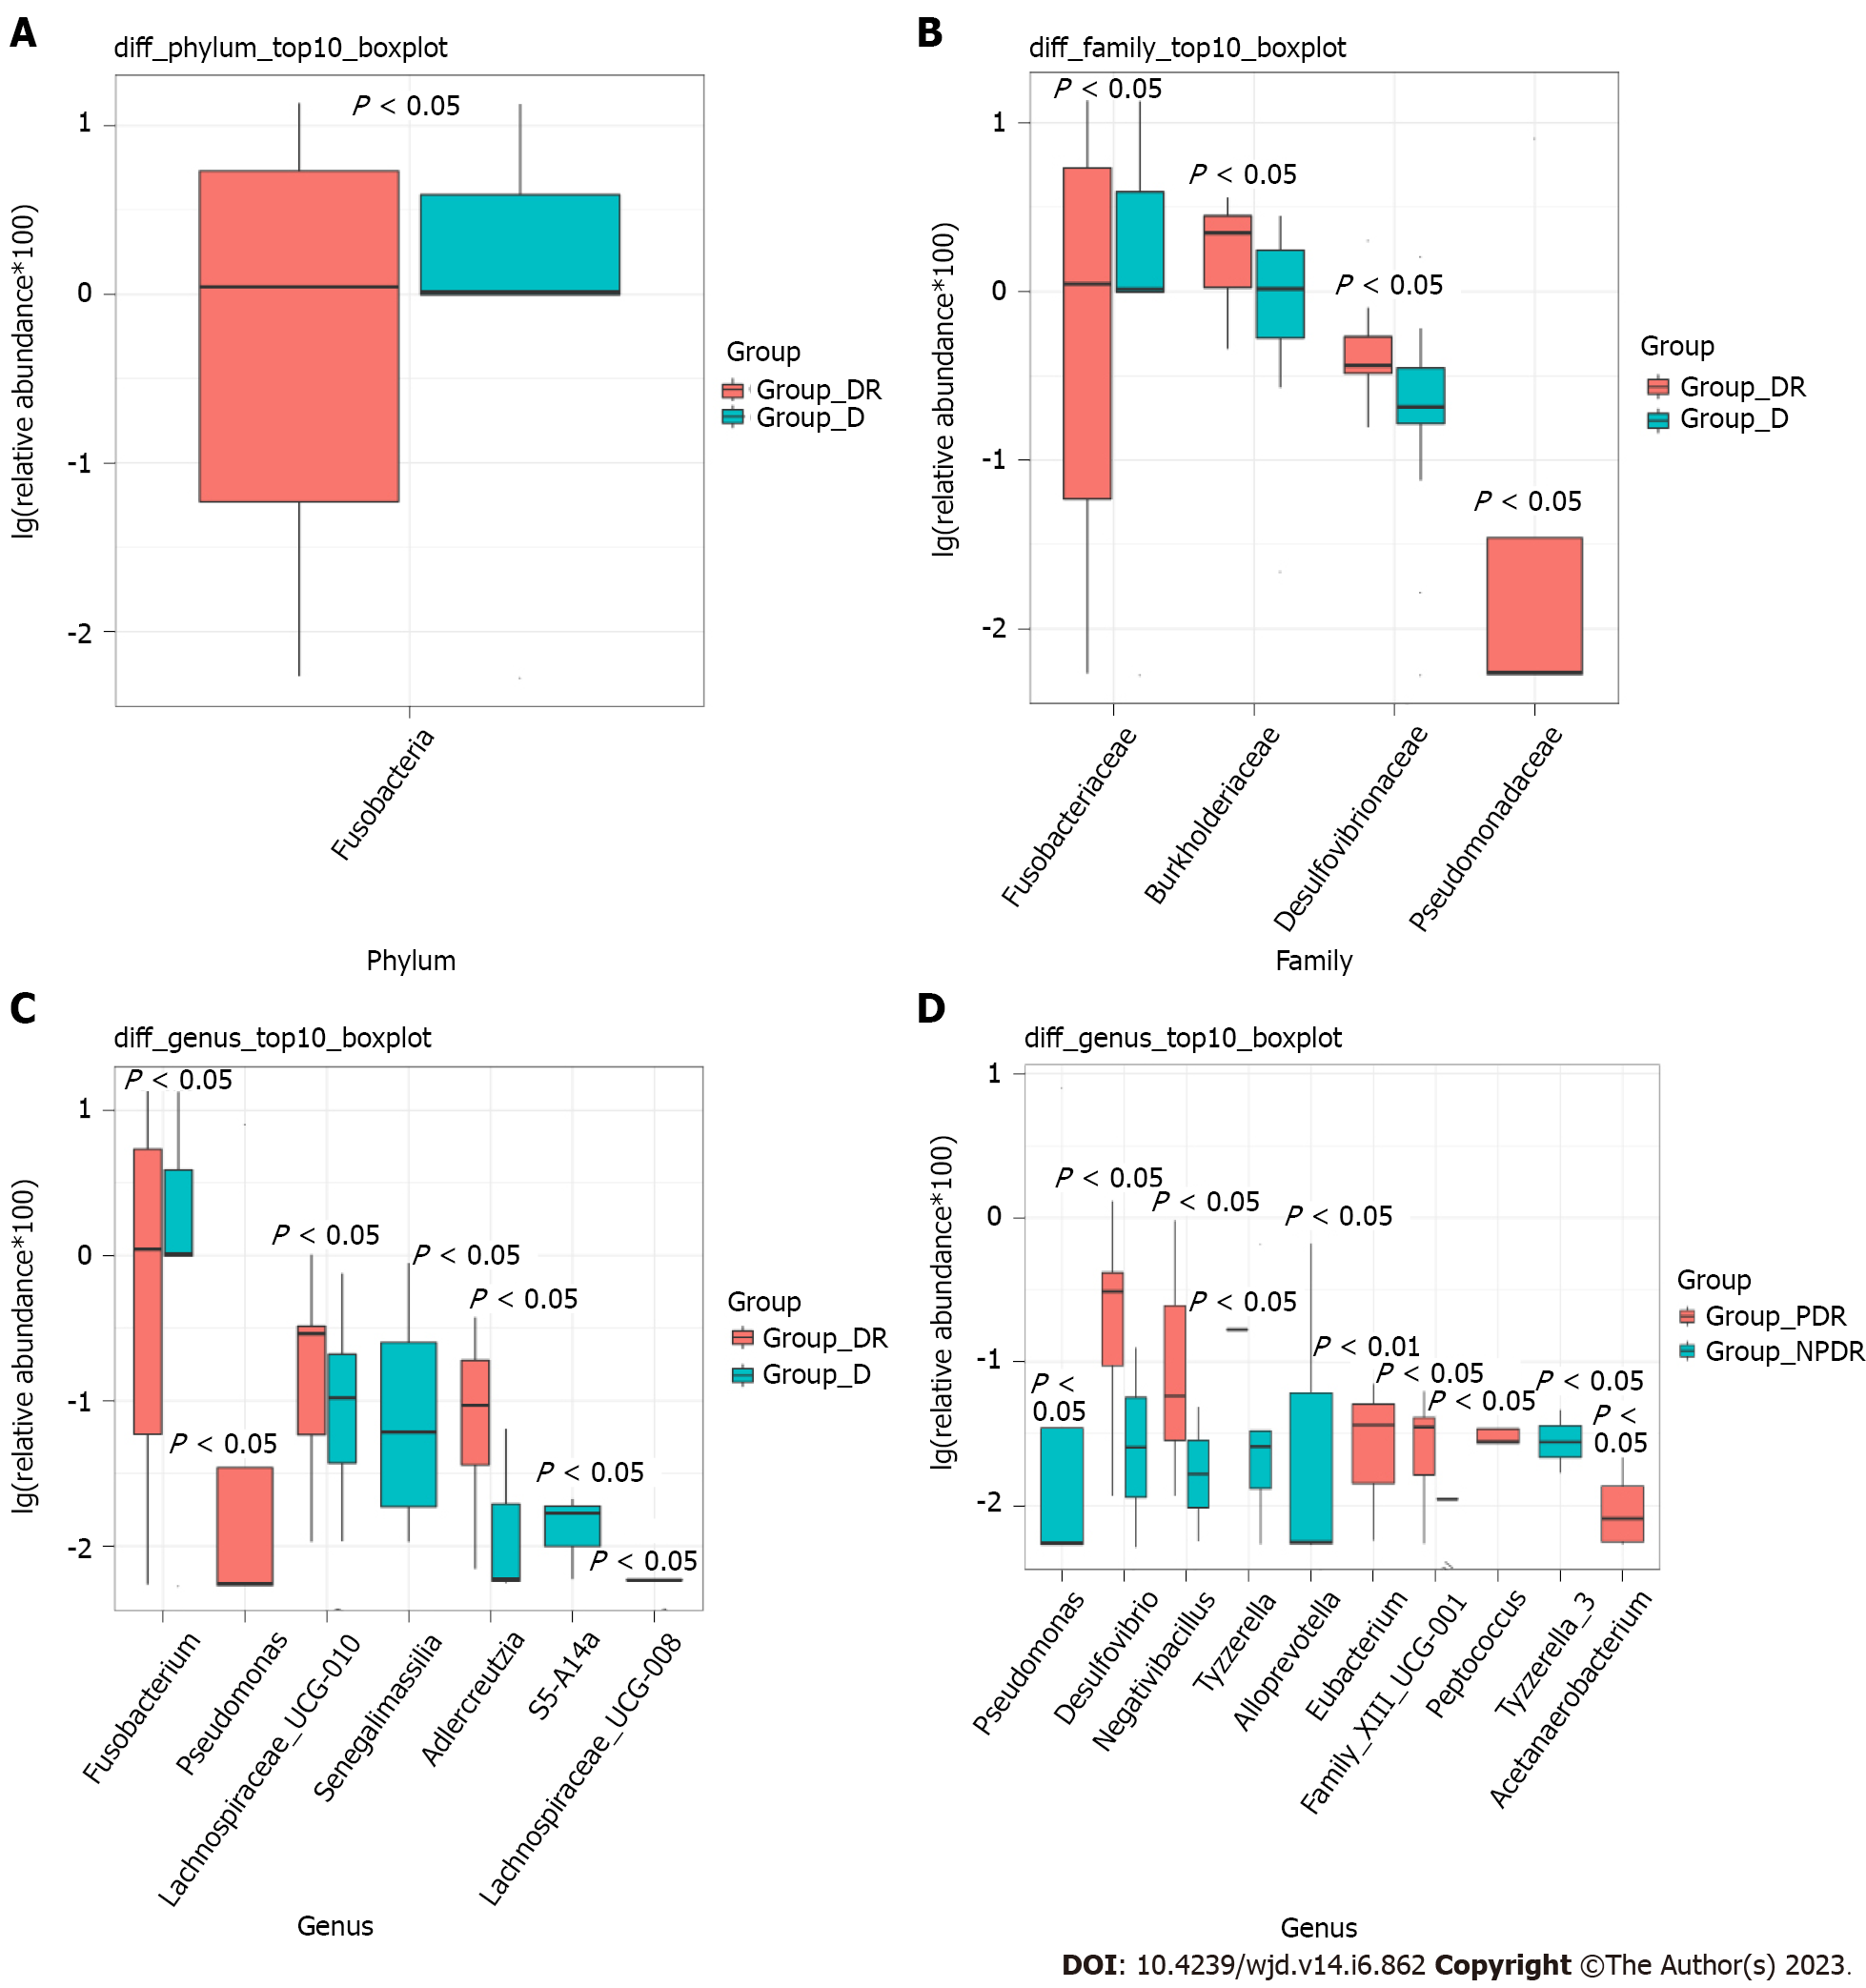
Figure 6 Relative abundance of microbiota displayed by Box and whiskers plots.
A-C: Box and whiskers plots display relative abundance of microbiota in different level between Group DR and Group D; D: Box and whiskers plots display relative abundance of genera between Group PDR and NPDR. Group DR: Samples with diabetic retinopathy; Group D: Samples without diabetic retinopathy; Group PDR: Patients with proliferative diabetic retinopathy; Group NPDR: Patients without proliferative diabetic retinopathy.
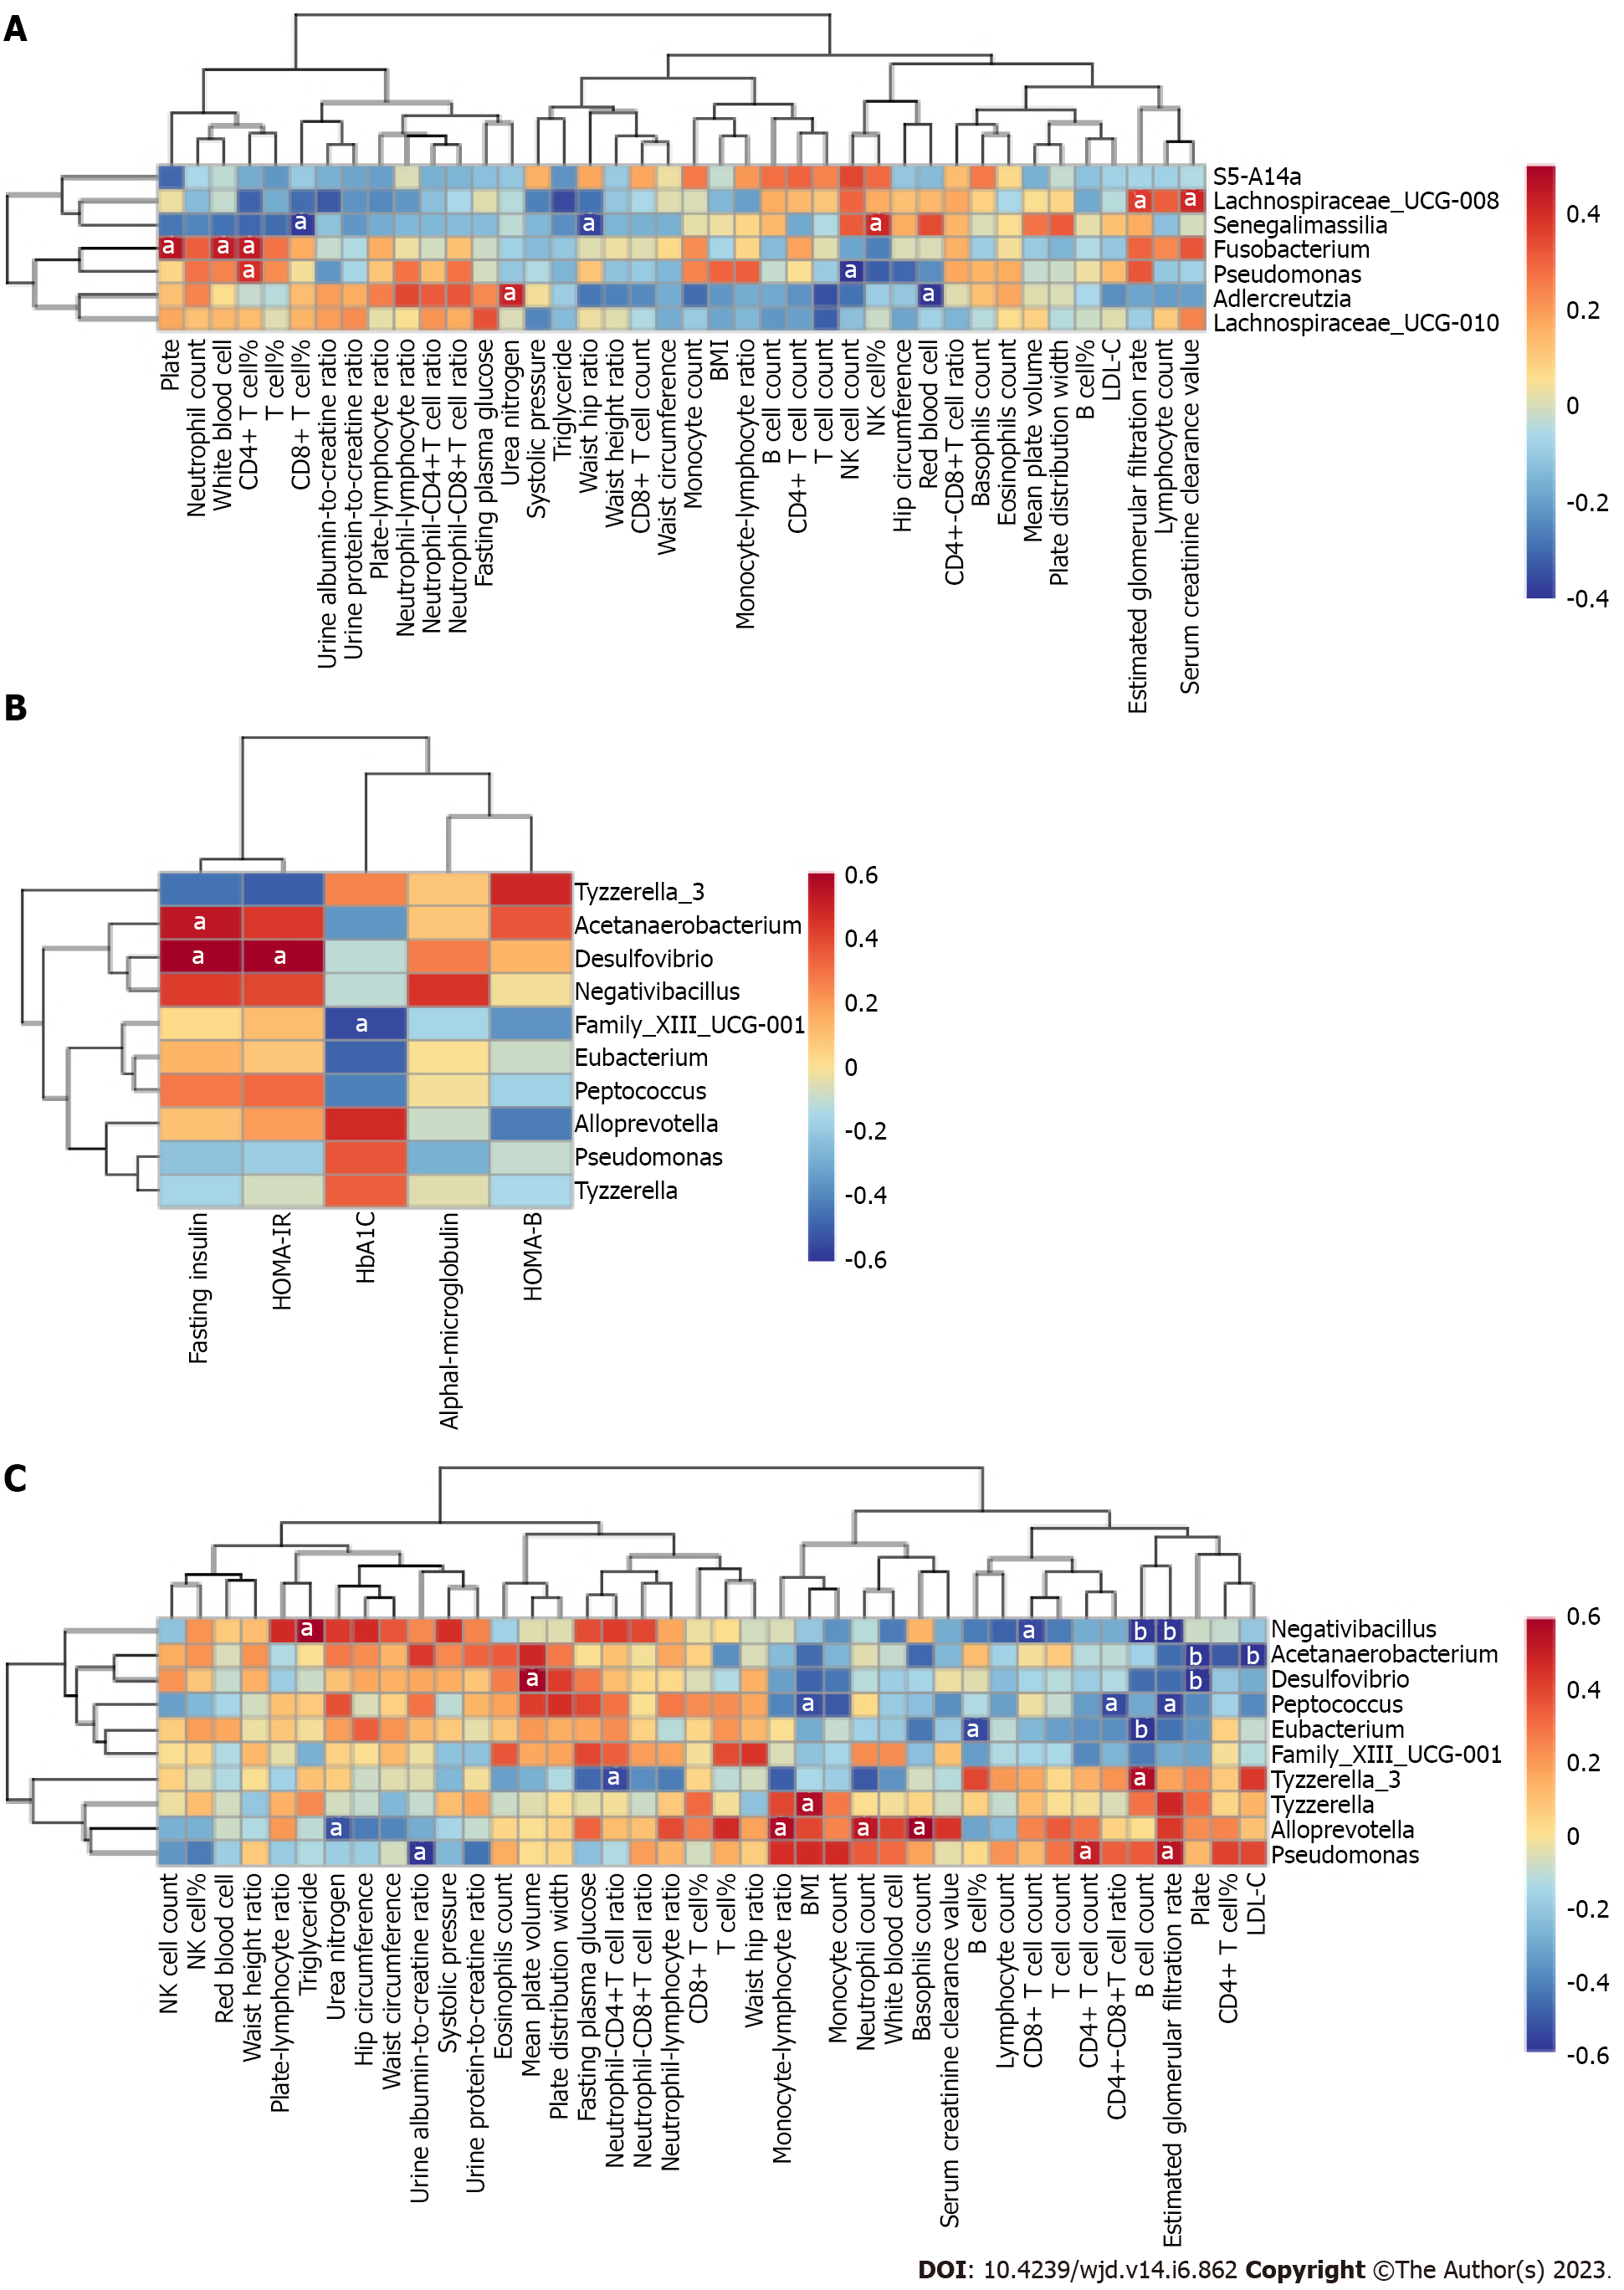
Figure 7 Correlation heatmap between gut microbiota and clinical indices.
A: Correlation heatmap between gut microbiota and clinical indices in Group DM (Group DR vs Group D); B and C: Correlation heatmap between gut microbiota and clinical indices in Group DR (Group PDR vs Group NPDR). Different colors represent correlation level. Different colors represent correlation level (blue represents for negative correlation, red represents for positive correlation). aP < 0.05; bP < 0.01. Group C: Samples with non-diabetics; Group DM: Samples with diabetics; Group DR: Samples with diabetic retinopathy; Group D: Samples without diabetic retinopathy; Group PDR: Patients with proliferative diabetic retinopathy; Group NPDR: Patients without proliferative diabetic retinopathy.
- Citation: Gu XM, Lu CY, Pan J, Ye JZ, Zhu QH. Alteration of intestinal microbiota is associated with diabetic retinopathy and its severity: Samples collected from southeast coast Chinese. World J Diabetes 2023; 14(6): 862-882
- URL: https://www.wjgnet.com/1948-9358/full/v14/i6/862.htm
- DOI: https://dx.doi.org/10.4239/wjd.v14.i6.862


