Copyright
©The Author(s) 2023.
World J Diabetes. Oct 15, 2023; 14(10): 1514-1523
Published online Oct 15, 2023. doi: 10.4239/wjd.v14.i10.1514
Published online Oct 15, 2023. doi: 10.4239/wjd.v14.i10.1514
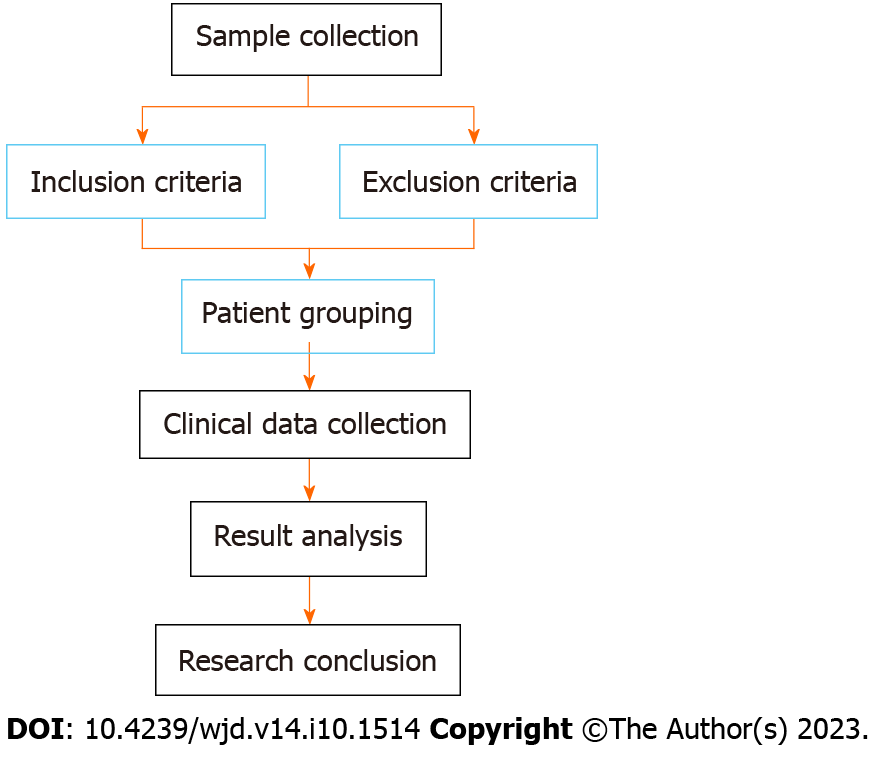
Figure 1 Flowchart.
Figure 2 Comparison of glucose metabolism indexes between patients with or without insulin resistance.
A: Comparison of 2 h postprandial blood glucose; B: Comparison of fasting blood glucose; C: Comparison of glycosylated hemoglobin. 2hPG: 2 h postprandial blood glucose; FBG: Fasting blood glucose; HbA1c: Glycosylated hemoglobin. dP < 0.0001.
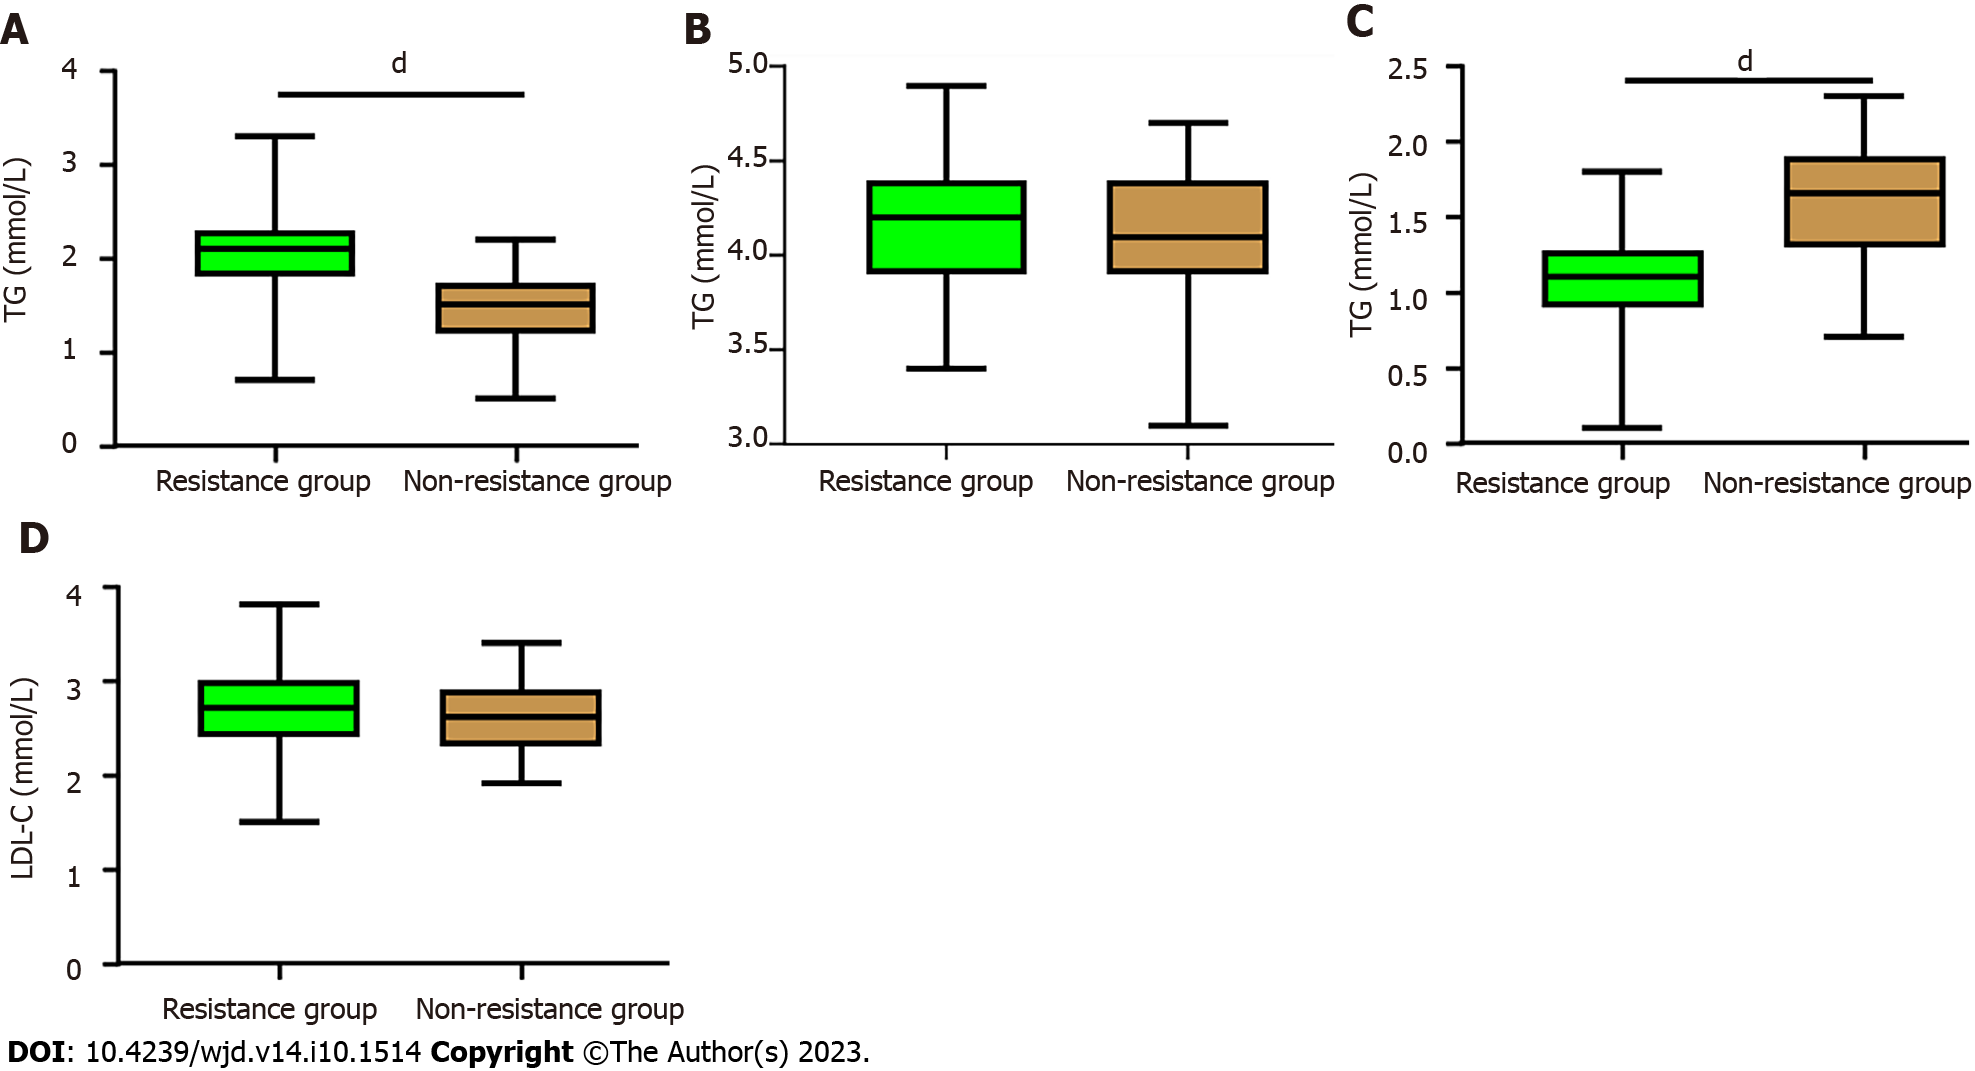
Figure 3 Comparison of lipid metabolism indexes between patients with or without insulin resistance.
A: Comparison of triglyceride; B: Comparison of total cholesterol; C: Comparison of high-density lipoprotein-cholesterol; D: Comparison of low-density lipoprotein-cholesterol. TG: Triglyceride; TC: Total cholesterol; HDL-C: High-density lipoprotein-cholesterol; LDL-C: Low-density lipoprotein-cholesterol. dP < 0.0001.
Figure 4 Changes of glucose metabolism indexes in type 2 diabetes mellitus patients with insulin resistance before and after the treatment.
A: Comparison of 2-h postprandial blood glucose between the joint group and the conventional group; B: Comparison of fasting blood glucose between the joint group and the conventional group; C: Comparison of glycosylated hemoglobin between the joint group and the conventional group. 2hPG: 2-h postprandial blood glucose; FBG: Fasting blood glucose; HbA1c: Glycosylated hemoglobin. aP < 0.05, bP < 0.01, dP < 0.0001.
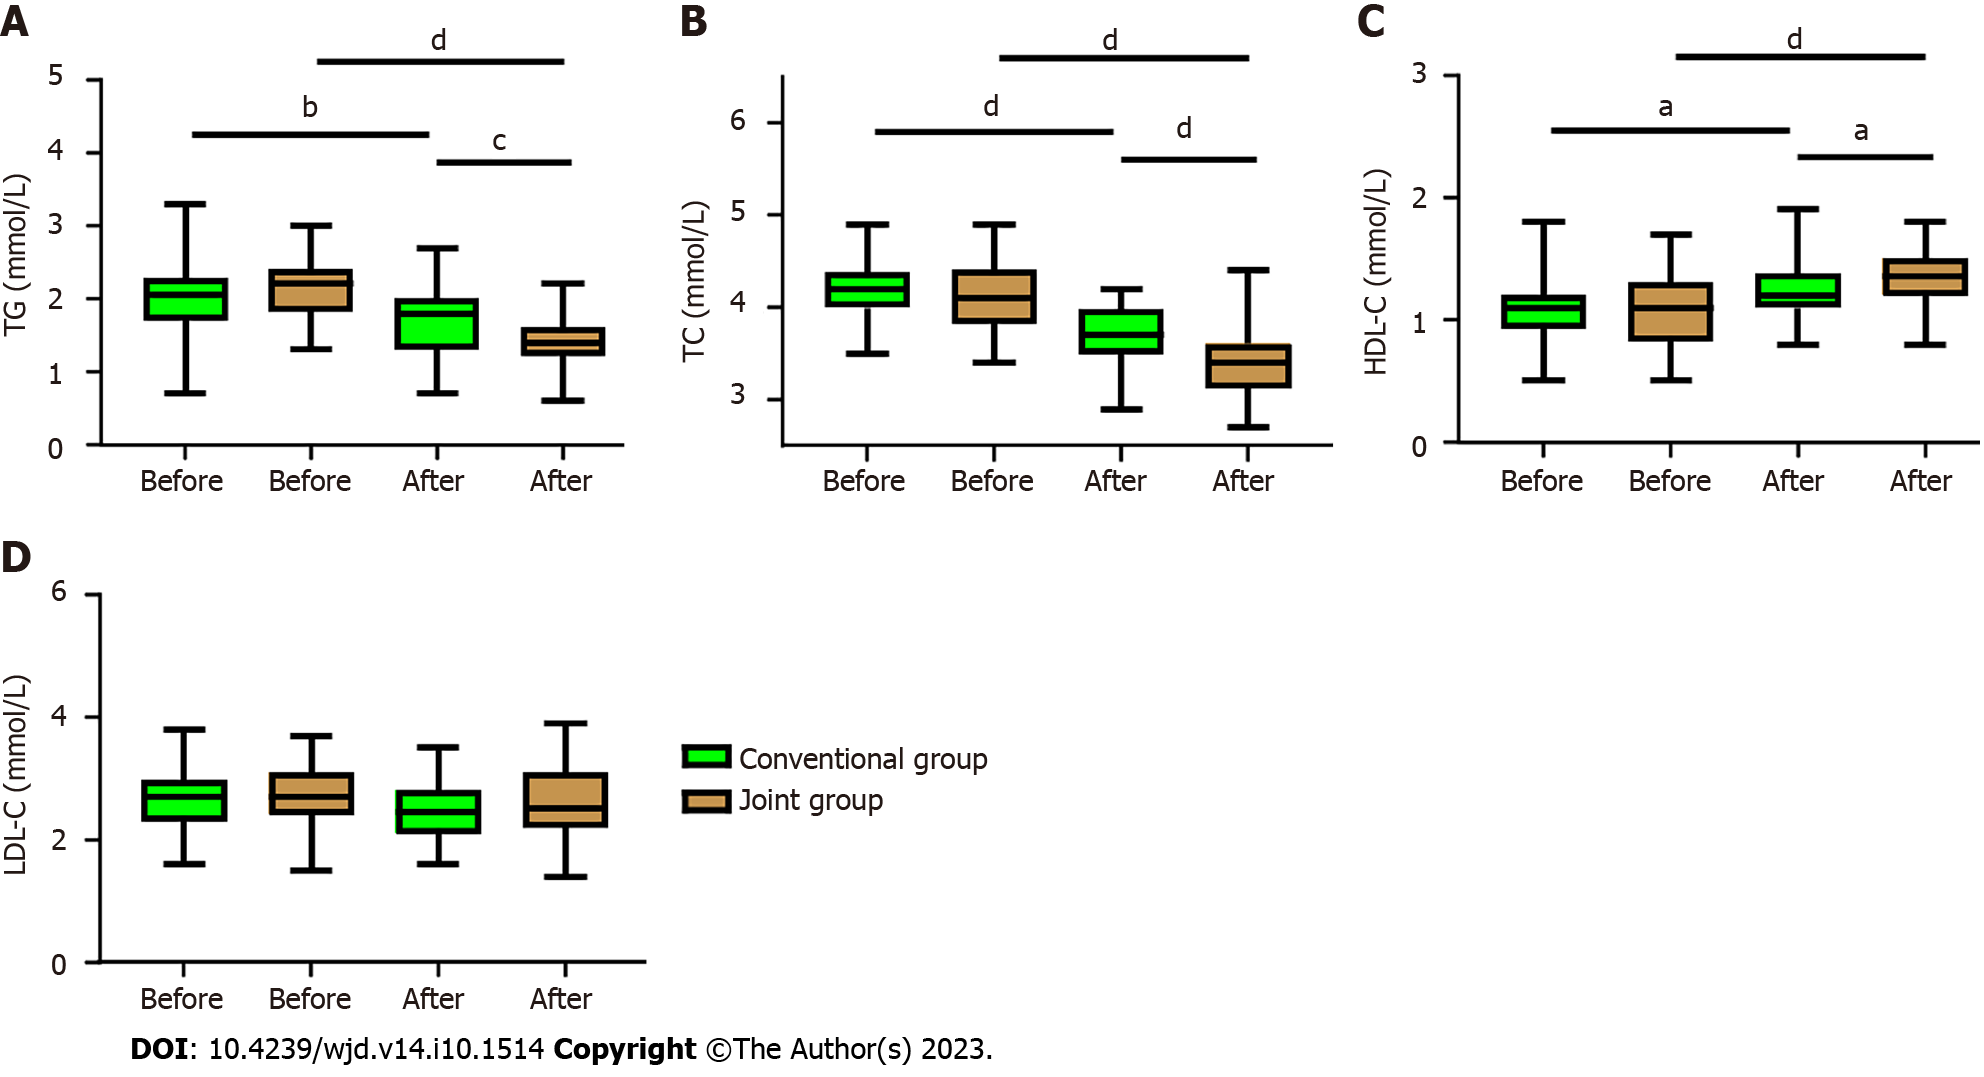
Figure 5 Comparison of lipid metabolism index in type 2 diabetes mellitus patients with insulin resistance before and after the treatment.
A: Comparison of triglyceride between the joint group and the conventional group; B: Comparison of total cholesterol between the joint group and the conventional group; C: Comparison of high-density lipoprotein-cholesterol between the joint group and the conventional group; D: Comparison of low-density lipoprotein-cholesterol between the joint group and the conventional group. TG: Triglyceride; TC: Total cholesterol; HDL-C: High-density lipoprotein-cholesterol; LDL-C: Low-density lipoprotein-cholesterol. aP < 0.05, bP < 0.01, cP < 0.001, dP < 0.0001.
- Citation: Sun LJ, Lu JX, Li XY, Zheng TS, Zhan XR. Effects of vitamin D supplementation on glucose and lipid metabolism in patients with type 2 diabetes mellitus and risk factors for insulin resistance. World J Diabetes 2023; 14(10): 1514-1523
- URL: https://www.wjgnet.com/1948-9358/full/v14/i10/1514.htm
- DOI: https://dx.doi.org/10.4239/wjd.v14.i10.1514


