Copyright
©The Author(s) 2021.
World J Diabetes. Feb 15, 2021; 12(2): 138-148
Published online Feb 15, 2021. doi: 10.4239/wjd.v12.i2.138
Published online Feb 15, 2021. doi: 10.4239/wjd.v12.i2.138
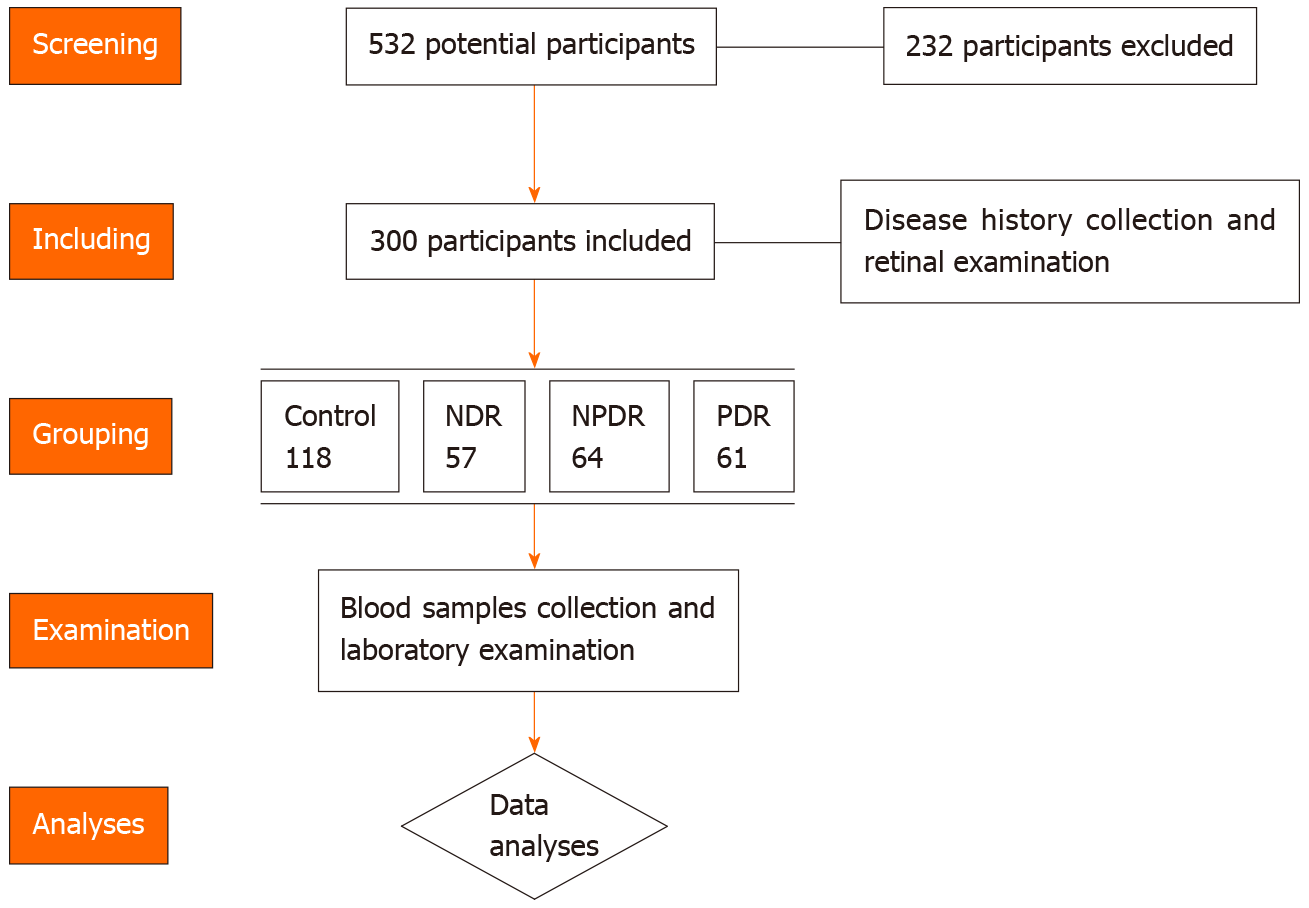
Figure 1 Flowchart demonstrates the number of patients enrolled, grouping, examination and analyses in the study.
NDR: Without diabetic retinopathy; NPDR: Non-proliferative diabetic retinopathy; PDR: Proliferative diabetic retinopathy.
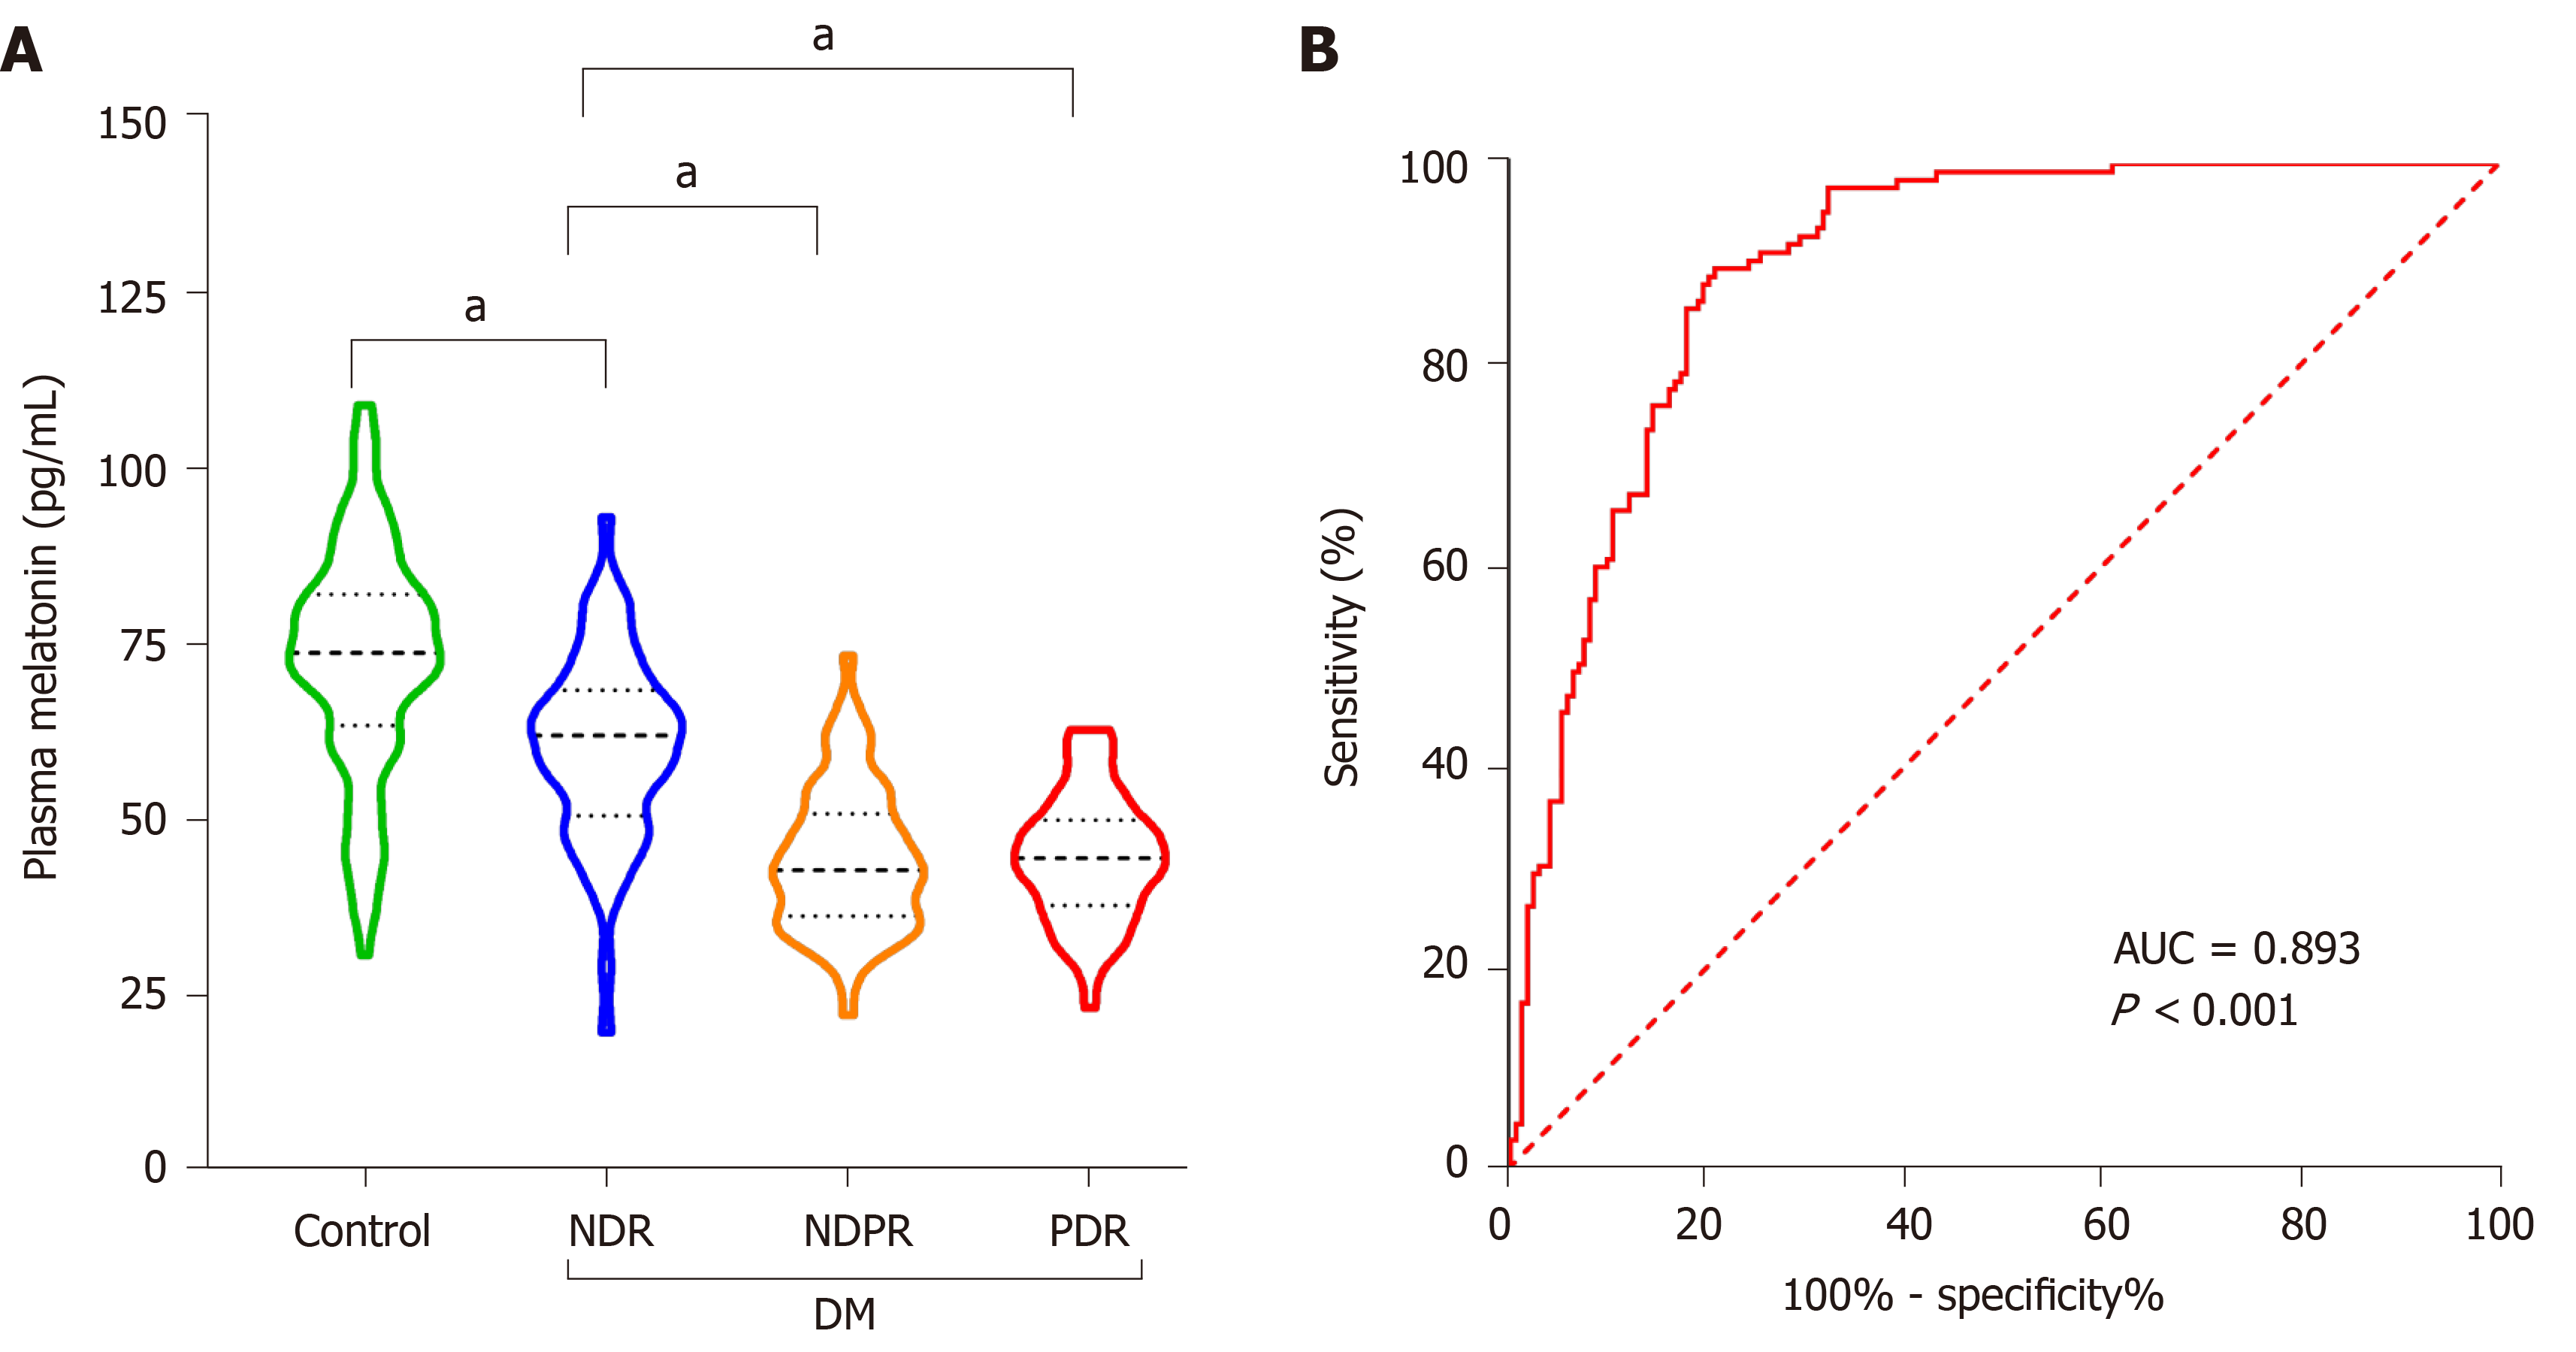
Figure 2 Plasma melatonin concentrations in healthy controls and diabetic retinopathy patients.
A: Plasma melatonin in the healthy controls, without diabetic retinopathy (NDR), non-proliferative diabetic retinopathy (NPDR) and proliferative diabetic retinopathy (PDR) groups; B: The diagnostic effect of plasma melatonin on diabetic retinopathy was discovered using the receiver operating characteristic curve. aP < 0.001. NDR: Without diabetic retinopathy; NPDR: Non-proliferative diabetic retinopathy; PDR: Proliferative diabetic retinopathy; DM: Diabetes mellitus; AUC: Area under the receiver operating characteristic curve.
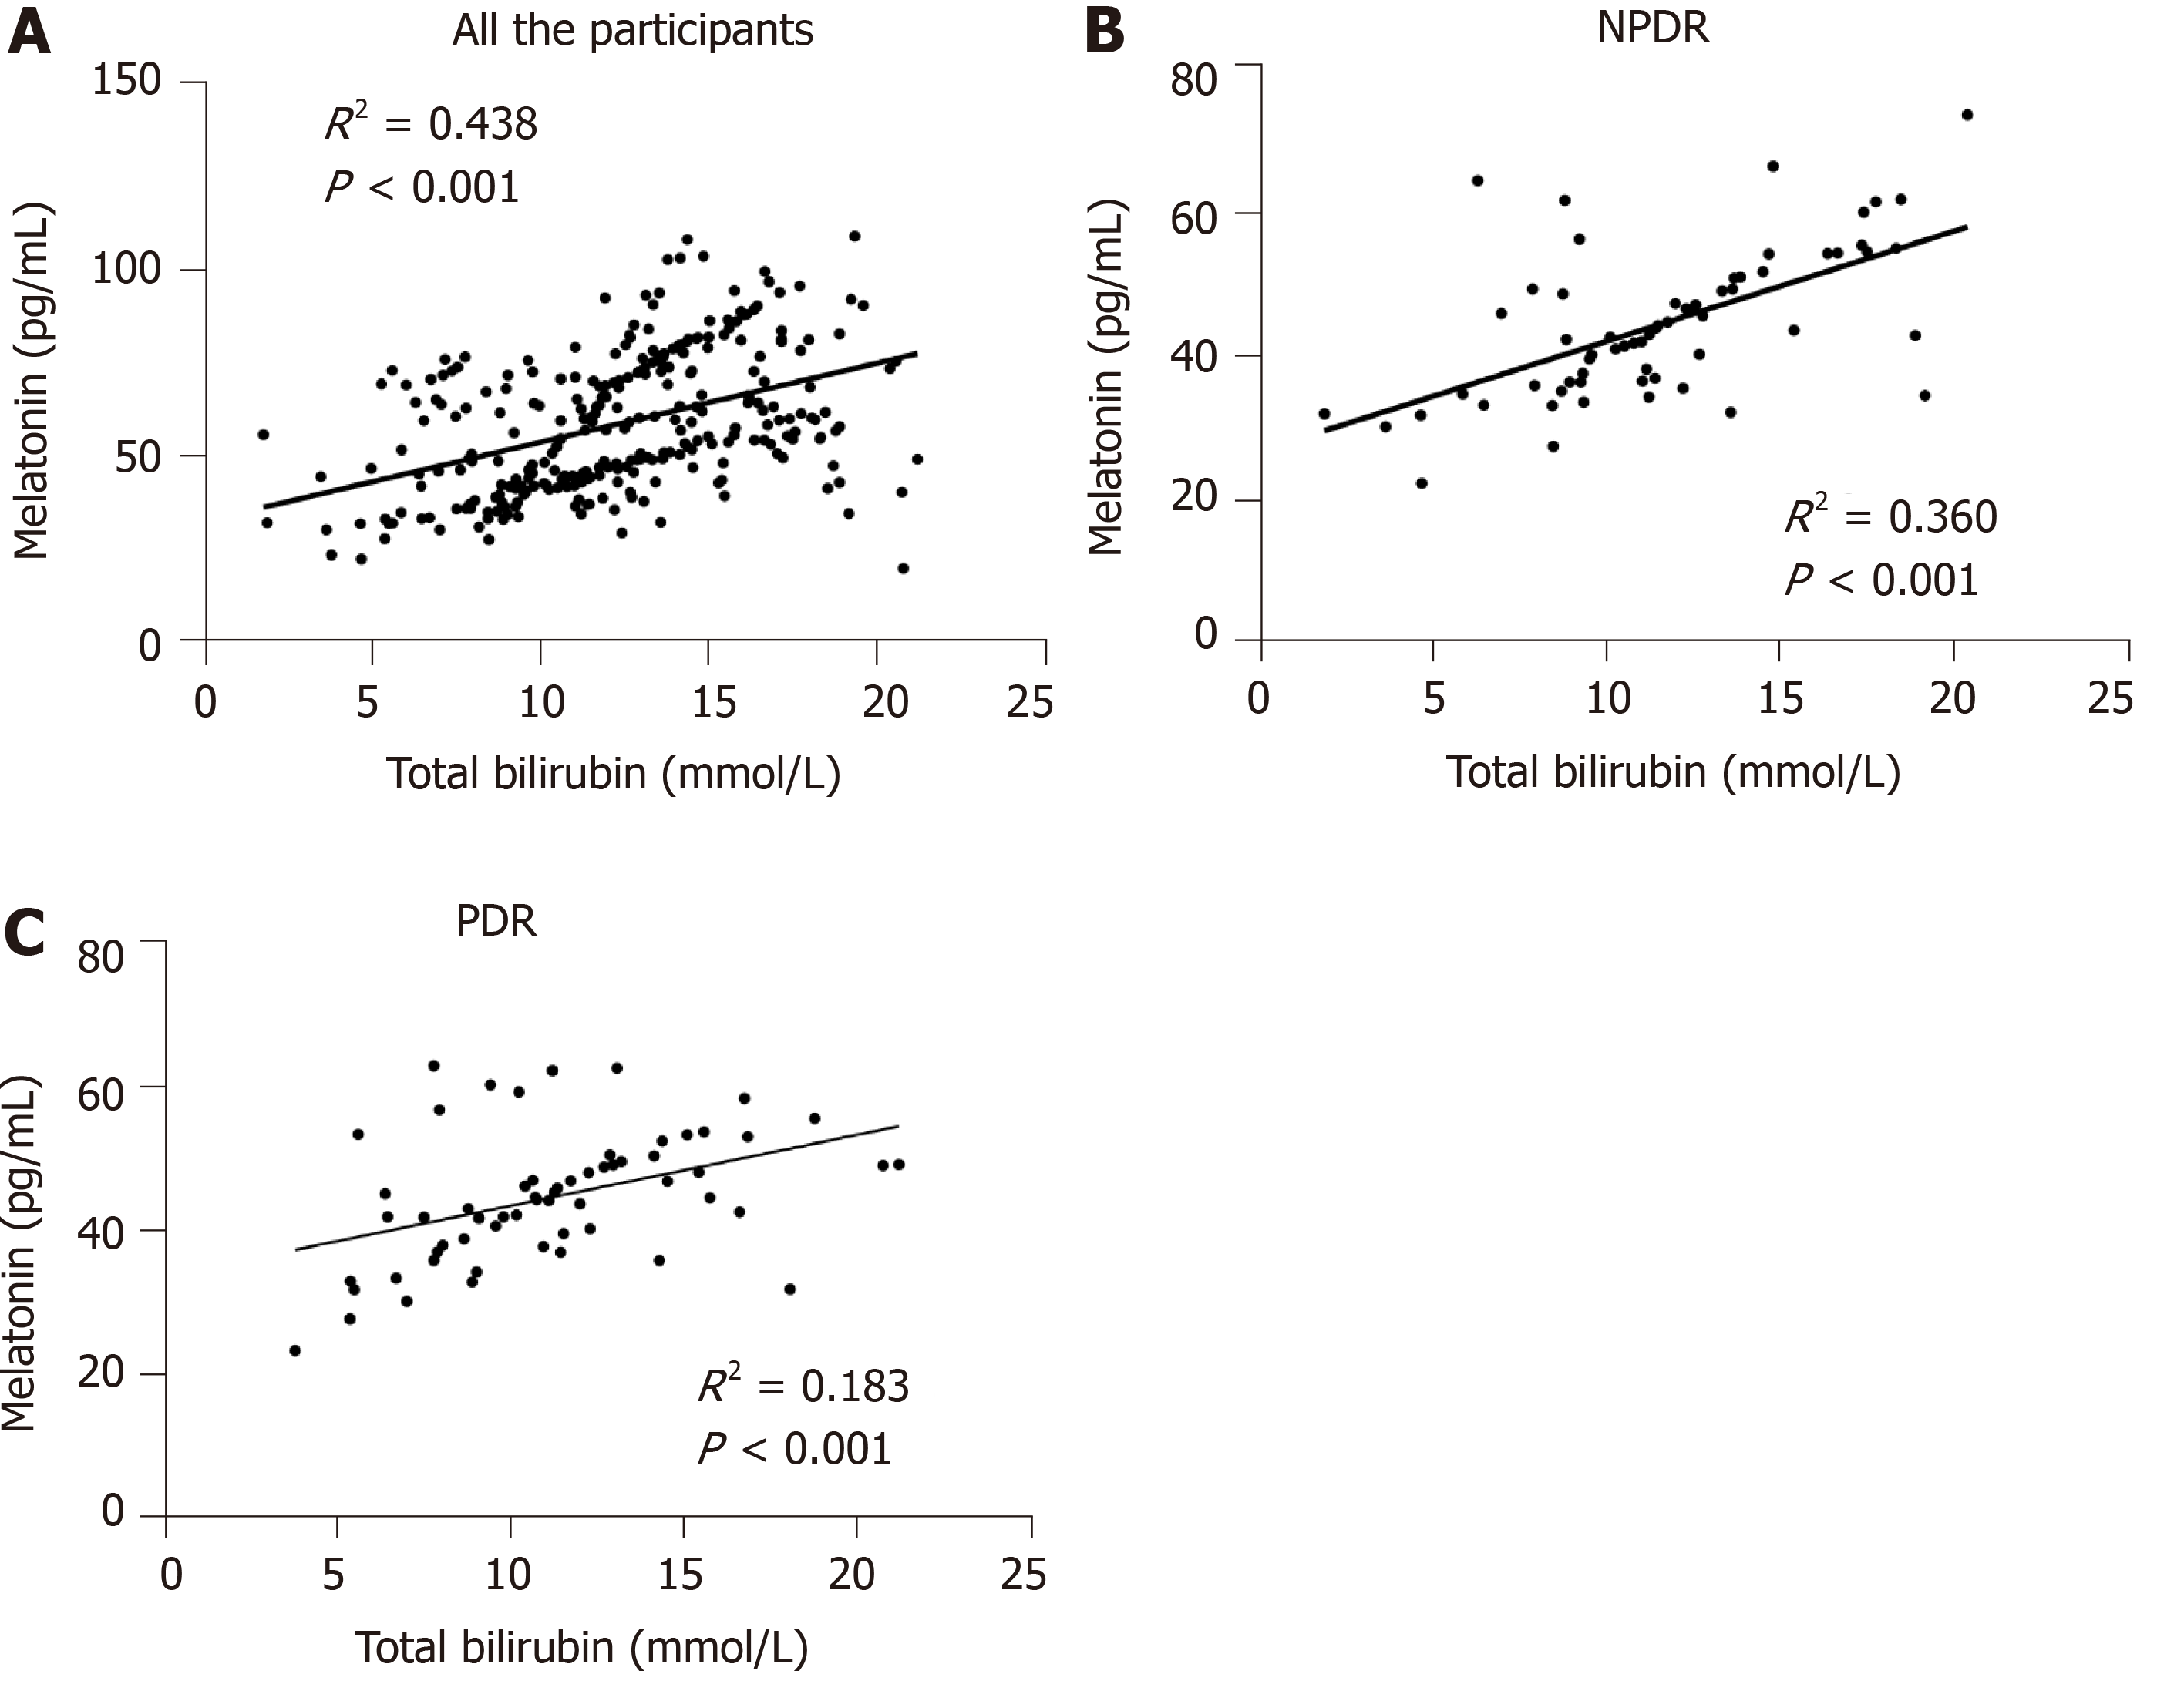
Figure 3 Linear relationship between total bilirubin and melatonin concentration in the different groups.
A: The linear relationship in all the participants; B: The linear relationship in the non-proliferative diabetic retinopathy (NPDR) group; C: The linear relationship in the proliferative diabetic retinopathy (PDR) group. NPDR: Non-proliferative diabetic retinopathy; PDR: Proliferative diabetic retinopathy.
- Citation: Wan WC, Long Y, Wan WW, Liu HZ, Zhang HH, Zhu W. Plasma melatonin levels in patients with diabetic retinopathy secondary to type 2 diabetes. World J Diabetes 2021; 12(2): 138-148
- URL: https://www.wjgnet.com/1948-9358/full/v12/i2/138.htm
- DOI: https://dx.doi.org/10.4239/wjd.v12.i2.138


