Copyright
©The Author(s) 2020.
World J Diabetes. Nov 15, 2020; 11(11): 501-513
Published online Nov 15, 2020. doi: 10.4239/wjd.v11.i11.501
Published online Nov 15, 2020. doi: 10.4239/wjd.v11.i11.501
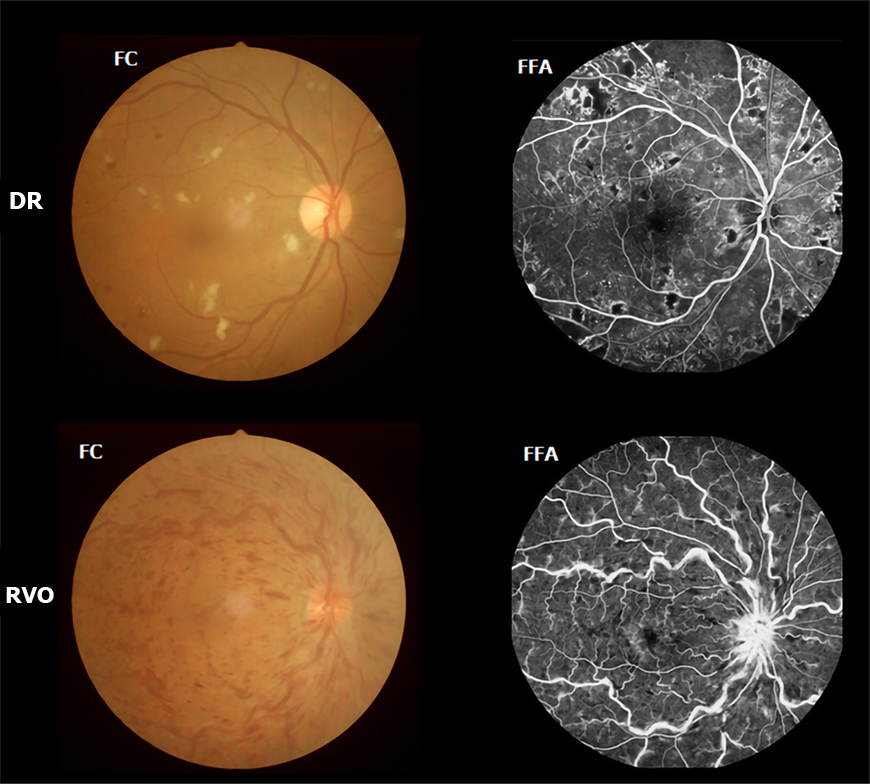
Figure 1 Example of diabetic vitreous hemorrhage caused by diabetic retinopathy and retinal vein occlusion seen on fundus camera and fluorescence fundus angiography.
DR: Diabetic retinopathy; RVO: Retinal vein occlusion; FC: Fundus camera; FFA: Fluorescence fundus angiography.
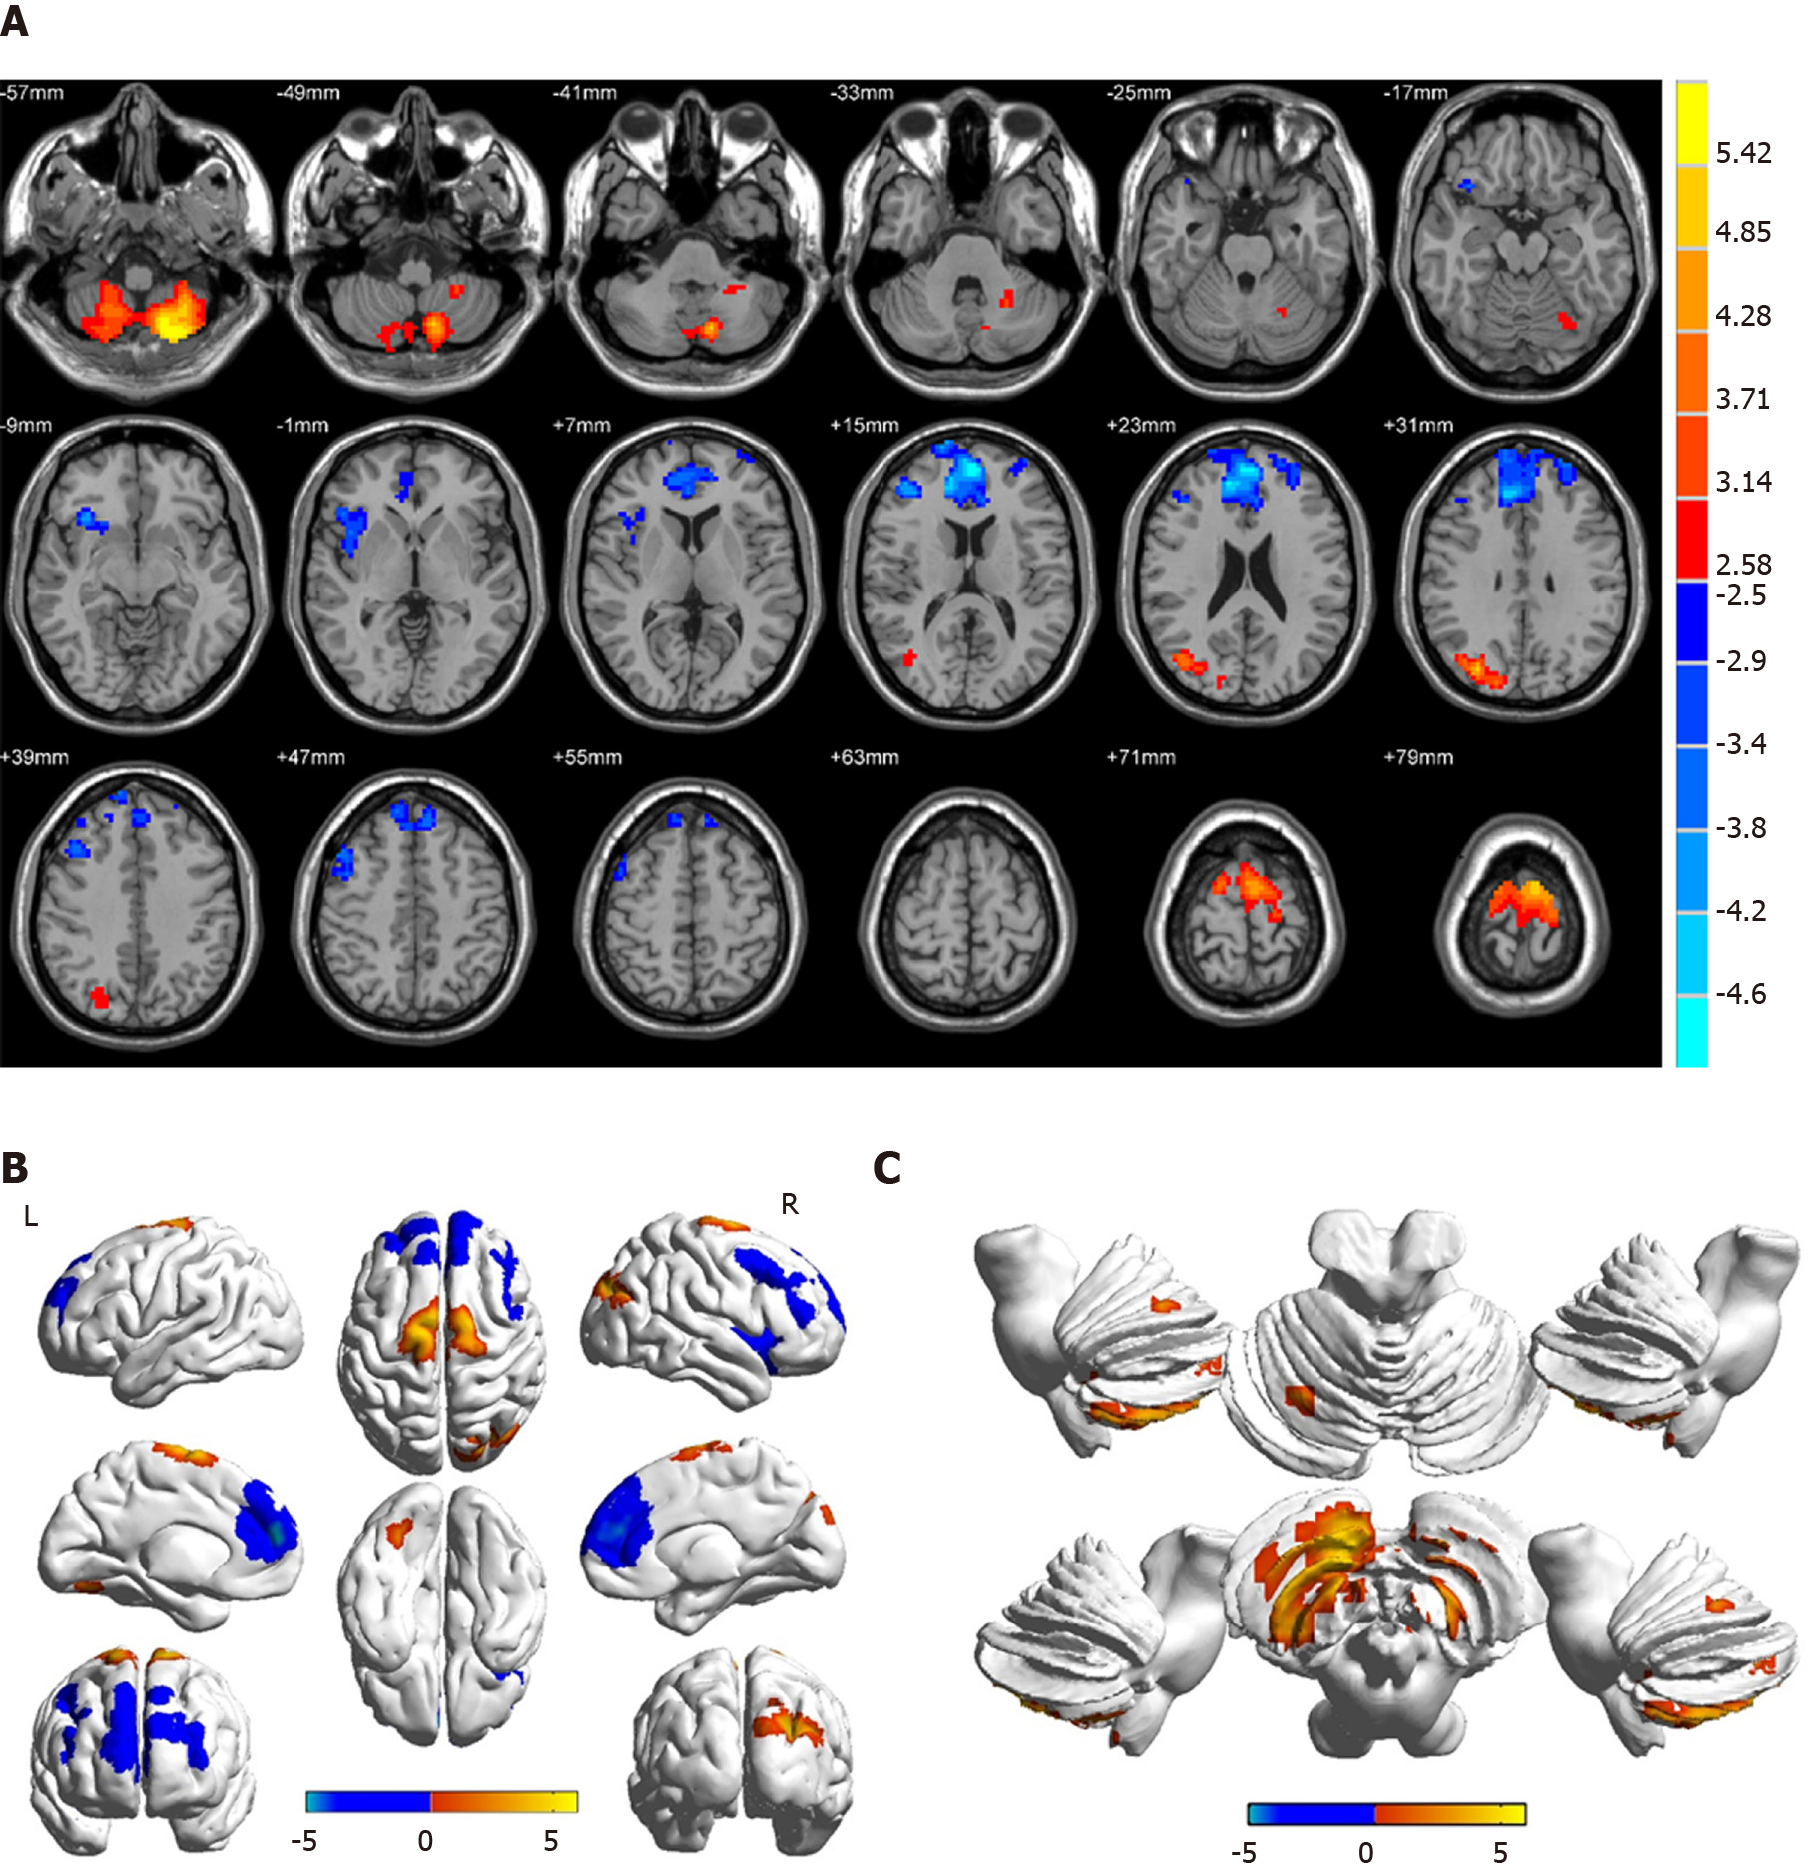
Figure 2 Spontaneous brain activity in patients with diabetic vitreous hemorrhage vs healthy controls.
Significant activity differences were observed in the bilateral cerebellum posterior lobe, right superior/middle occipital gyrus, bilateral superior frontal gyrus, right insula, bilateral medial frontal gyrus, and right middle frontal gyrus. Red denotes higher regional homogeneity values and blue denotes lower regional homogeneity values. P < 0.001 for multiple comparisons using Gaussian random field theory (z > 2.3, P < 0.001, cluster > 40 voxels, AlphaSim corrected). R: Right; L: Left.
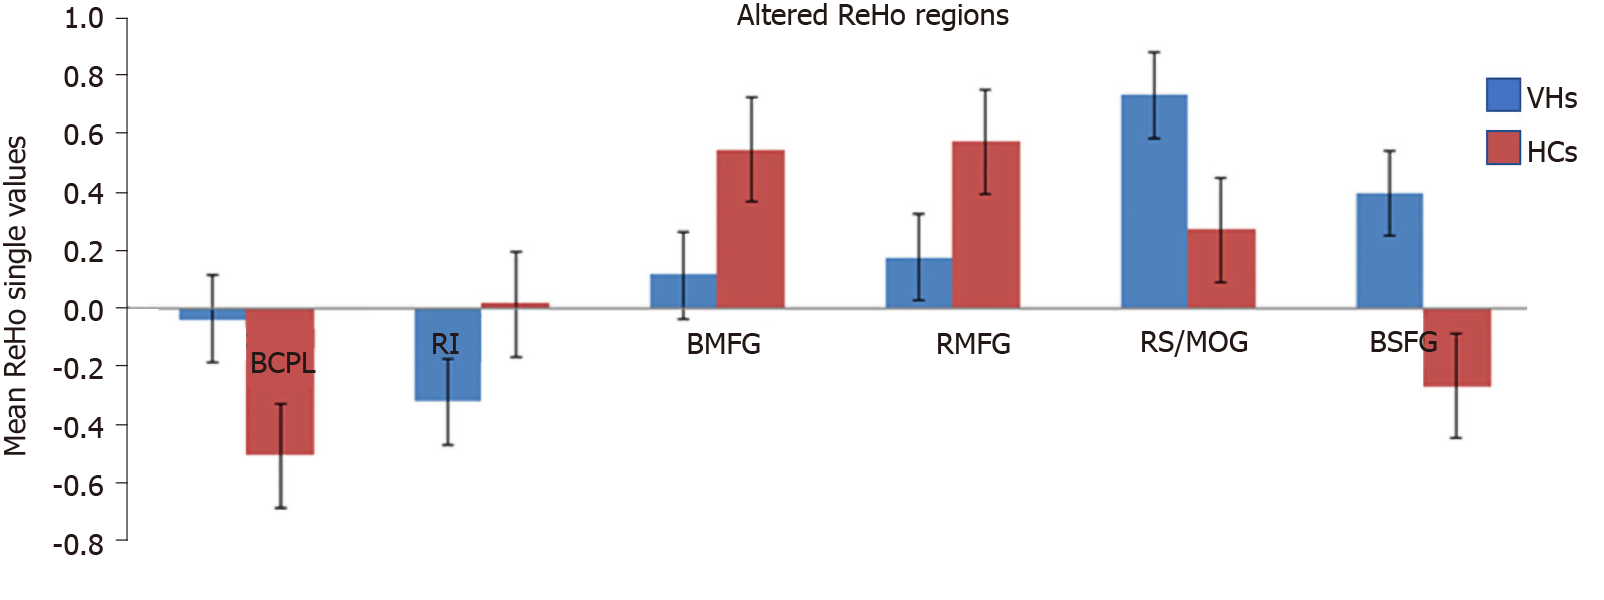
Figure 3 Mean regional homogeneity values between the diabetic vitreous hemorrhage and healthy control groups.
ReHo: Regional homogeneity; VH: Vitreous hemorrhage; HC: Healthy control; BCPL: Bilateral cerebellum posterior lobe; RI: Right insula; BMFG: Bilateral medial frontal gyrus; RMFG: Right middle frontal gyrus; RS: Right superior; MOG: Middle occipital gyrus; BSFG: Bilateral superior frontal gyrus.
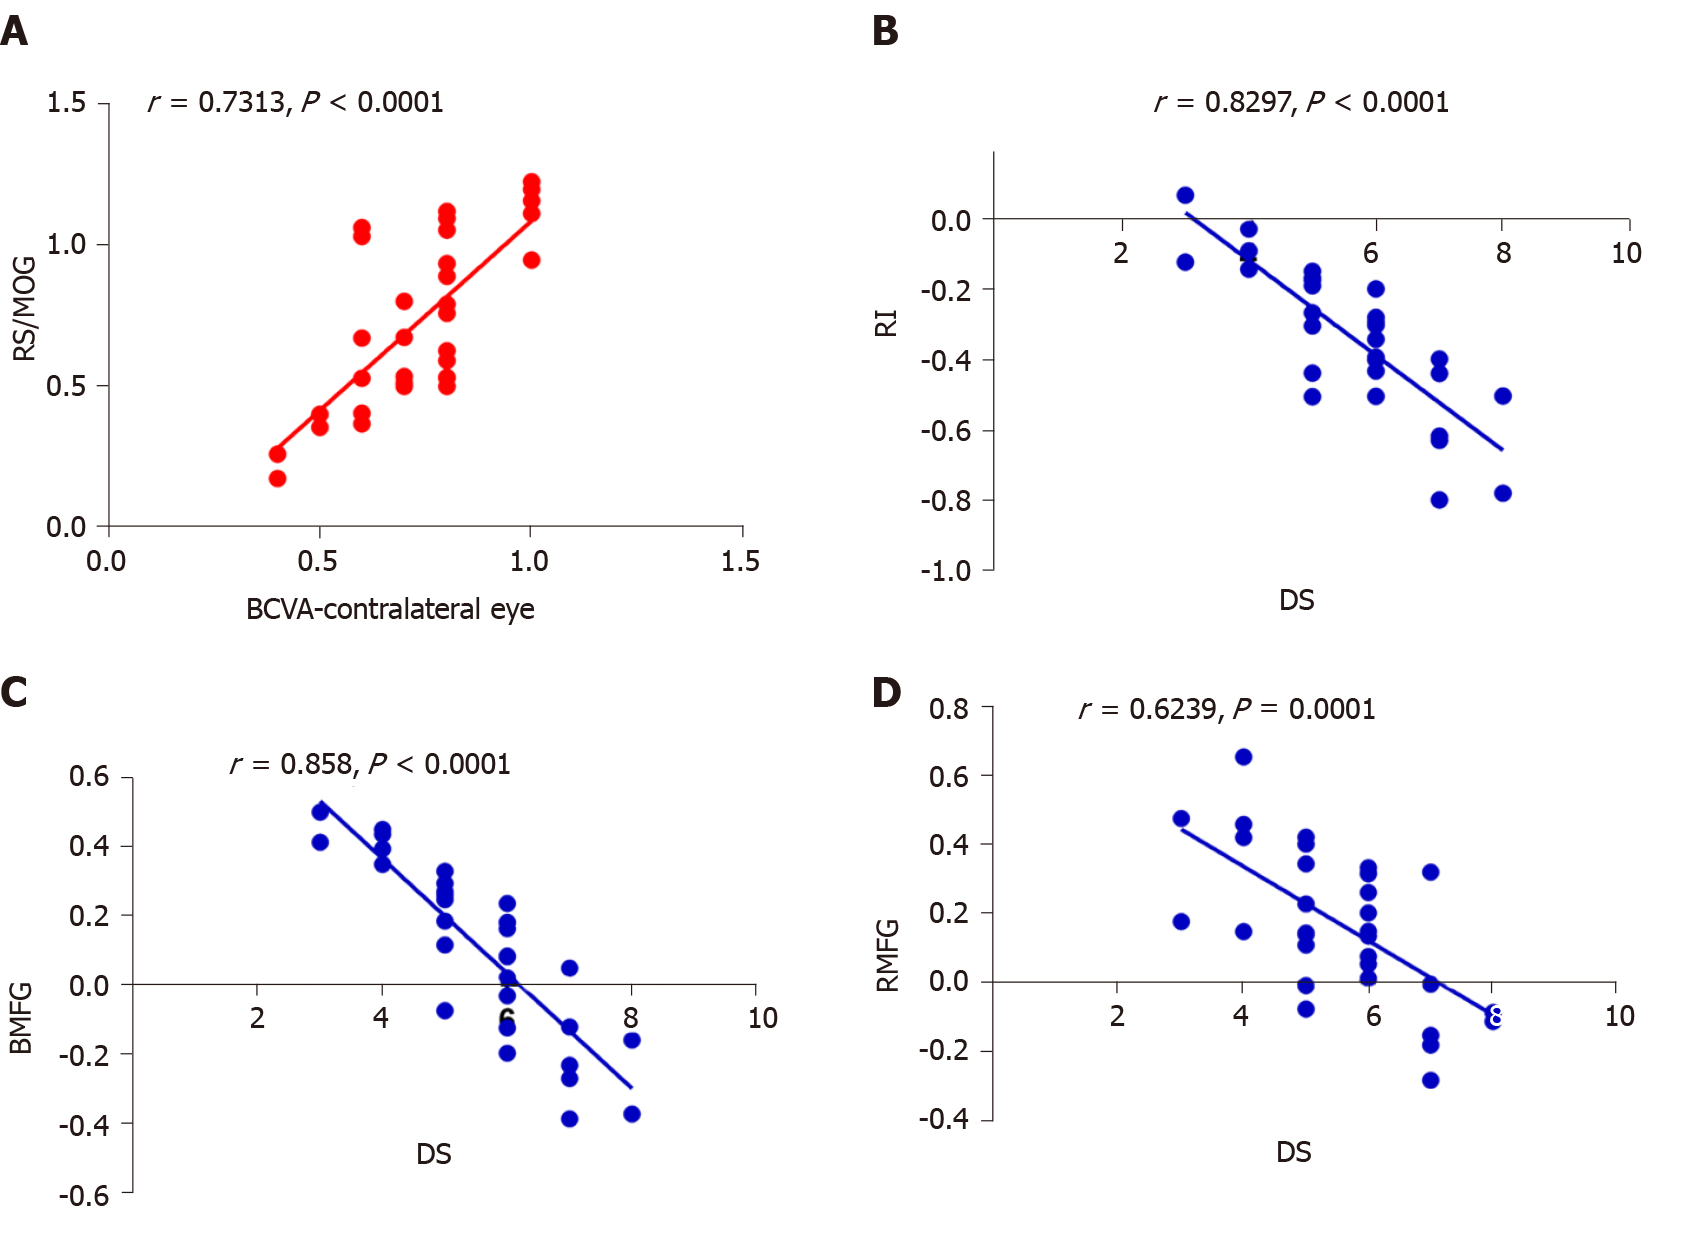
Figure 4 Correlations between mean regional homogeneity signal values of different areas and behavior performances.
A: In diabetic vitreous hemorrhage (DVH) group, best-corrected visual acuity of the contralateral eye showed a positive correlation with the mean regional homogeneity (ReHo) signal value of the right superior/middle occipital gyrus (r = 0.7313, P < 0.0001); B: Depression score in DVH group showed a negative correlation with the mean ReHo signal value of the right insula (r = -0.8297, P < 0.0001); C: Bilateral medial frontal gyrus (r = -0.858, P < 0.0001); D: Right middle frontal gyrus (r = -0.6239, P = 0.0001). RS: Right superior; MOG: Middle occipital gyrus; BCVA: Best-corrected visual acuity; RI: Right insula; DS: Depression score; BMFG: Bilateral medial frontal gyrus; RMFG: Right middle frontal gyrus.
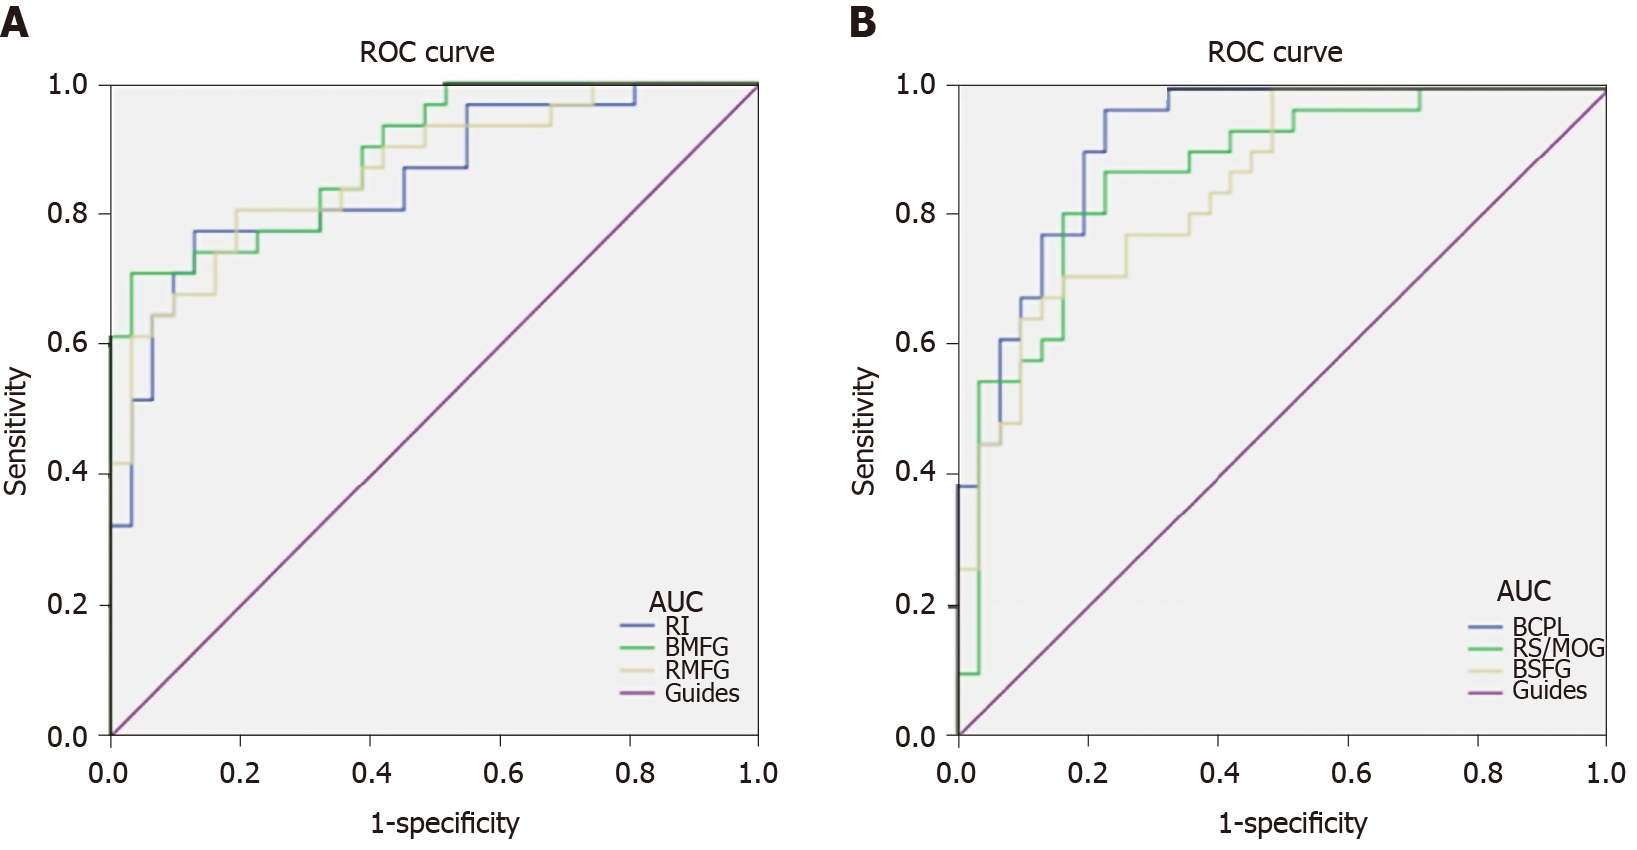
Figure 5 Receiver operating characteristic curve analysis of mean regional homogeneity values for altered brain regions.
A: The areas under the receiver operating characteristic (ROC) curves were 0.919 [P < 0.001; 95% confidence interval (CI): 0.852-0.986] for bilateral cerebellum posterior lobe, 0.868 (P < 0.001; 95%CI: 0.777-0.959) for the right superior/middle occipital gyrus, and 0.851 (P < 0.001; 95%CI: 0.759-0.943) for bilateral superior frontal gyrus; B: The areas under the ROC curves were 0.852 (P < 0.001; 95%CI: 0.757-0.947) for the right insula, 0.894 (P < 0.001; 95%CI: 0.818-0.970) for bilateral medial frontal gyrus, and 0.867 (P < 0.001; 95%CI: 0.778-0.955) for right middle frontal gyrus. ROC: Receiver operating characteristic; AUC: Area under the curve; RI: Right insula; BMFG: Bilateral medial frontal gyrus; RMFG: Right middle frontal gyrus; BCPL: Bilateral cerebellum posterior lobe; RS: Right superior; MOG: Middle occipital gyrus; BSFG: Bilateral superior frontal gyrus.
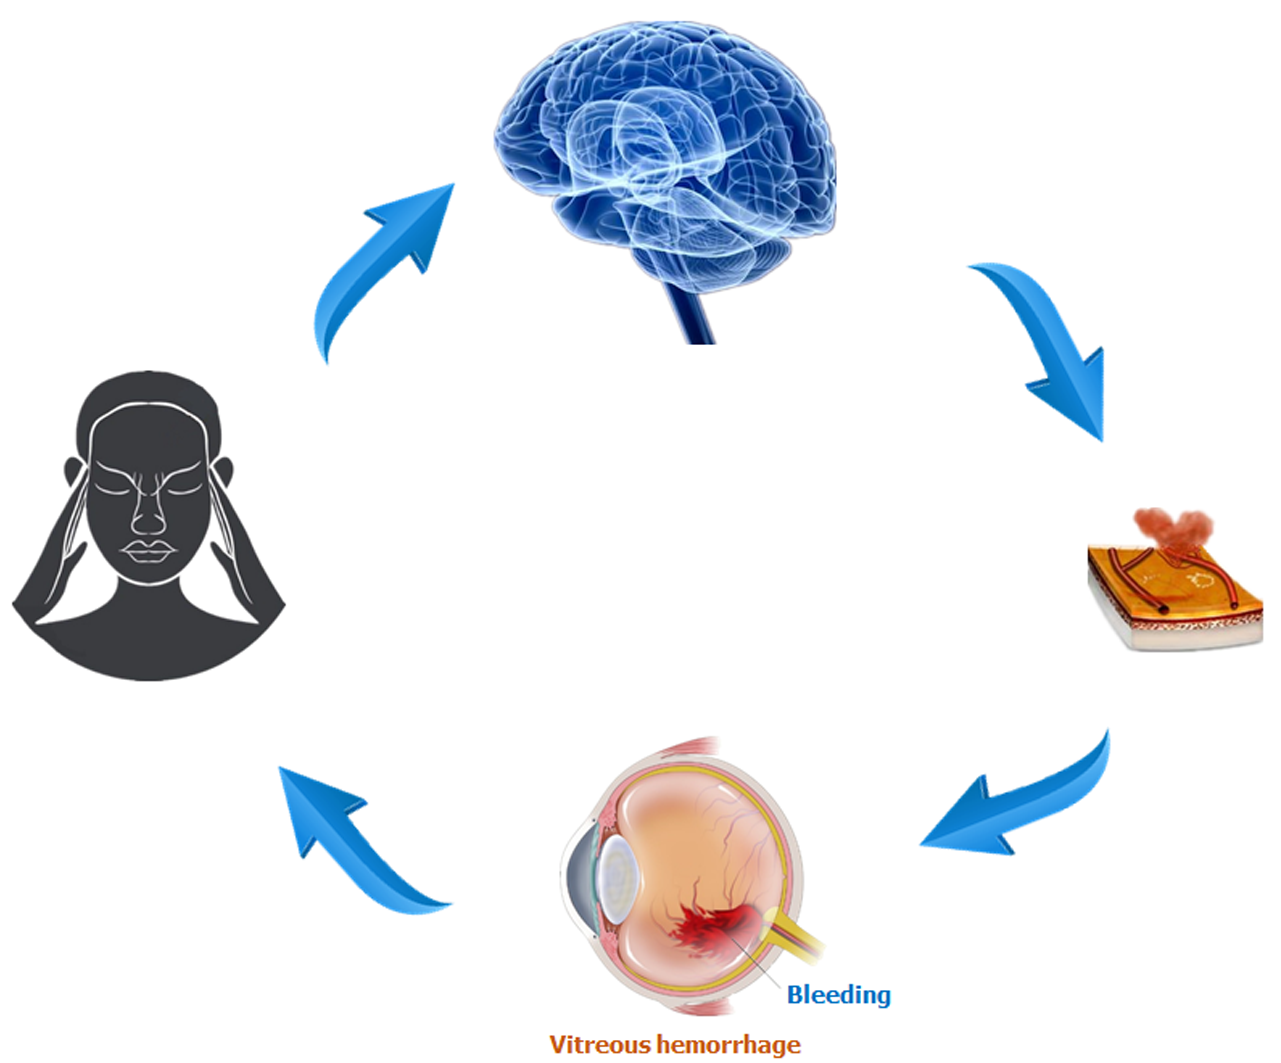
Figure 6 Relationship between magnetic resonance imaging images and diabetic vitreous hemorrhage.
Intracerebral hemorrhage may lead to vitreous hemorrhage, and blood accumulated in vitreous body can result in impaired visual function that may be involved in depression. Brain regions that are associated with emotion processing may present abnormal neural activities.
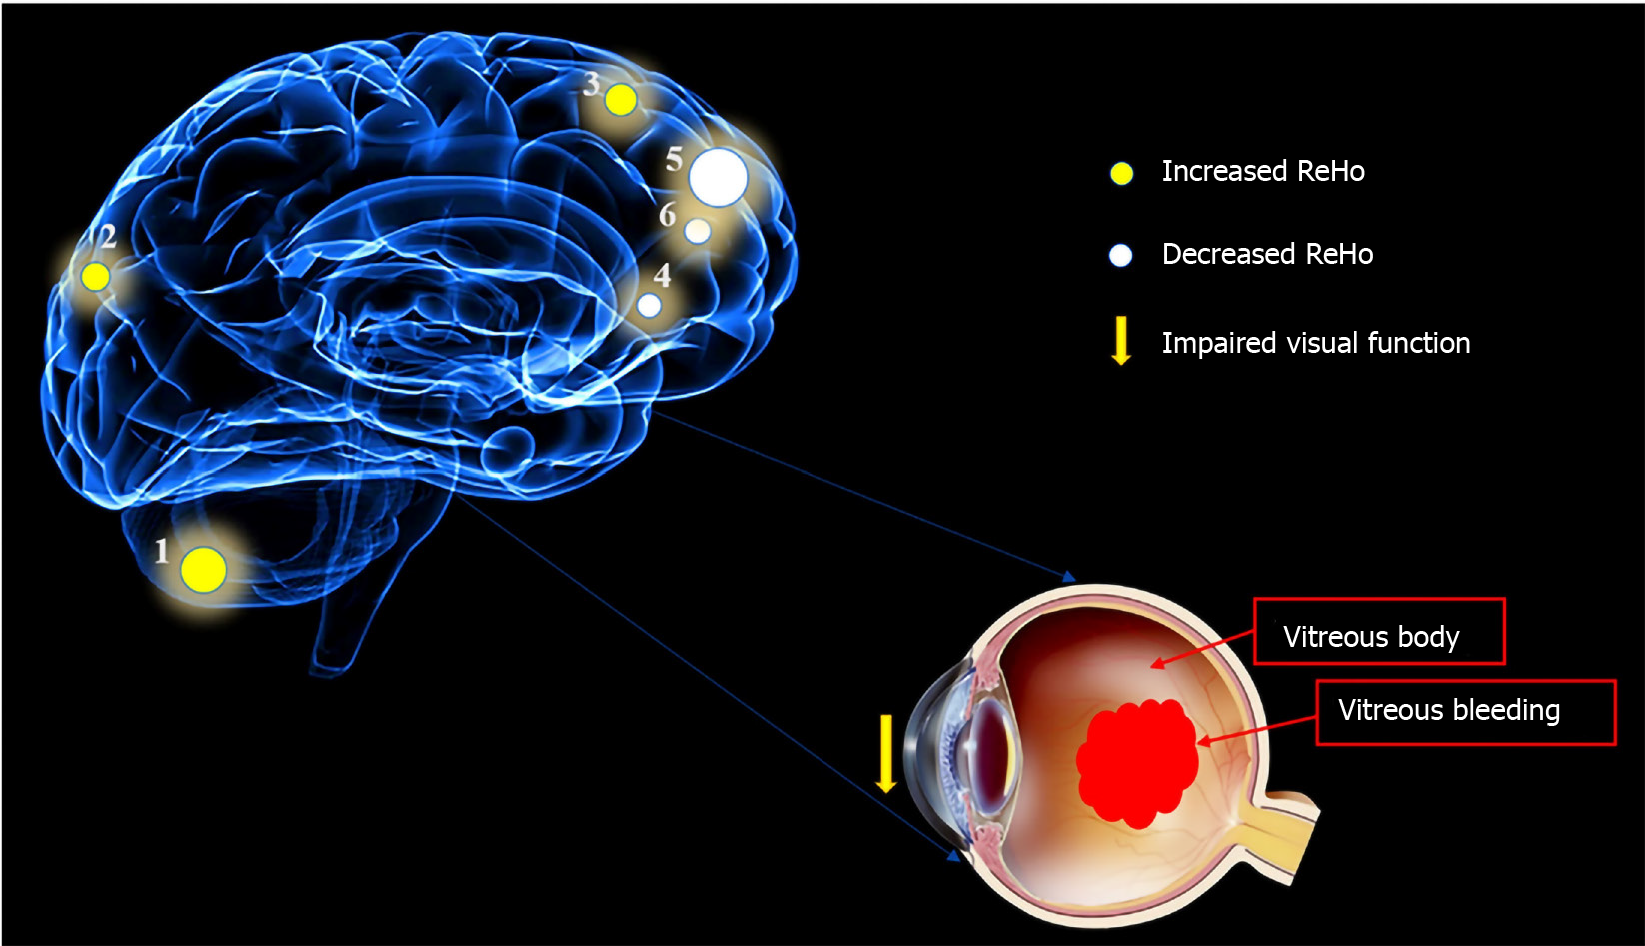
Figure 7 Mean regional homogeneity values of altered brain regions in the diabetic vitreous hemorrhage group.
Compared with the healthy controls, the regional homogeneity values of the following regions were increased to various extents: 1- cerebellum posterior lobe, bilateral (-, t = 5.9833); 2- superior/middle occipital gyrus, right (Brodmann area [BA] 19, t = 4.8595); and 3- superior frontal gyrus, bilateral (BA6, t = 5.0841), whereas the ReHo values of the following regions were decreased: 4- insula, right (BA47, t = -4.1671); 5- medial frontal gyrus, bilateral (BA10, t = -5.0857); and 6- middle frontal gyrus, right (BA9, t = -4.2382). The sizes of the spots denote the degree of quantitative changes. ReHo: Regional homogeneity.
- Citation: Zhang YQ, Zhu FY, Tang LY, Li B, Zhu PW, Shi WQ, Lin Q, Min YL, Shao Y, Zhou Q. Altered regional homogeneity in patients with diabetic vitreous hemorrhage. World J Diabetes 2020; 11(11): 501-513
- URL: https://www.wjgnet.com/1948-9358/full/v11/i11/501.htm
- DOI: https://dx.doi.org/10.4239/wjd.v11.i11.501


