Copyright
©The Author(s) 2019.
World J Diabetes. May 15, 2019; 10(5): 311-323
Published online May 15, 2019. doi: 10.4239/wjd.v10.i5.311
Published online May 15, 2019. doi: 10.4239/wjd.v10.i5.311
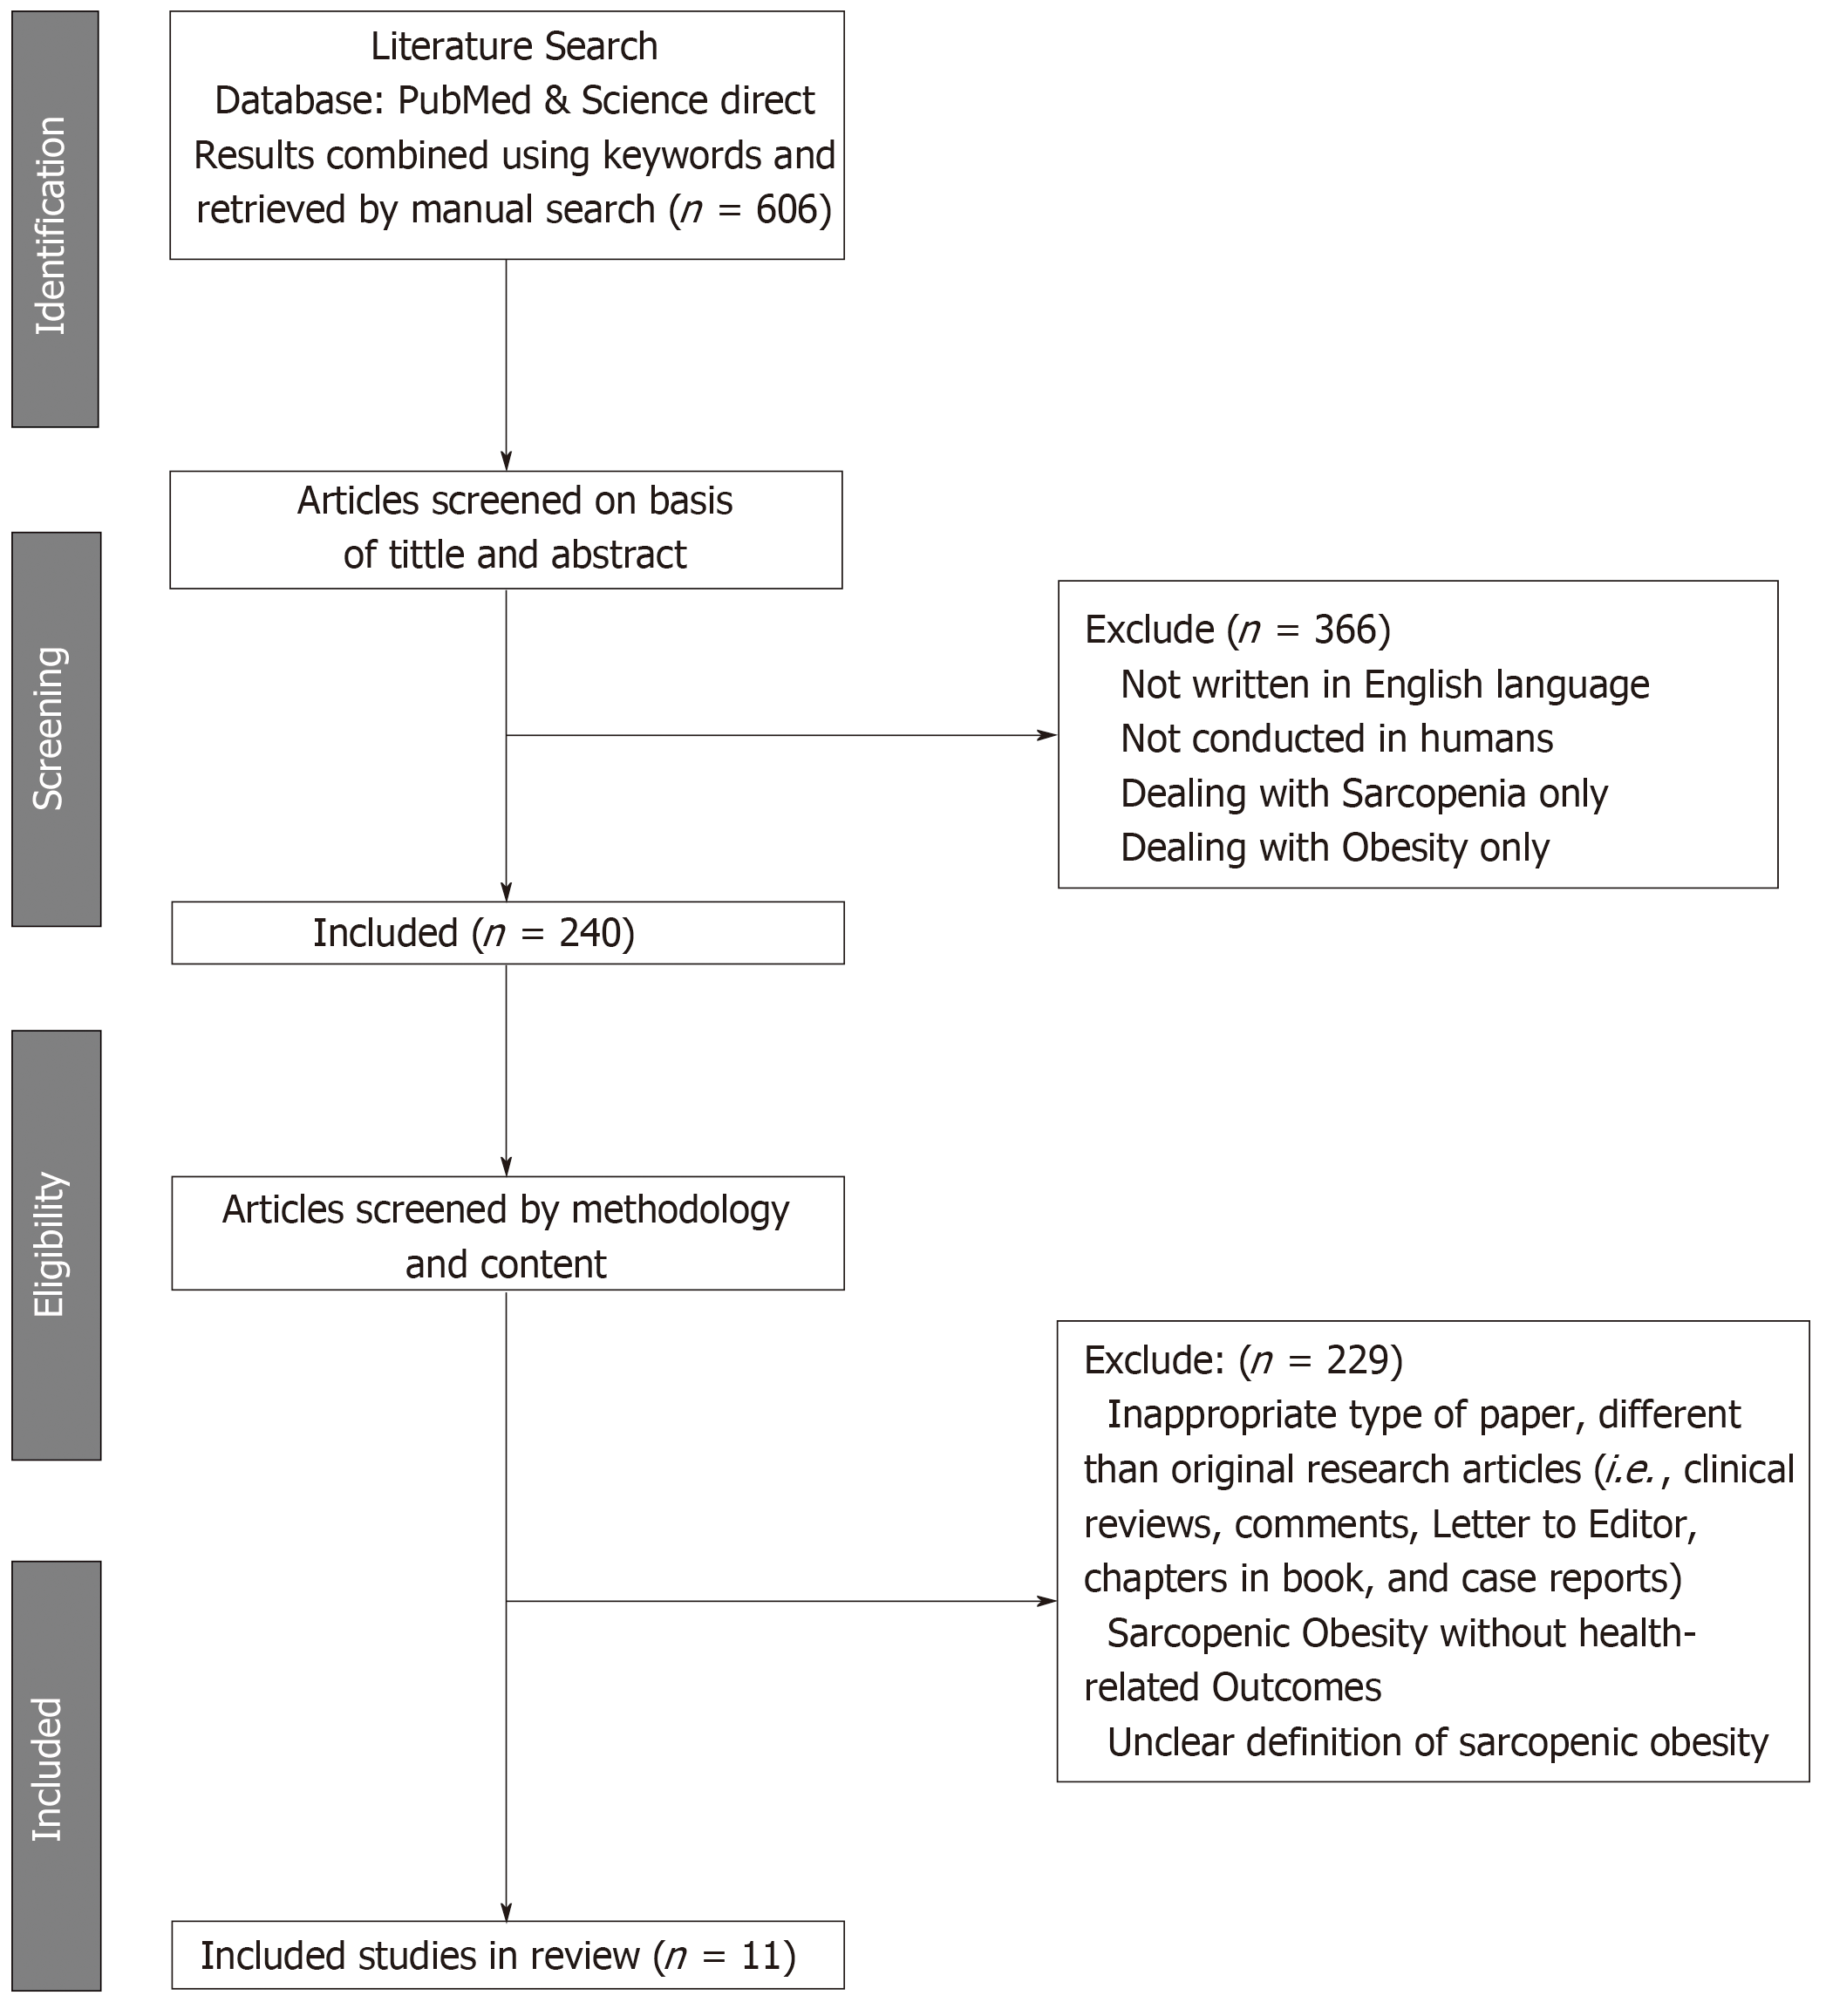
Figure 1 The flowchart summarizing the study selection procedure.
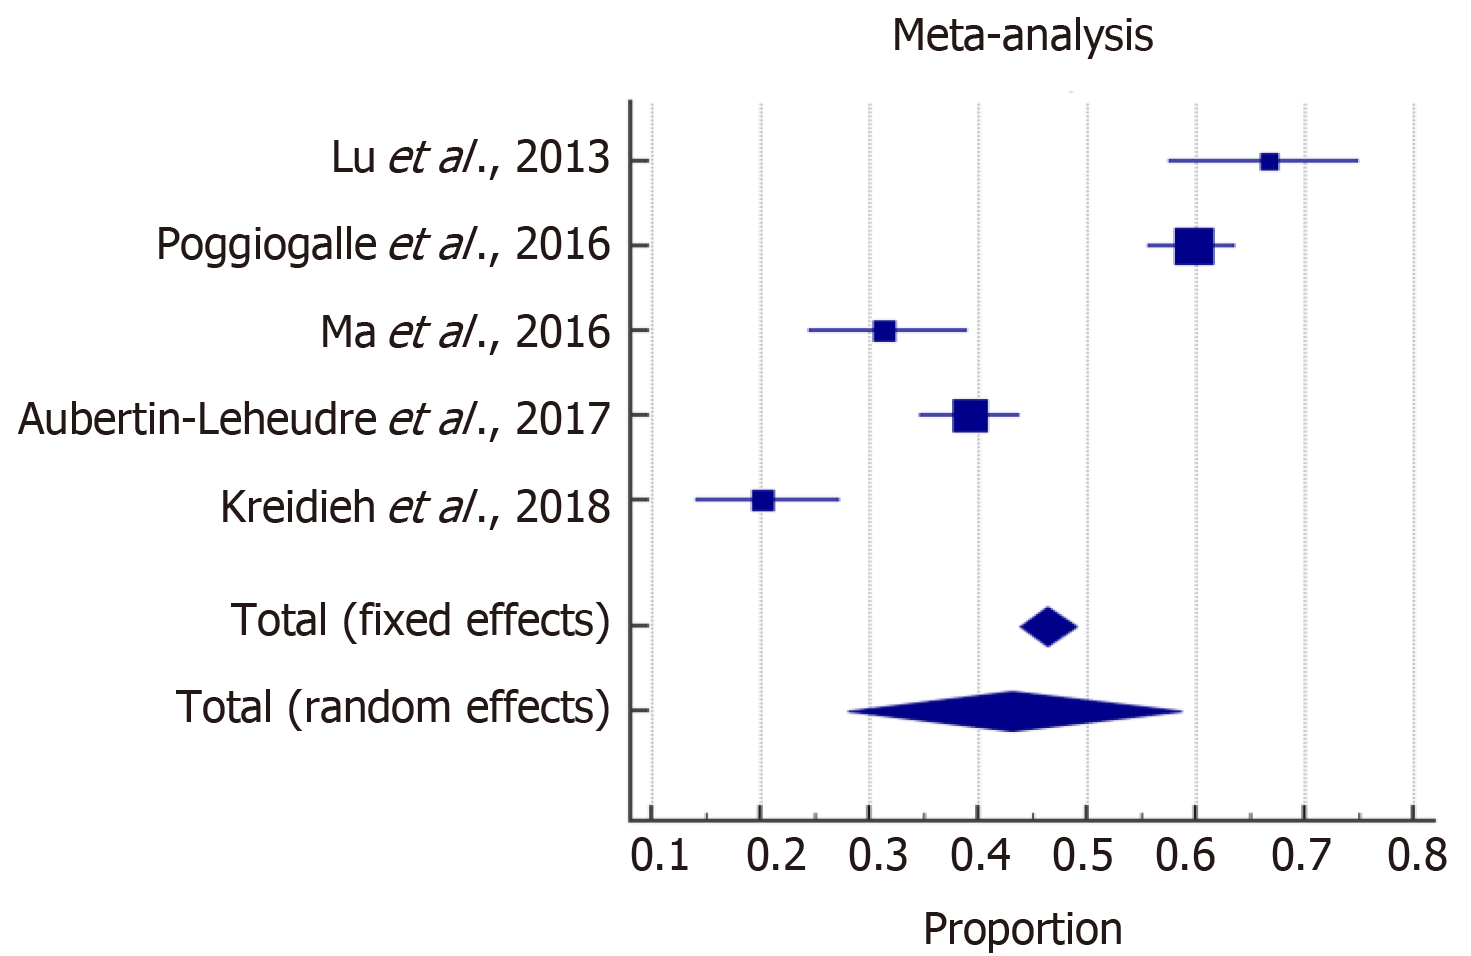
Figure 2 Forest plot for the pooled estimate of proportion of females with sarcopenic obesity.
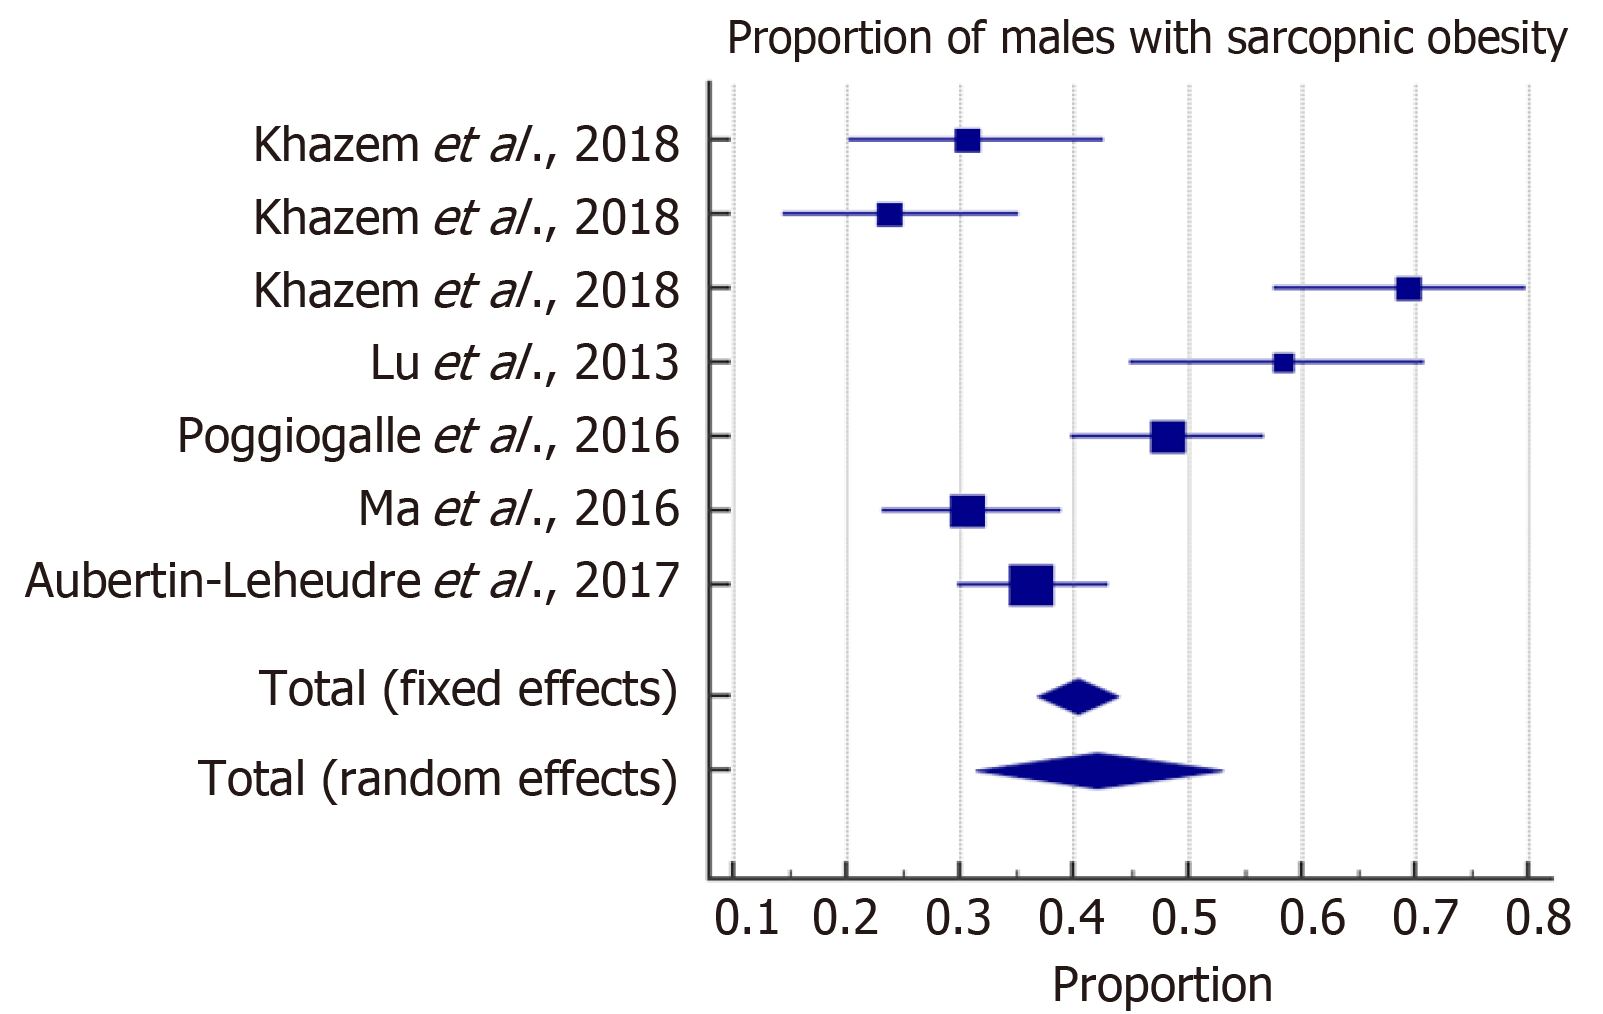
Figure 3 Forest plot for the pooled estimate of proportion of males with sarcopenic obesity.
Figure 4 Forest plot for the pooled estimate of the odds of type 2 diabetes with sarcopenic obesity.
- Citation: Khadra D, Itani L, Tannir H, Kreidieh D, El Masri D, El Ghoch M. Association between sarcopenic obesity and higher risk of type 2 diabetes in adults: A systematic review and meta-analysis. World J Diabetes 2019; 10(5): 311-323
- URL: https://www.wjgnet.com/1948-9358/full/v10/i5/311.htm
- DOI: https://dx.doi.org/10.4239/wjd.v10.i5.311


