Published online Jun 15, 2025. doi: 10.4251/wjgo.v17.i6.105213
Revised: April 19, 2025
Accepted: May 13, 2025
Published online: June 15, 2025
Processing time: 150 Days and 5.6 Hours
Gastric cancer (GC) is a leading cause of cancer-related death worldwide. Hypo
To assess the relationship between EPAS1 expression and prognosis in GC and investigate its possible role in the development of GC.
EPAS1 expression in GC and adjacent tissues was assessed using immunohistochemistry. Correlations with clinicopathological features were analyzed by using The Cancer Genome Atlas (TCGA) and clinical data to evaluate its prognostic value. The TIMER2.0 database was used to examine associations between EPAS1 and immune-infiltrating cells. Gene set enrichment analysis identified the mecha
EPAS1 expression was significantly greater in GC tissues than in adjacent tissues (P < 0.05). High EPAS1 expression was correlated with shorter overall survival (OS) and was associated with greater infiltration depth and poorer tumor differentiation (P < 0.05). Univariate and multivariate Cox analyses revealed that EPAS1 expression (HR: 2.095; 95%CI: 1.019-4.307; P < 0.001) was an independent predictor of OS. EPAS1 was enriched in the epithelial-mesenchymal transition (EMT), inflammatory response, KRAS, TGF-β, TNF-/NF-kB, and IL6/JAK/STAT3 signaling pathways. The high EPAS1 expression group presented increased levels of pathway-related molecules and immunotherapy checkpoints. In vitro and in vivo studies confirmed that silencing EPAS1 reduced GC cell invasion and metastasis.
EPAS1 may be a prognostic marker in patients with GC and may promote tumor growth through the immune response and pathways associated with EMT, inflammatory response, KRAS, TGF-β, TNF-/NF-kB,
Core Tip: EPAS1 expression is significantly higher in gastric cancer (GC) tissues than in adjacent tissues and is correlated with poor overall survival in patients with GC. High EPAS1 expression is associated with increased infiltration, poor tumor differentiation, and the activation of multiple signaling pathways, including the epithelial-mesenchymal transition, inflammatory response, KRAS, TGF-β, TNF-/NF-kB, and IL6/JAK/STAT3 pathways. EPAS1 also enhances the invasion and metastasis of GC cells. These findings suggest that EPAS1 may serve as an independent prognostic marker and contribute to tumor progression through immune responses and key signaling pathways.
- Citation: Xu W, Li W, Ru J. Endothelial Per-Arnt-Sim domain-containing protein 1 expression is correlated with poor prognosis and promotes invasion and metastasis in gastric cancer. World J Gastrointest Oncol 2025; 17(6): 105213
- URL: https://www.wjgnet.com/1948-5204/full/v17/i6/105213.htm
- DOI: https://dx.doi.org/10.4251/wjgo.v17.i6.105213
Gastric cancer (GC) remains a significant global health challenge; it is the fifth most common malignant tumor worldwide and the second leading cause of cancer-related death globally[1]. Despite advancements in surgical techniques and systemic treatment, GC has a poor prognosis, and the 5-year survival rate of patients with advanced GC remains very low (< 10%), mainly due to the limited understanding of advanced diagnosis and its molecular pathogenesis[2]. The current treatment modalities, including chemotherapy and targeted therapy, are hindered by heterogeneous tumor biology and acquired drug resistance, emphasizing the urgent need to identify new therapeutic targets and biomarkers.
Hypoxia is a marker of the microenvironment of solid tumors and promotes malignant progression by activating HIFs. Endothelial PAS domain protein 1 (EPAS1, also known as HIF2-α) mediates the adaptive response to hypoxic stress by regulating genes involved in angiogenesis, metabolism and the epithelial-mesenchymal transition (EMT)[3]. Although HIF1-α has been widely studied in GC and other cancers, the carcinogenic effect of EPAS1 in GC has not been fully studied[4]. Preliminary studies have shown that EPAS1 promotes tumor progression through EMT and immune evasion mechanisms[5]. However, its clinical relevance and biological functions in GC remain unclear.
Here, we utilized data from The Cancer Genome Atlas (TCGA) and clinical datasets to investigate the expression of EPAS1 in GC and its prognostic significance. Our analysis revealed that EPAS1 is significantly upregulated in GC tissues compared with adjacent normal mucosa. High expression of EPAS1 is associated with advanced TNM, lymph node metastasis and a reduced overall survival (OS) rate. To verify these findings, we conducted in vitro and in vivo experiments to demonstrate that EPAS1 silencing inhibits the proliferation, migration and invasion of GC cells. These data provide evidence that EPAS1 is associated with the progression of GC and emphasize its potential as a prognostic biomarker and therapeutic target.
The clinical data of 375 individuals with GC were obtained from the TCGA database (https://portal.cdc.cancer.gov/), with data from a total of 241 males and 134 females: (1) The expression profile data was downloaded as a consistent log2 transformation of RNA-seq data in FPKM format; (2) For the clinical correlation and prognostic analysis data, the RNA-seq data in HTSeq-FPKM format in the database were converted to TPM format and obtained after log2 transformation; and (3) Clinical information such as tumor stage, metastasis status and survival status were obtained from the database, and the relevant language package in R (version 3.6.3) (http://www.r-project.org/) was used.
A total of 95 postoperative pathologically confirmed patients with GC admitted to our hospital from January 2019 to January 2022 were selected. All patients were followed up by telephone or at outpatient clinics for 2 years in accordance with National Comprehensive Cancer Network recommendations, and the follow-up deadline was 2022-1-30. Among the patients, 67 were male, and 28 were female. Patient age ranged from 28 to 94 years, with an average age of 62.62 ± 10.23 years.
The inclusion criteria were as follows: (1) Postoperative pathological diagnosis of primary GC; (2) Endoscopic submucosal dissection surgery or D2 radical gastrectomy for GC; and (3) Postoperative survival time ≥ 3 months.
The exclusion criteria were as follows: (1) The presence of other types of malignant tumors; (2) A previous diagnosis of tumors or autoimmune system diseases; and (3) The administration of neoadjuvant chemotherapy before surgery.
The TNM staging system is based on the staging guidelines of the American Joint Committee on Cancer (8th edition)[6]. The main patient endpoint was OS, which was defined as the time between diagnosis and death.
The GC cell lines HGC27 and MKN45 were obtained from the Cell Bank of the Chinese Academy of Sciences (Shanghai, China). These cells were cultured in DMEM (Cytiva, China) supplemented with 10% fetal bovine serum (FBS) (Cytiva, China), penicillin (100 μg/mL), and streptomycin (100 μg/mL). Cultures were maintained in a humidified incubator at 37 °C with 5% CO2, and the medium was replaced every 2 days. The cells were subcultured when they reached 70%-90% confluence. For the animal experiments, 4–6-week-old male BALB/c nude mice (Shanghai BK Company, China), weighing between 20-25 g, were used. The mice were housed in a SPF environment at Zhejiang University of Traditional Chinese Medicine, where they were provided with food and bedding. HGC27 cells were transfected with either the NC-vector or shRNA-EPAS1. A cell suspension of 5.0 × 10⁶ cells per milliliter in phosphate-buffered saline (PBS) was prepared, and 100 μL of the suspension was injected subcutaneously into the left armpit of each mouse. Tumor growth was monitored regularly. After approximately 6 weeks, the mice were euthanized by cervical dislocation, and the subcutaneous tumors were excised and weighed to assess their growth characteristics.
The expression level of EPAS1 in GC was analyzed using the GEPIA and GEO databases. The TIMER2.0 database was used to analyze the correlation between different expression levels of EPAS1 and infiltrating immune cells. Gene set enrichment analysis (GSEA) software (v4.0.3) was used to explore the mechanism of EPAS1 expression in GC progression, and a false discovery rate (FDR) < 0.25 and an adjusted P < 0.05 were considered to indicate significant enrichment. The HALLMARK gene set was obtained from the MSigDB database V7.2.
The 5 μm thick paraffin sections were dewaxed in xylene I and II for 10 minutes each, gradually dehydrated in 100%, 95%, 90%, 80%, and 70% absolute ethanol solutions for 5 min each, and then boiled in distilled water for 15 minutes. After sealing with 10% serum-containing blocking solution at room temperature for 1 hour, The EPAS1 antibody (Abcam) was applied and incubated overnight at 4 °C. Horseradish peroxidase-conjugated antibodies were visualized using diaminobenzidine. Following counterstaining with hematoxylin, the sections were dehydrated and mounted. The level of positive staining was then assessed under a microscope.
Two pathologists utilized a semiquantitative immunoreactivity score (IRS) to categorize patients into groups with high and low expression levels. The staining intensity was scored as follows: 0 (no staining), 1 (light staining), 2 (medium staining), and 3 (intense staining). The staining range was scored as follows: 0 (< 5% stained), 1 (5%-25% stained), 2 (26%-50% stained), 3 (51%-75% stained), and 4 (75%-100% stained). The IRS for EPAS1 expression was calculated by multiplying the staining intensity score with the staining range score. Patients were then classified into high expression (> 6 points) and low expression (≤ 6 points) groups[7].
For the Transwell assay (8-μm pore size, BD Biosciences), 200 μL of a GC cell suspension (5 × 10⁴ cells) was added to the upper chamber and incubated for 24 h at 37 °C in a 5% CO2 atmosphere. The lower chamber was filled with DMEM supplemented with 20% FBS. After incubation, nonmigrated cells were gently removed with cotton swabs. The remaining cells were fixed with methanol for 5 minutes and then stained with crystal violet (Beyotime, China) for 30 minutes. After staining, the cells were rinsed with deionized water to eliminate excess stain, and the number of invasive cells was counted under a microscope.
GC cells were seeded at a low density of 5000 cells per 100 mm dish and cultured for 10 days at 37 °C in a 5% CO2 incubator. After the medium was removed, the cells were washed with PBS and fixed with 4% paraformaldehyde at 37 °C for 10 minutes. The cells were then stained with 0.5% crystal violet for 15 minutes at 37 °C. The wells were subsequently rinsed three times with PBS, allowed to air dry, and analyzed for colony formation.
The GC cell suspension was incubated on ice for 30 minutes with RIPA buffer containing 1% PMSF (Solarbio, China) for lysis, followed by centrifugation at 12000 × g for 10 minutes at 4 °C. Total protein was separated by SDS-PAGE (Beyotime, China) and transferred to PVDF membranes (Millipore, United States) in transfer buffer. The membranes were blocked with 5% skim milk at 37 °C for 2 hours and then incubated overnight at 4 °C with an anti-EPAS1 antibody (1: 1000; ab207607; Abcam, United States). Afterward, the membranes were treated with HRP-conjugated goat anti-rabbit IgG (Servicebio, China) for 2 hours at 37 °C. β-actin was used as a loading control. Immunoreactive bands were detected using a sensitive ECL kit (Meilunbio, China) and visualized with the GE AI800 gel imaging system.
Statistical analysis was performed using R language version 4.0.3 with the R Studio software package, while SPSS 19.0 was also utilized for statistical computations. The independent samples t-test was applied to evaluate differences in EPAS1 expression between GC and adjacent tissues. The χ2 test was used to examine the relationships between EPAS1 mRNA expression and clinicopathological features. OS was assessed through Kaplan-Meier survival analysis. Both univariate and multivariate Cox regression analyses were employed to determine the impact of each variable on OS, with a significance level set at P < 0.05.
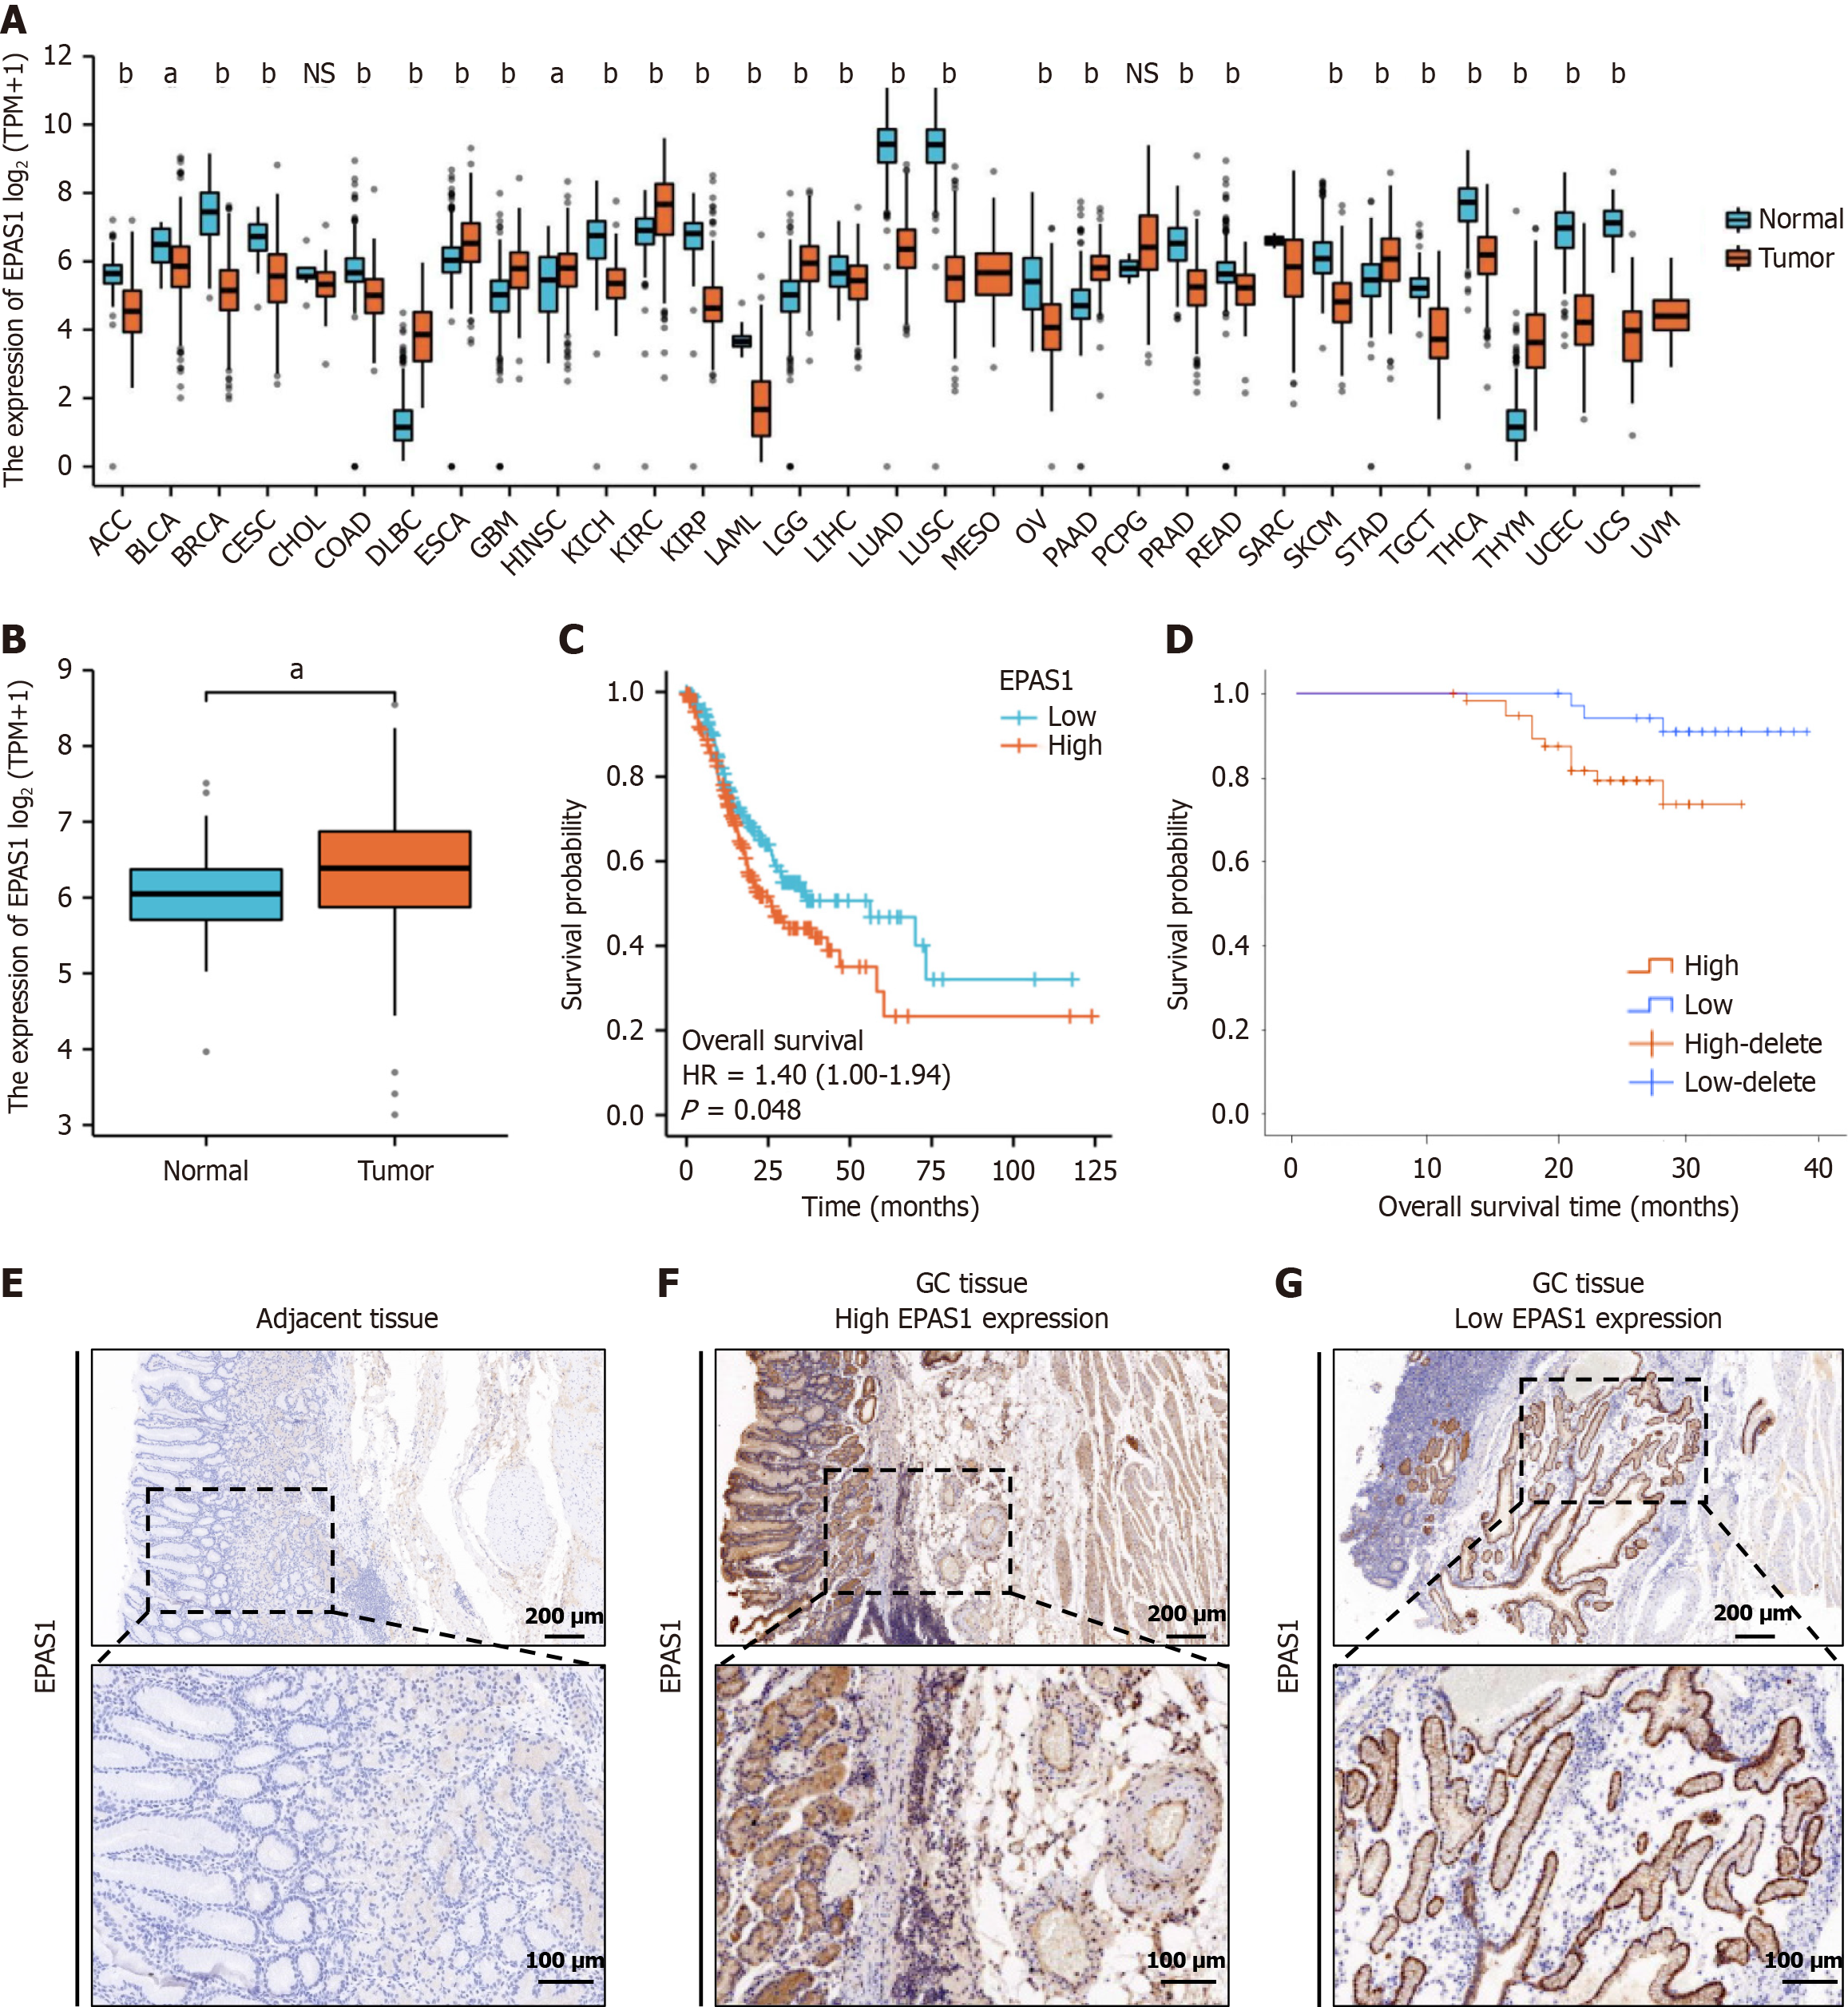
In this study, we analyzed RNA-seq datasets from the TCGA database and the corresponding clinical features and found that EPAS1 was differentially expressed in different tumors to varying degrees (Figure 1A). Analysis of the TCGA database revealed that EPAS1 expression in GC tissue (n = 375) was notably higher compared to normal gastric mucosa tissue (n = 32) (P < 0.05) (Figure 1B). Furthermore, the OS of the EPAS1 low expression group was significantly longer than that of the high expression group, suggesting a better prognosis (P < 0.05) (Figure 1C). The analysis results combined with the existing clinical data also revealed that patients in the low EPAS1 expression group had considerably better OS than did those in the high EPAS1 expression group (P < 0.001) (Figure 1D). The IRS of EPAS1 in GC tissues was notably higher compared to adjacent tissues (t = 6.213, P < 0.05) (Figure 1E-G). The findings suggest that EPAS1 may serve as a prognostic marker for patients with GC.
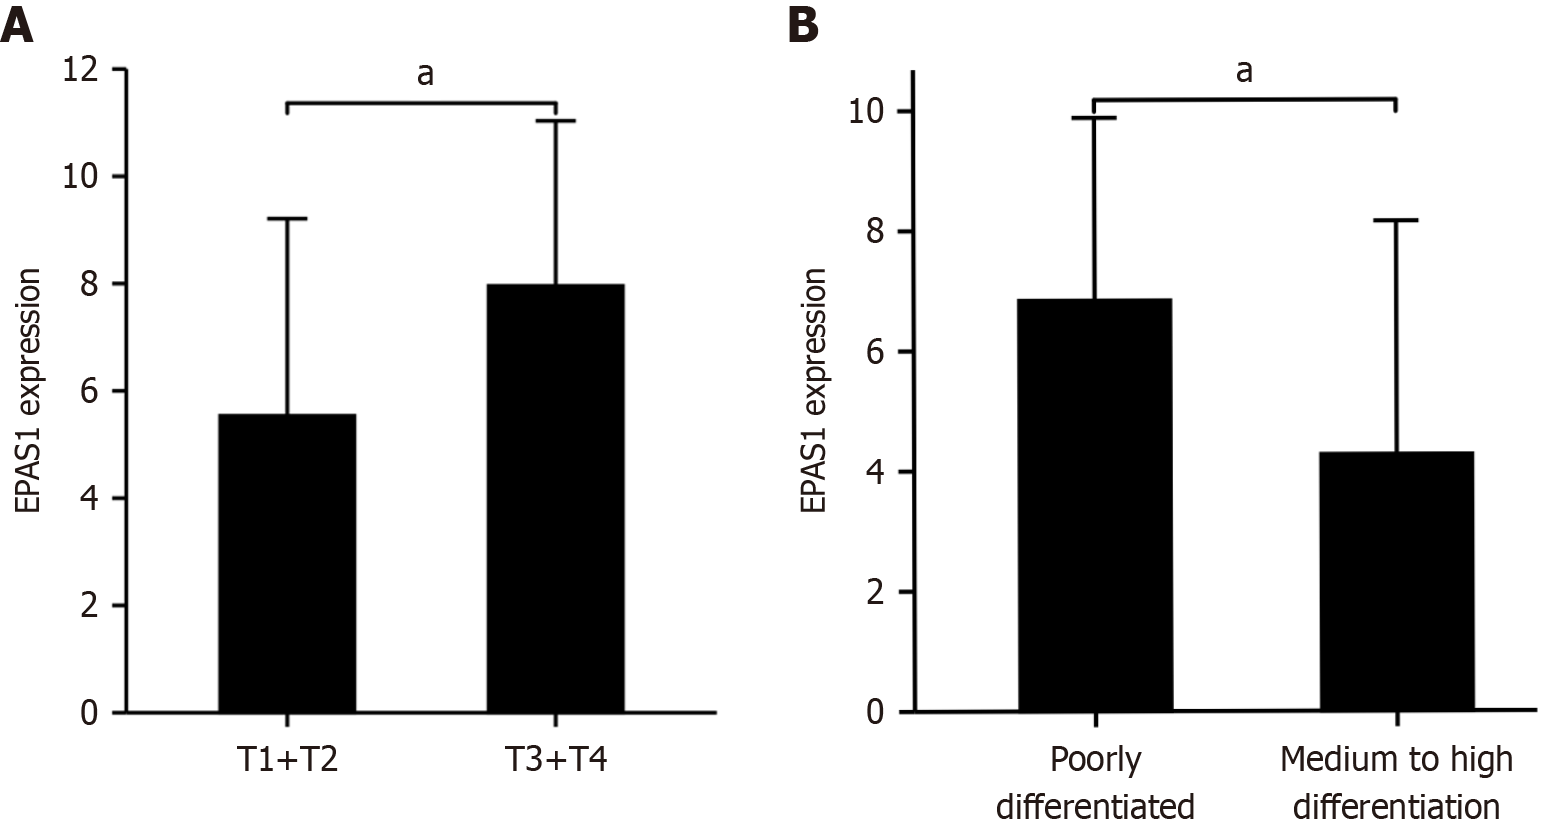
EPAS1 expression in GC was strongly associated with the infiltration depth and degree of differentiation of the primary tumor (t = 3.138, 2.275, P < 0.05) (Figure 2). The percentage of invading serosal and subserosal connective tissue was considerably greater in the high-expression group (χ2 = 9.63, P = 0.022), as was the proportion of poorly differentiated tissue (χ2 = 4.25, P = 0.039) (Table 1). The OS of the high EPAS1 expression group was also lower than that of the low EPAS1 expression group (t = 7.149, both P < 0.001). Univariate and multivariate Cox analyses revealed that EPAS1 expression (HR: 2.095; 95%CI: 1.019-4.307; P < 0.001) was an independent predictor of OS (Table 2).
| Characteristics | High EPAS1 (n = 58) | Low EPAS1 (n = 37) | χ2/t | P value |
| Age (years) | 64.39 ± 11.89 | 61.84 ± 10.66 | 1.064 | 0.290 |
| Gender (male/female) | 41/14 | 26/11 | 0.002 | 0.965 |
| BMI (kg/m2) | 23.51 ± 2.47 | 24.21 ± 2.60 | 1.309 | 0.194 |
| H. pylori infection | 12 (20.69) | 6 (16.21) | 0.294 | 0.587 |
| Hypertension | 12 (20.69) | 10 (27.03) | 0.510 | 0.475 |
| Diabetes | 9 (15.52) | 8 (21.62) | 0.573 | 0.449 |
| Coronary heart disease | 16 (27.59) | 11 (29.73) | 0.051 | 0.821 |
| Tumor location | 0.426 | 0.808 | ||
| Cardia bottom of stomach | 27 (46.55) | 18 (48.65) | ||
| Body of stomach | 22 (37.93) | 15 (40.54) | ||
| Pyloric department | 9 (15.52) | 4 (10.81) | ||
| Vascular invasion | 12 (20.69) | 5 (13.51) | 0.792 | 0.374 |
| T stage | 9. 631 | 0.022 | ||
| T1 | 22 (37.93) | 25 (67.57) | ||
| T2 | 18 (31.03) | 8 (21.62) | ||
| T3 | 13 (22.42) | 4 (10.81) | ||
| T4 | 5 (8.62) | 0 (0.00) | ||
| N stage | 2.020 | 0.568 | ||
| N0 | 33 (56.90) | 26 (70.27) | ||
| N1 | 14 (24.14) | 7 (18.92) | ||
| N2 | 7 (12.07) | 3 (8. 11) | ||
| N3 | 4 (6.89) | 1 (2.70) | ||
| M stage | 0.743 | 0.389 | ||
| M0 | 48 (82.76) | 33 (89.19) | ||
| M1 | 10 (17.24) | 4 (10.81) | ||
| TNM stage | 3.451 | 0.327 | ||
| I | 32 (55.17) | 26 (70.27) | ||
| II | 11 (18.97) | 6 (16.21) | ||
| III | 7 (12.07) | 1 (2.70) | ||
| IV | 8 (13.79) | 4 (10.81) | ||
| Histological type | 2.587 | 0.629 | ||
| Papillary adenocarcinoma | 11 (18.97) | 9 (24.32) | ||
| Tubular adenocarcinoma | 25 (43.10) | 14 (37.84) | ||
| Mucous adenocarcinoma | 13 (22.42) | 7 (18.92) | ||
| Signet ring cell | 7 (12.07) | 7 (18.92) | ||
| Anaplastic | 2 (3.45) | 0 (0.00) | ||
| The degree of differentiation | 4.250 | 0.039 | ||
| Poorly differentiated | 28 (48.28) | 10 (27.03) | ||
| Medium to high differentiation | 30 (51.72) | 27 (72.97) | ||
| Operation method | 2.657 | 0.103 | ||
| ESD | 23 (39.66) | 21 (56.76) | ||
| Gastrectomy | 35 (60.34) | 16 (43.24) | ||
| Hospital stay time (d) | 11.57 ± 2.84 | 9. 54 ± 2.40 | 3.599 | < 0.05 |
| OS (m) | 23.62 ± 4.86 | 30.68 ± 4.40 | 7.149 | < 0.05 |
| Mortality rate | 12 (20.69) | 3 (8.11) | 2.689 | 0.101 |
| Characteristics | Univariate analysis | Multivariate analysis | ||
| Hazard ratio (95%CI) | P value | Hazard ratio (95%CI) | P value | |
| Age | 1.009 (0.962-1.059) | 0.703 | ||
| Gender | 1.636 (0.582-4.599) | 0.351 | ||
| BMI | 0.882 (0.707-1.100) | 0.265 | ||
| H. pylori infection | 1.069 (0.301-3.788) | 0.918 | ||
| Hypertension | 1.504 (0.514-4.402) | 0.456 | ||
| Diabetes | 1.785 (0.567-5.622) | 0.322 | ||
| Coronary heart disease | 1.831 (0.652-5.147) | 0.251 | ||
| Tumor location | 1.391 (0.700-2.764) | 0.346 | ||
| Vascular invasion | 15.876 (5.324-47.336) | 0.001 | 2.056 (0.363-11.649) | 0.415 |
| T stage (T1+T2 vs T3+T4) | 3.929 (2.230-6.923) | 0.001 | 1.390 (0.594-3.250) | 0.448 |
| N stage (N0 vs N1+N2+N3) | 3.005 (1.909-4.729) | 0.001 | 0.811 (0.308-2.134) | 0.671 |
| M stage (M0 vs M1) | 11.511 (4.053-32.695) | 0.001 | 0.467 (0.055-3.970) | 0.486 |
| TNM stage (I+II vs III+IV) | 3.069 (1.995-4.721) | 0.001 | 3.686 (0.721-18. 840) | 0.117 |
| Histological type | 1.529 (0.935-2.499) | 0.091 | ||
| The degree of differentiation | 0.733 (0.250-2.144) | 0.570 | ||
| Operation method | 6.773 (2.192-9. 336) | 0.007 | 1.670 (0.102-17.243) | 0.719 |
| Hospital stay time | 1.279 (1.084-1.508) | 0.004 | 0.996 (0.782-1.268) | 0.973 |
| EPAS1 | 2.193 (1.191-4.039) | 0.012 | 2.095 (1.019-4.307) | 0.044 |
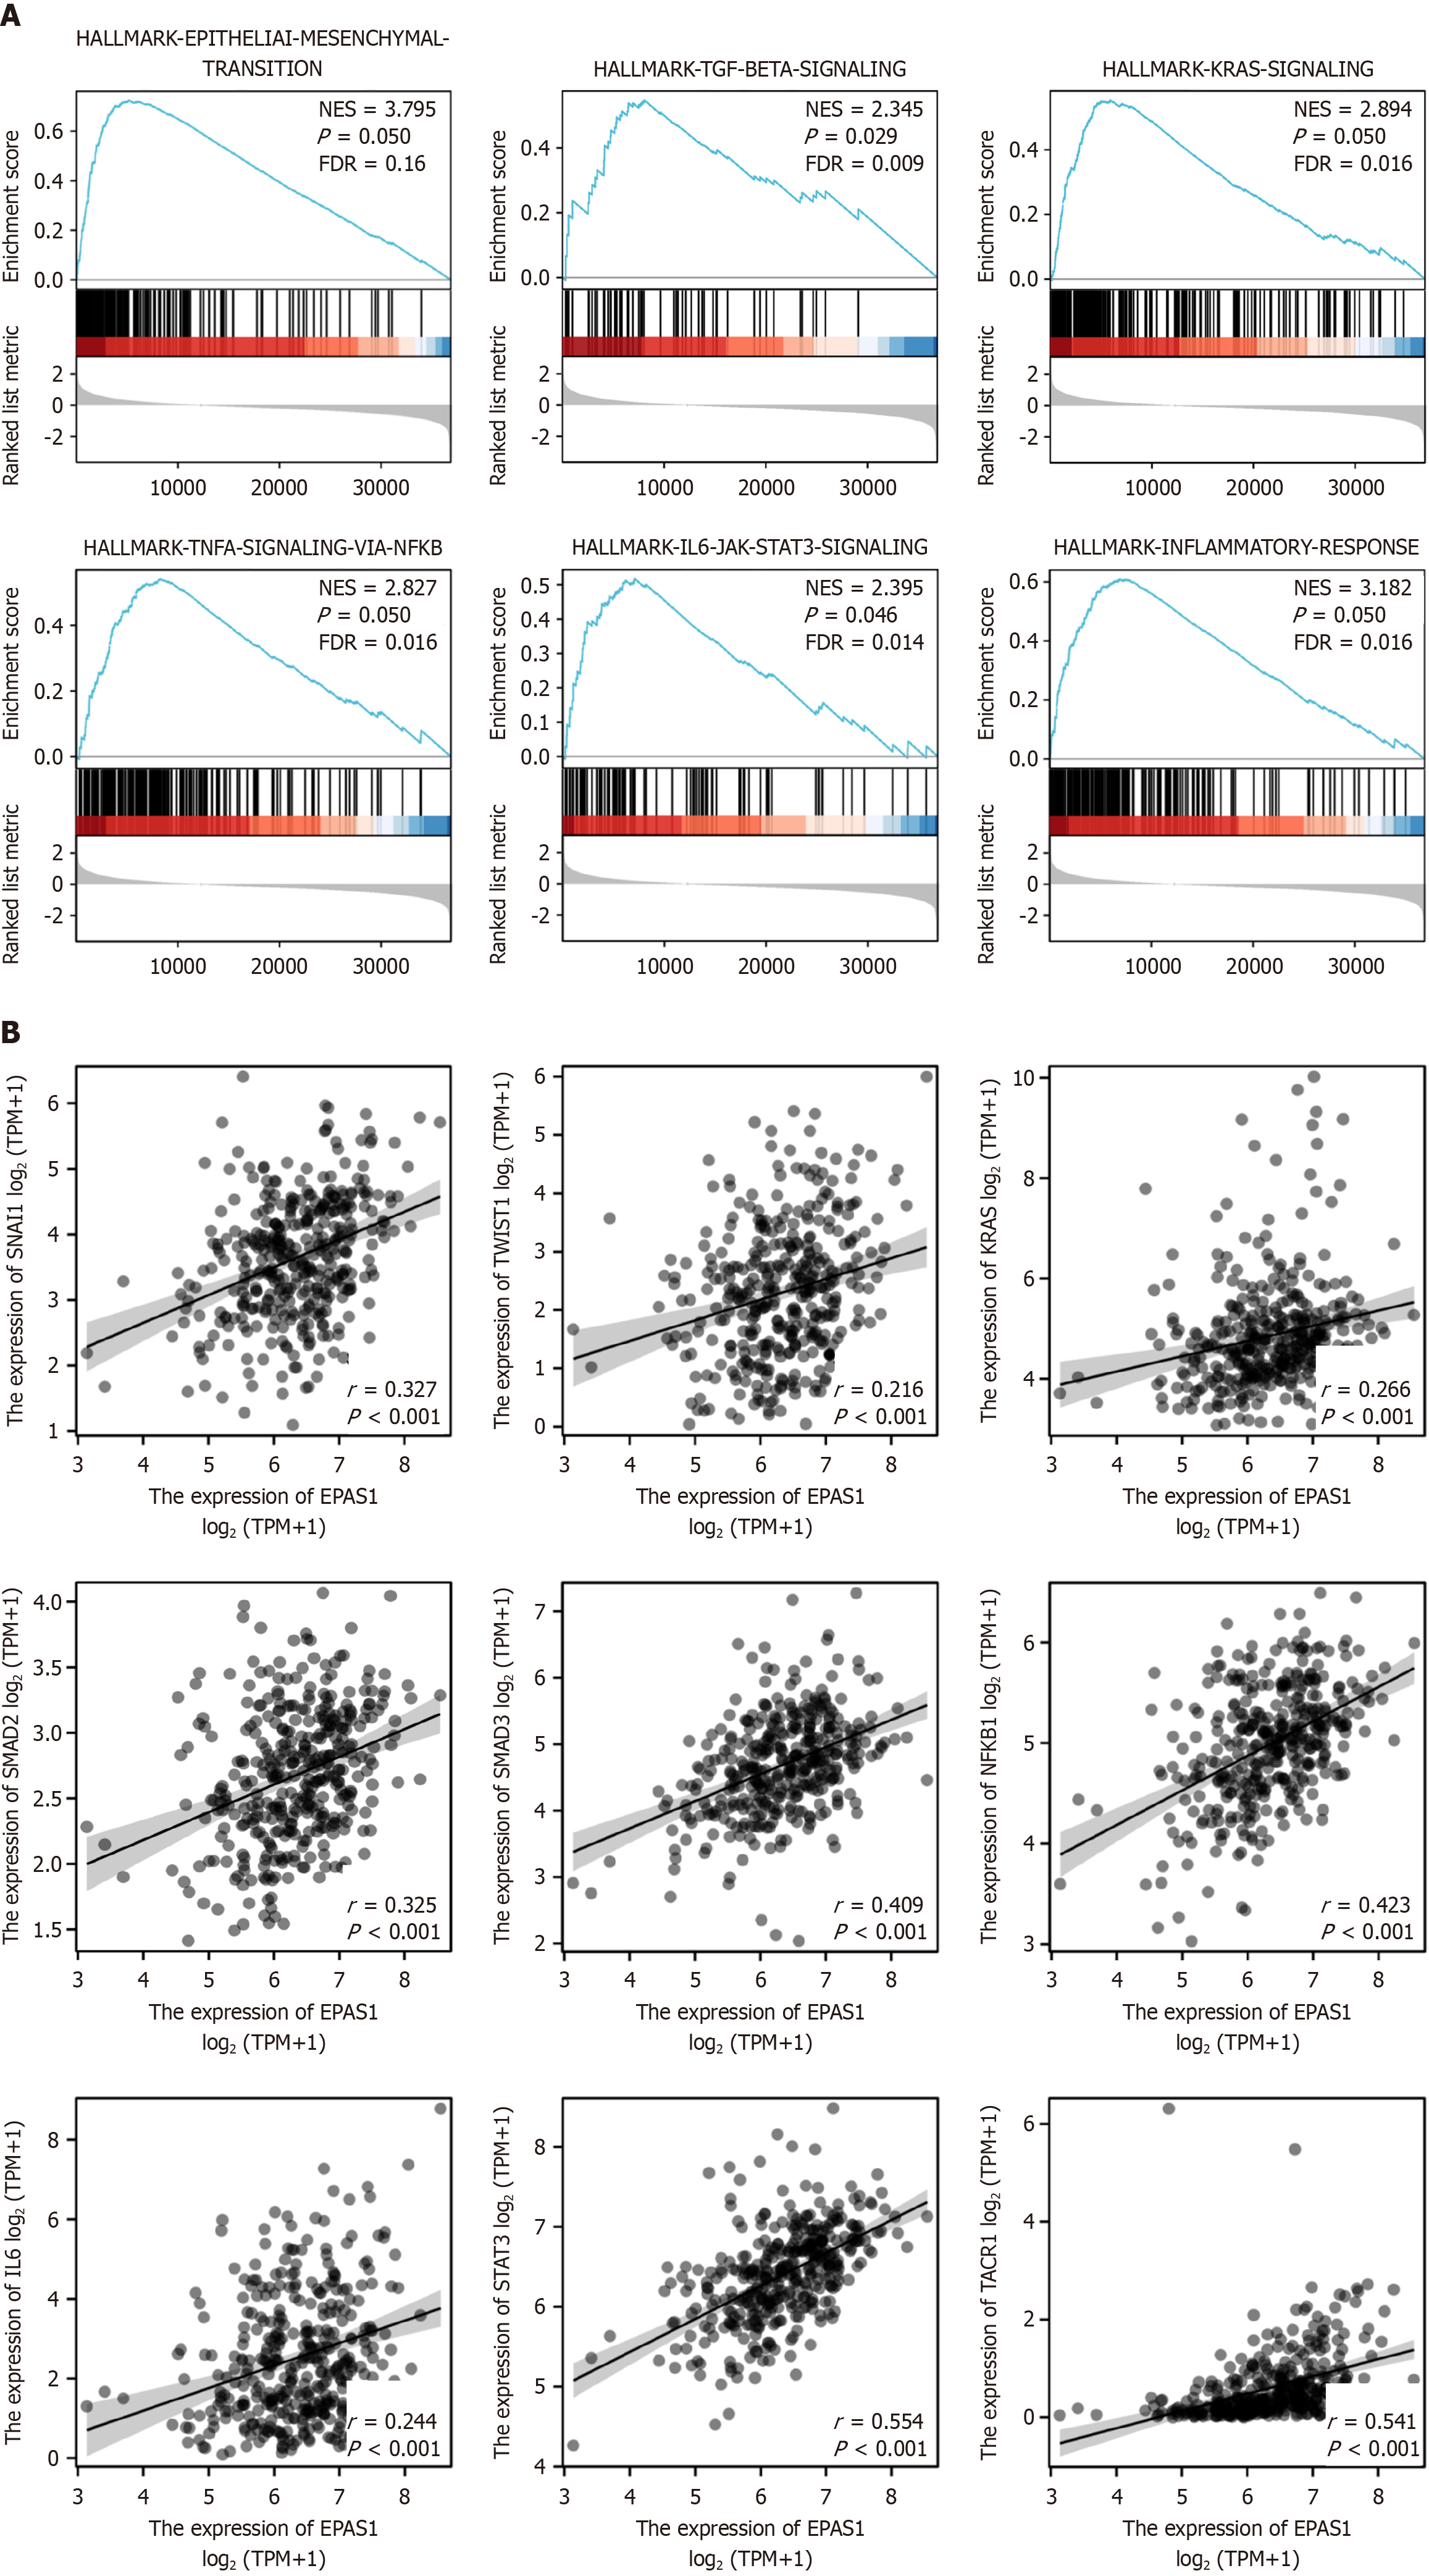
High EPAS1 gene expression in GC was enriched mainly in the EMT, inflammatory response, KRAS, TGF-β, TNF-α/NF-kB, and IL6/JAK/STAT3 signaling pathways (FDR < 0.25 and adjusted P < 0.05) (Figure 3 and Table 3). In addition, the results of the molecular correlation analysis revealed that EPAS1 expression was positively correlated with the EMT pathway-related molecules SNAIL1 and TWIST1 (r = 0.327, 0.216, P < 0.05) as well as KRAS, TACR1, SMAD2, SMAD3, and NF-kB (r = 0.266, 0.541, 0.325, 0.409, 0.423, P < 0.05) and the IL6/JAK/STAT3 signaling pathway molecules IL6 and STAT3 (r = 0.244, 0.554, P < 0.05) (Figure 3).
| Description | Set size | Enrichment score | Normalized enrichment score | P adjust |
| EPITHELIAL_MESENCHYMAL_TRANSITION | 200 | 0.73 | 3.79 | 0.050 |
| INFLAMMATORY_RESPONSE | 199 | 0.61 | 3.18 | 0.050 |
| KRAS_SIGNALING_UP | 200 | 0.55 | 2.89 | 0.050 |
| TGF_BETA_SIGNALING | 54 | 0.55 | 2.35 | 0.029 |
| TNFA_SIGNALING_VIA_NFKB | 200 | 0.54 | 2.83 | 0.050 |
| IL6_JAK_STAT3_SIGNALING | 87 | 0.52 | 2.39 | 0.050 |
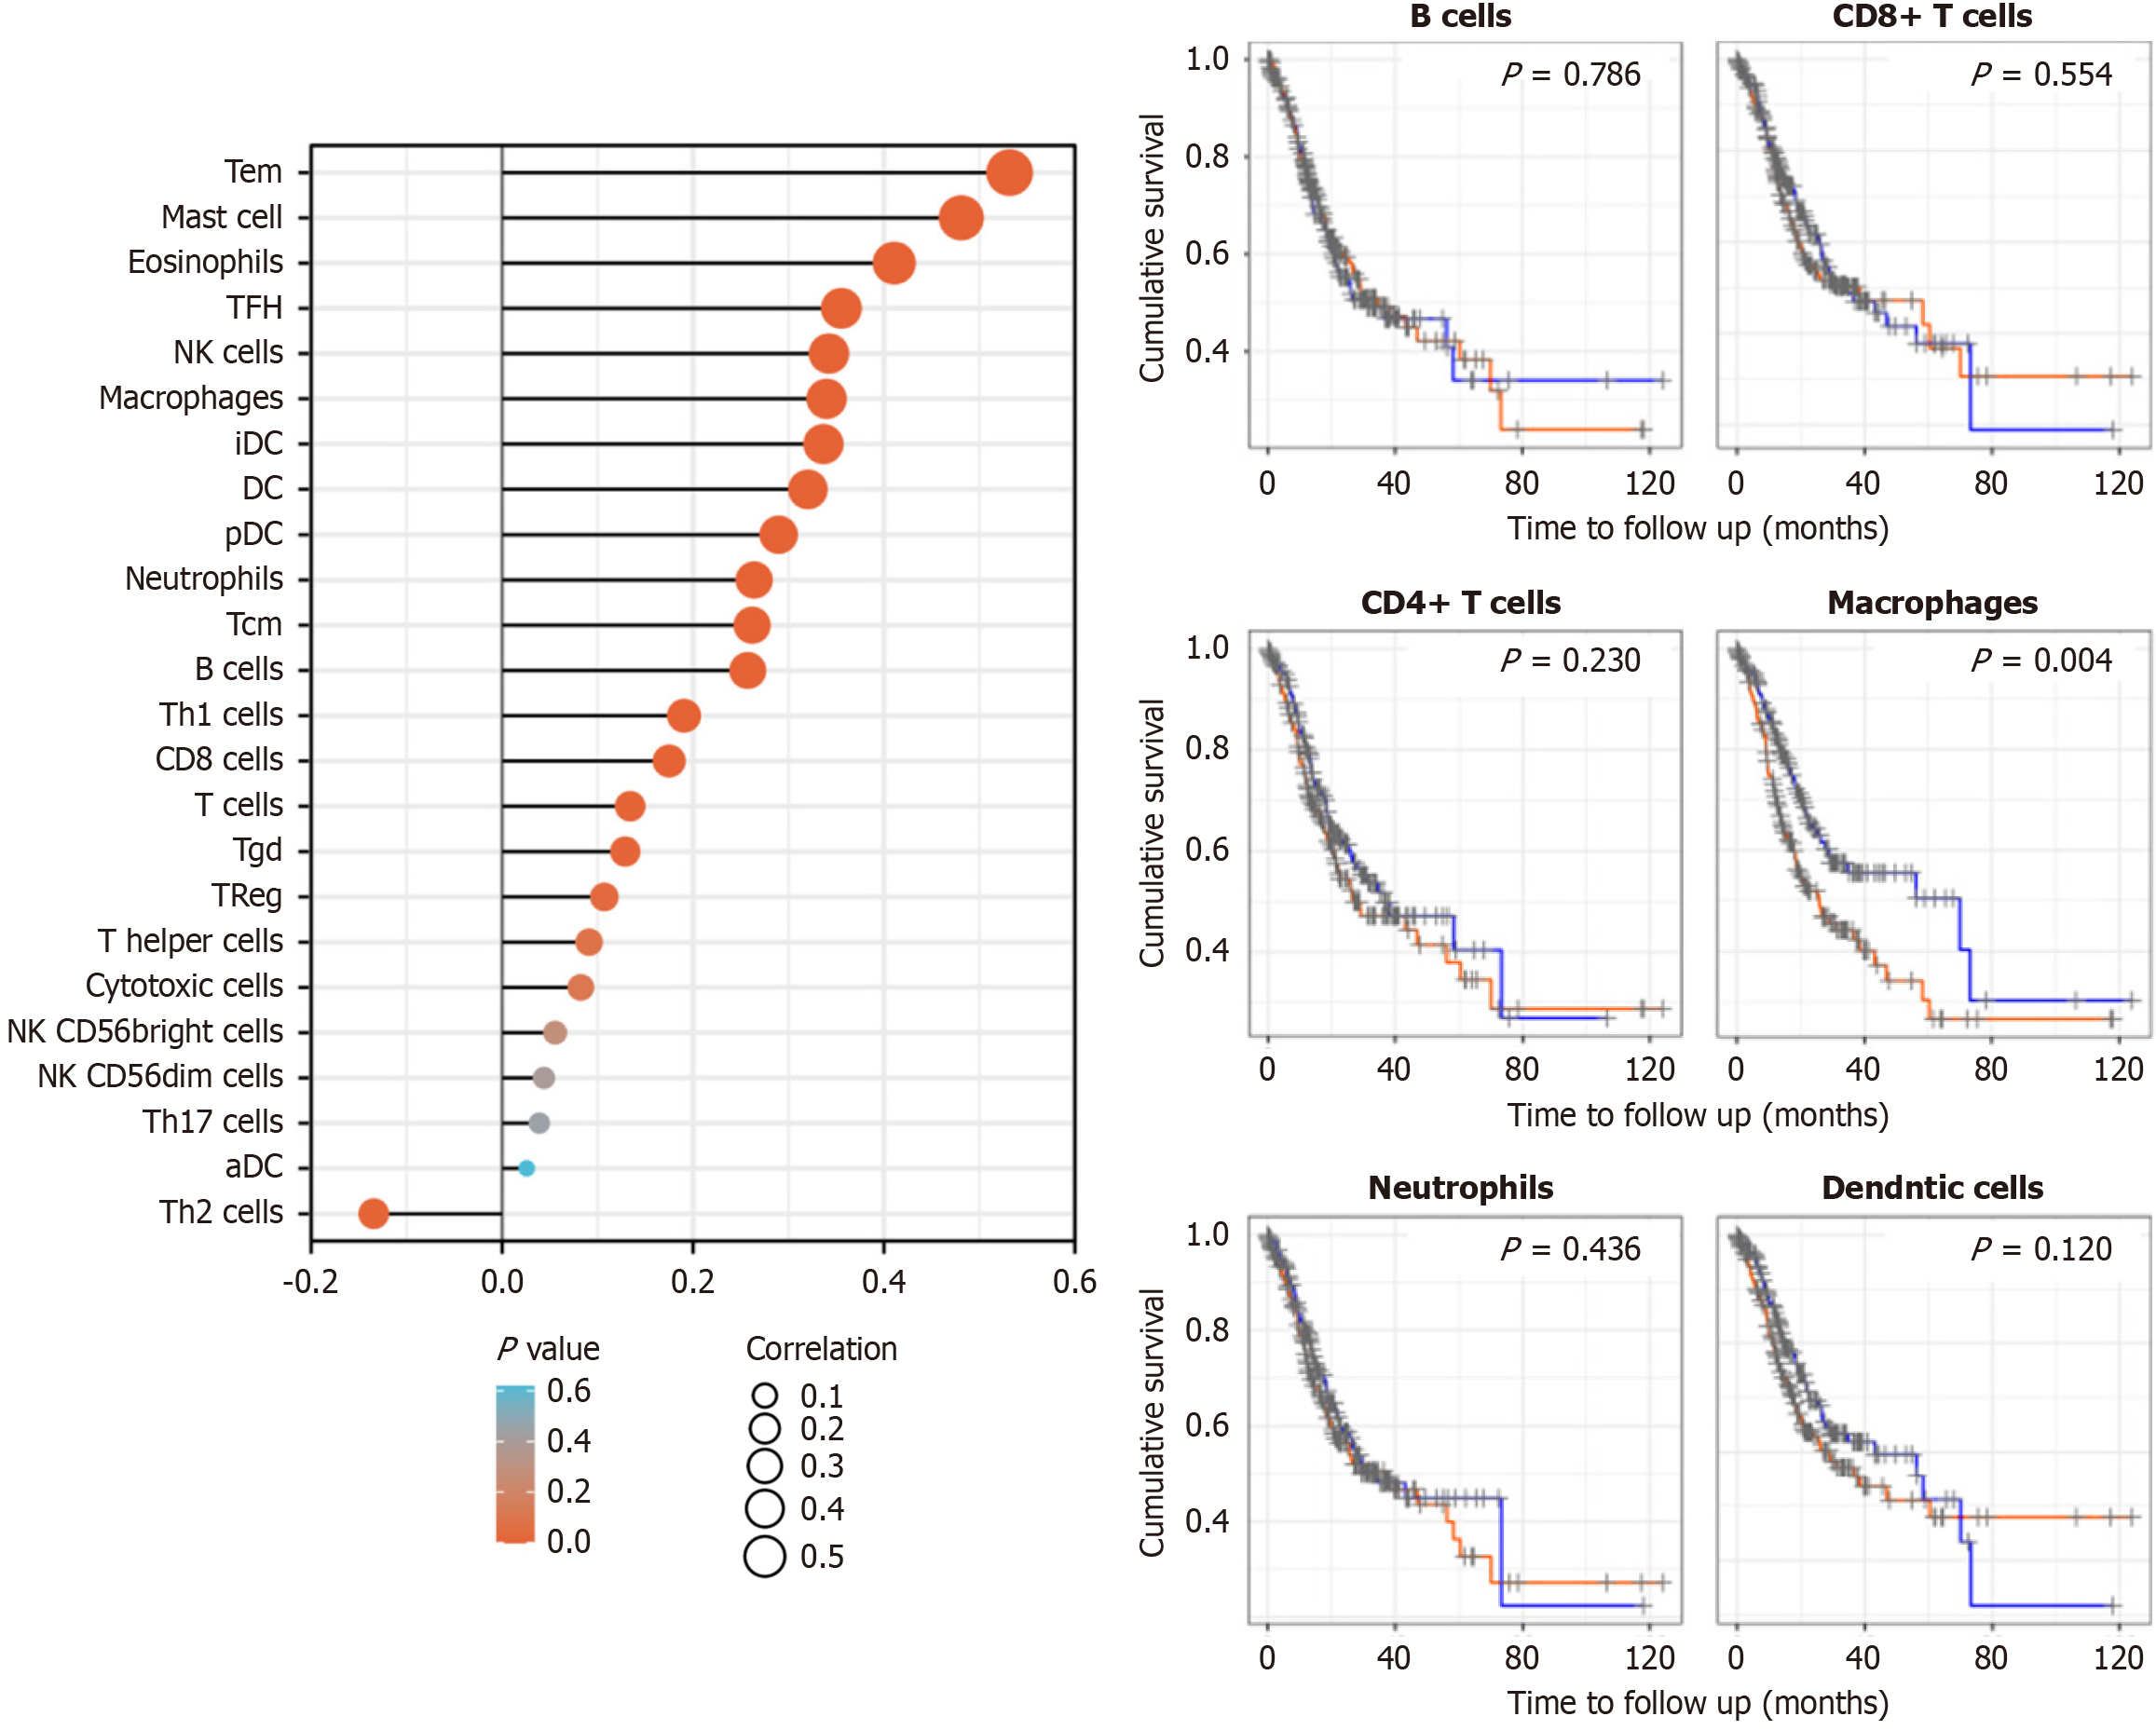
EPAS1 interacts with Tem cells, mast cells, eosinophils, follicular helper T cells, natural killer (NK) cells, macrophages, immature dendritic cells and dendritic cells (DCs) and is positively correlated with the infiltration of these cells (r = 0.532, 0.481, 0.411, 0.355, 0.342, 0.340, 0.337, 0.320, P < 0.05) (Figure 4).
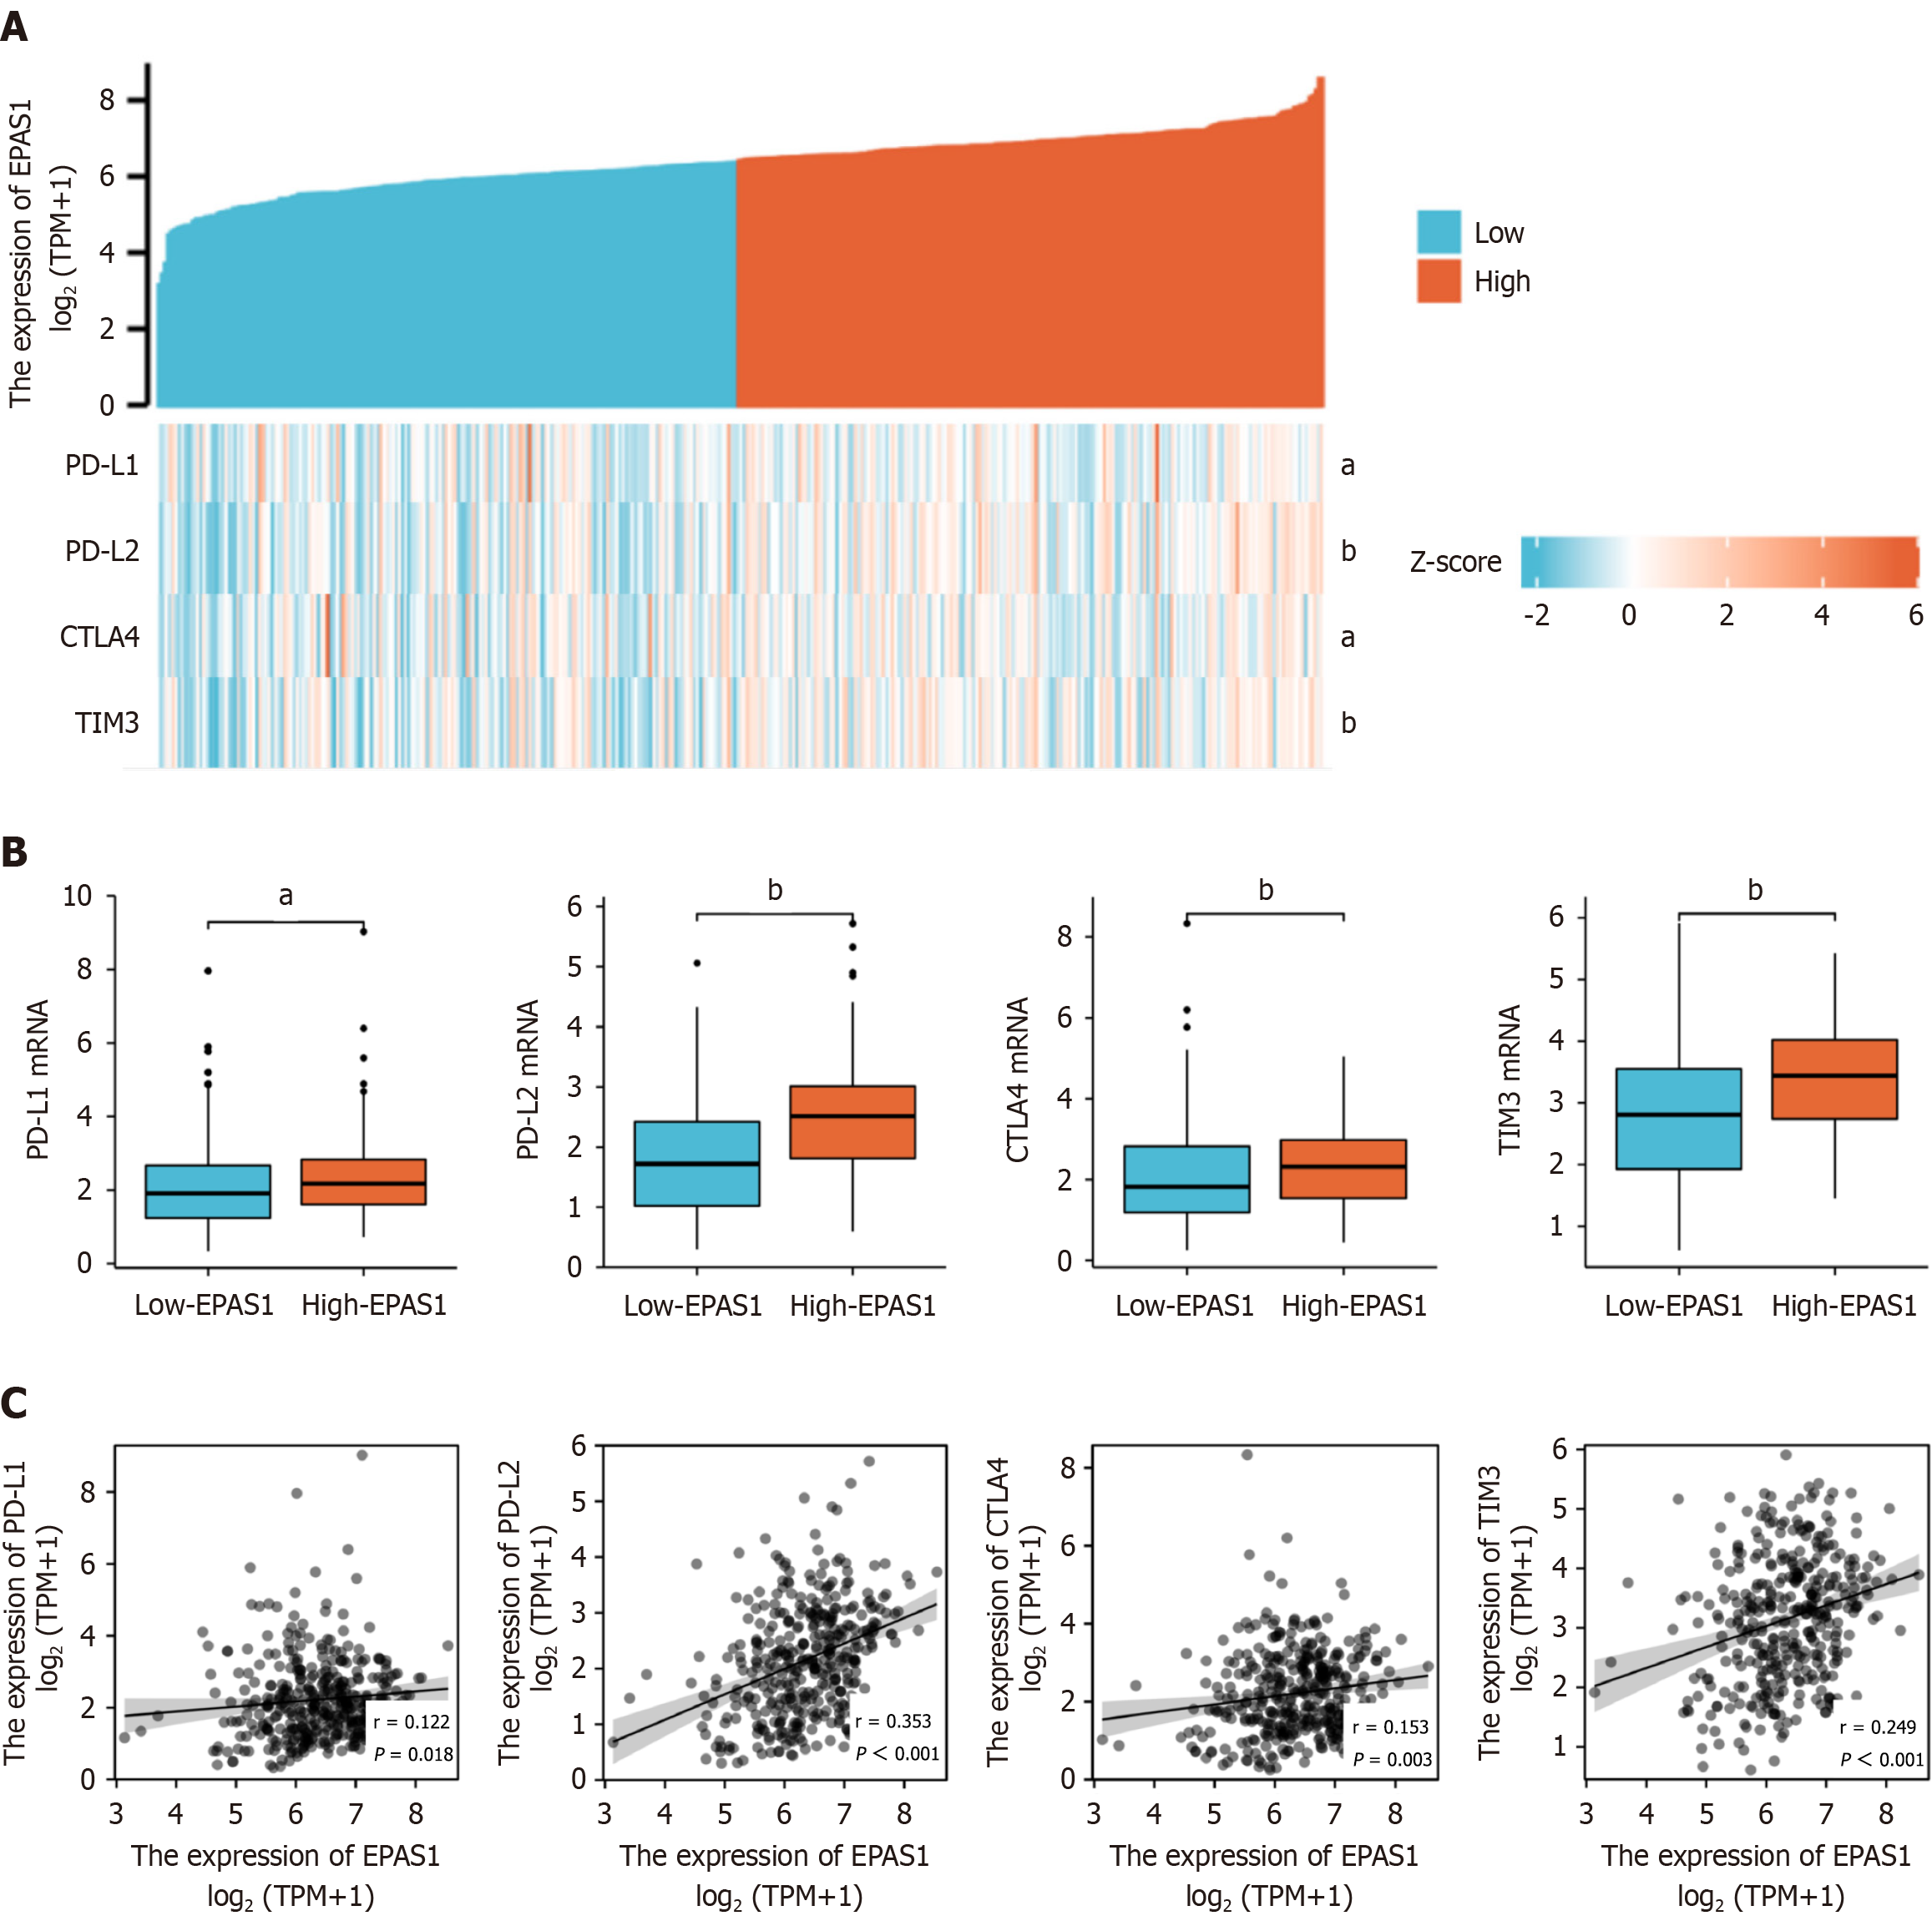
The expression levels of immunotherapy checkpoints, such as PD-L1, PD-L2, CTLA4 and TIM3, were considerably greater in the high EPAS1 expression group than in the low EPAS1 expression group, and EPAS1 was closely related to immunotherapy checkpoints, such as PD-L1, PD-L2, CTLA4 and TIM3. The genes were all positively correlated (r = 0.122, 0.353, 0.153, 0.249), and the heatmaps and correlations are shown in Figure 5.
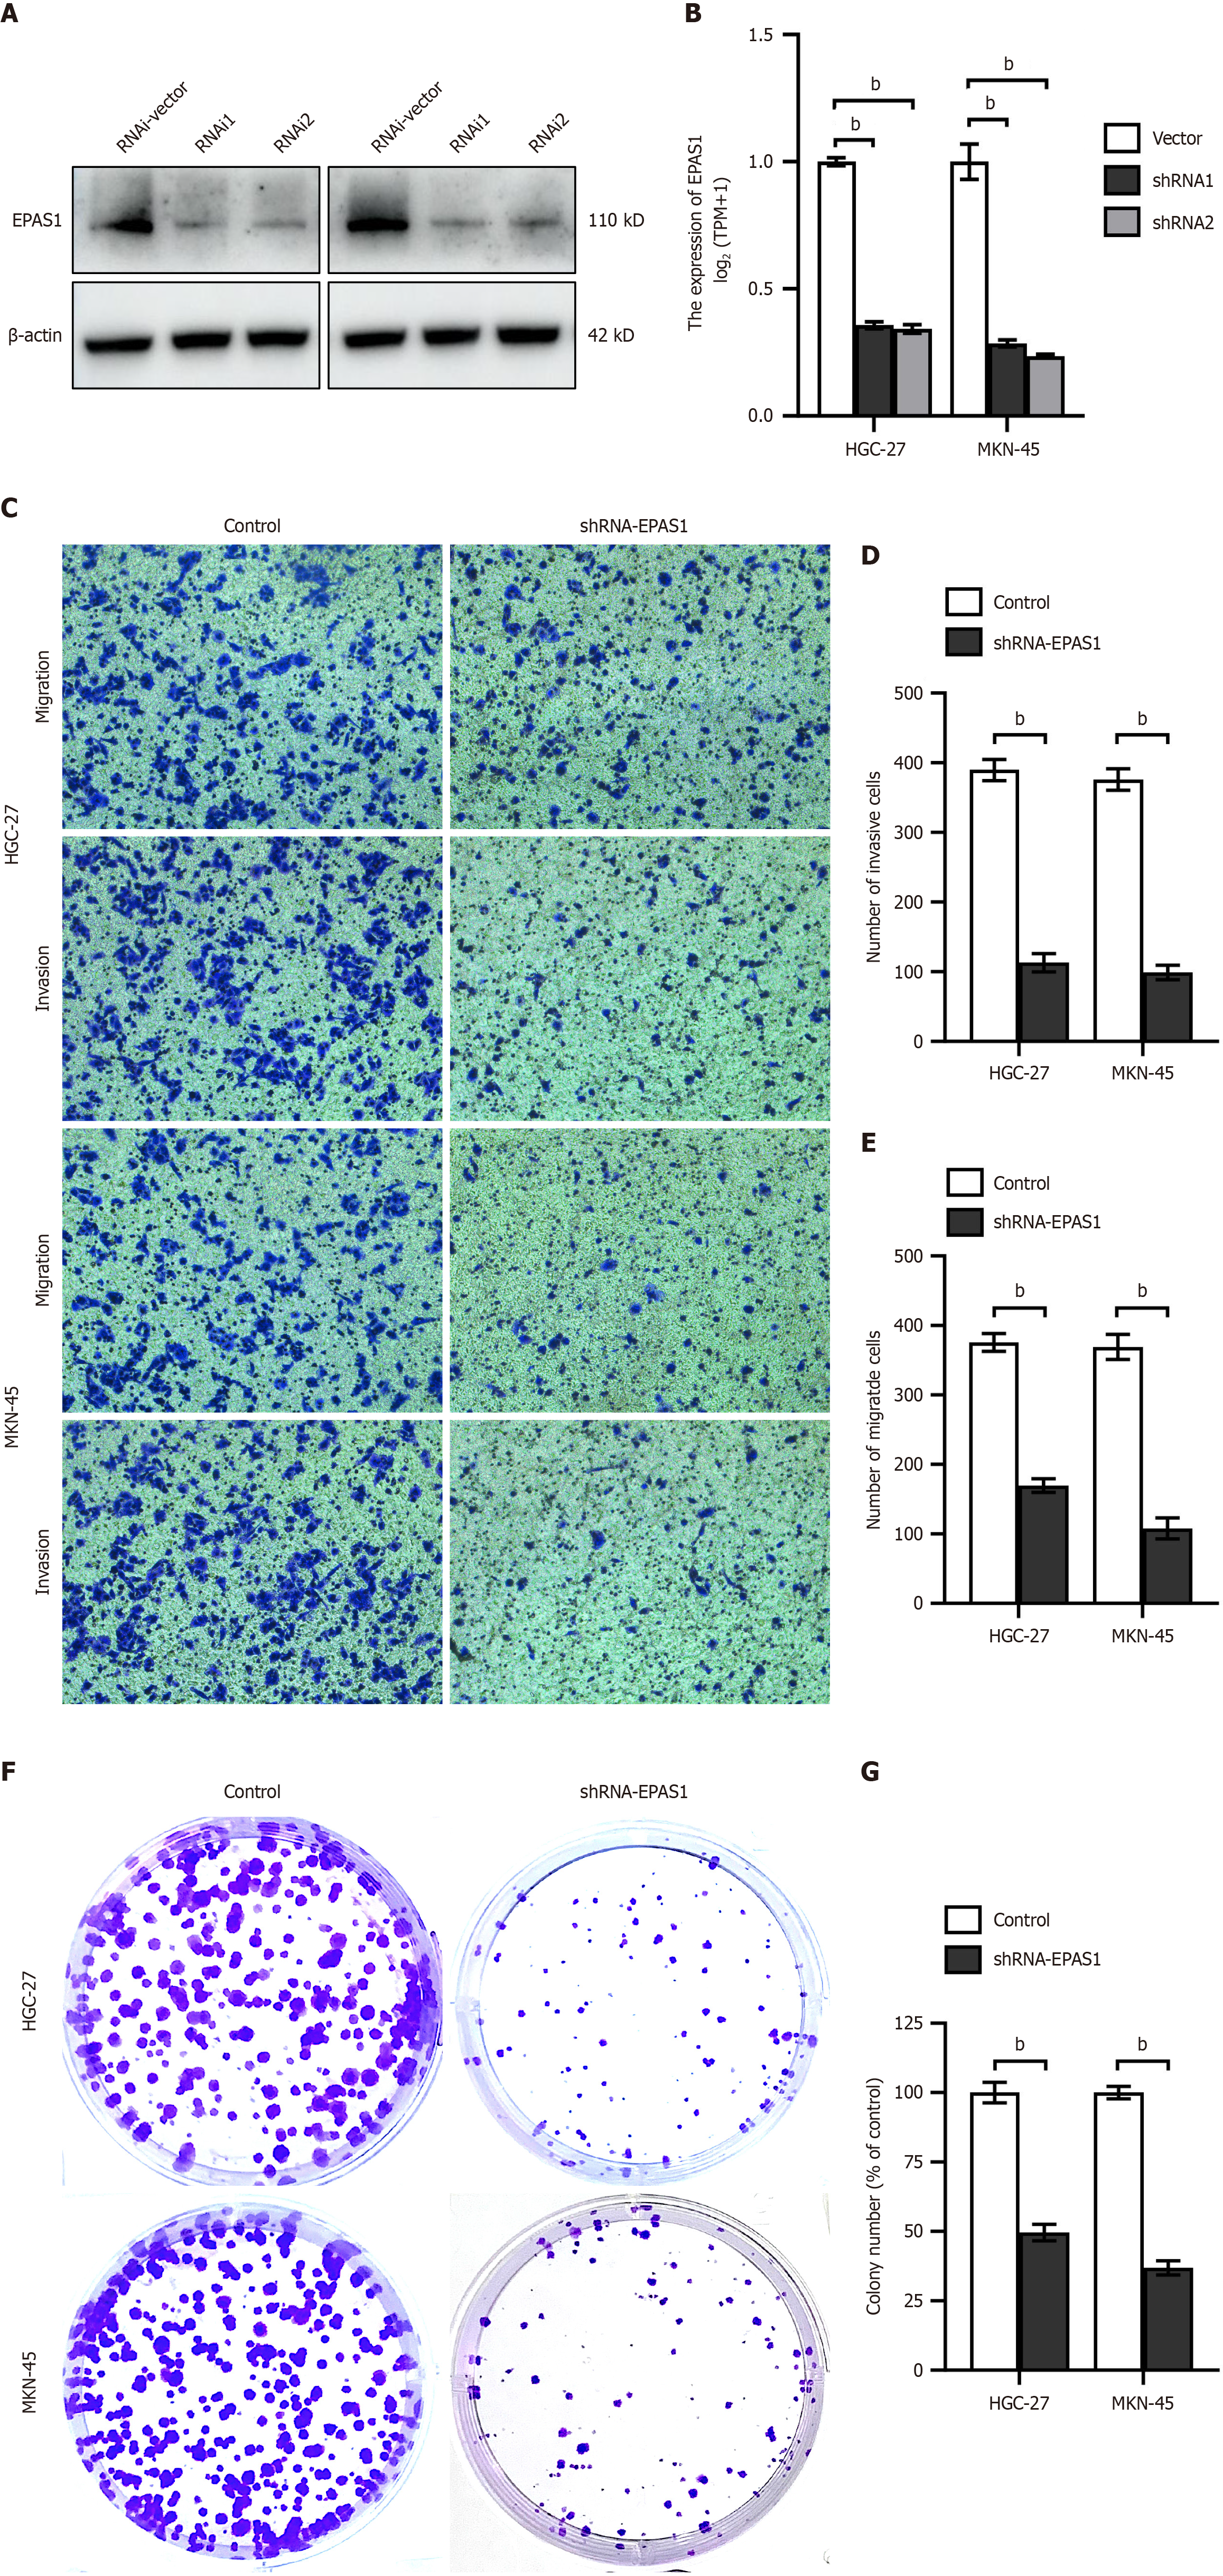
EPAS1 expression was significantly reduced in HGC27 and MKN45 cells following transfection with shRNA-EPAS1 (Figure 6A and B). Invasion and migration assays (Figure 6C-E) as well as colony formation assays (Figure 6F and G) demonstrated a marked decrease in the proliferation and invasive ability of HGC27 and MKN45 cells after shRNA-EPAS1 transfection.
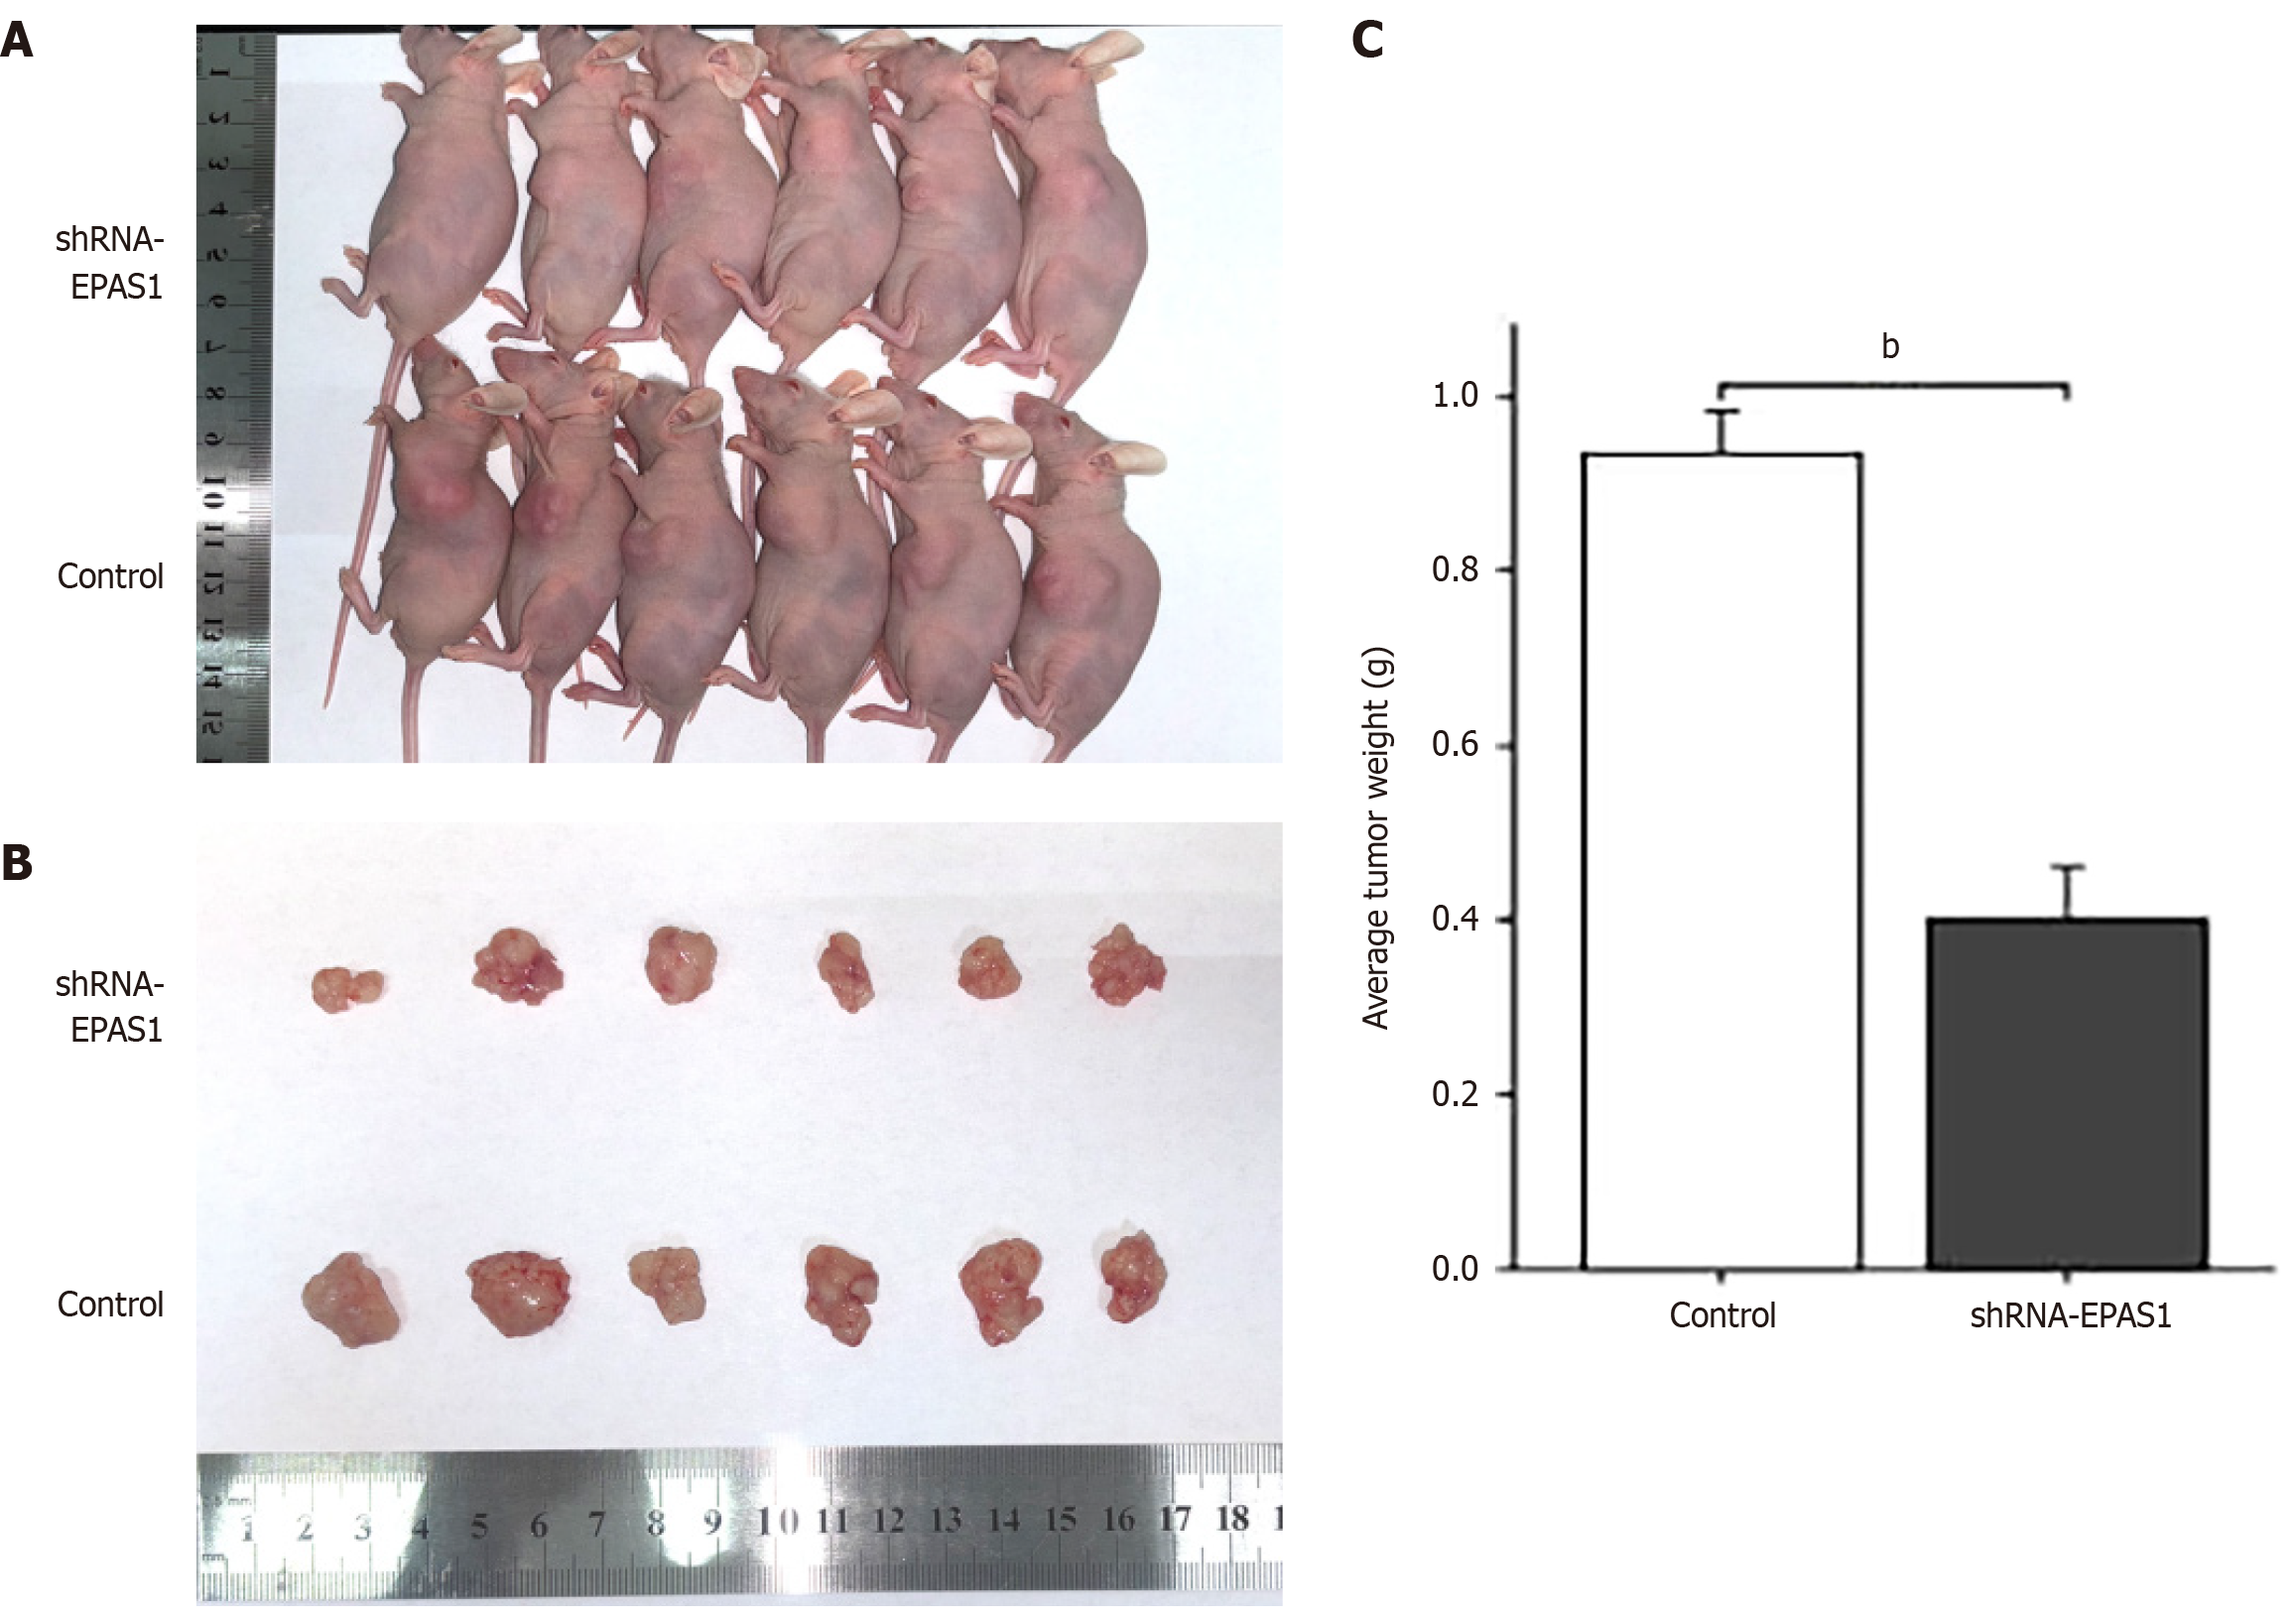
To confirm that EPAS1 inhibition reduces the proliferation of GC cells, nude mice were injected with either shRNA-EPAS1-transfected HGC27 cells or untransfected HGC27 cells. The results revealed a significant reduction in the subcutaneous tumor volume and a decreased tumor weight in the shRNA-EPAS1 group (Figure 7).
HIF, a transcriptional complex that works as a master regulator of oxygen homeostasis, may influence the tumor response to hypoxia via the transcriptional activation of numerous genes[8]. EPAS1 plays a critical role in the cellular response to chronic hypoxia, not only by engaging in iron metabolism but also by regulating glycolytic enzymes and glucose transporters, which help reduce oxygen consumption[9]. Although recent studies have shown that EPAS1 plays a role in the development of digestive tract tumors, the specific mechanism has not been elucidated[10]. Thus, in this study, we investigated the role of EPAS1 in the development and progression of GC by examining EPAS1 expression and its relationship with prognosis and immunological checkpoints.
EPAS1 is expressed in only specific tissue types, such as endothelial cells or tumor cells, unlike HIF-1, which is ubiquitously expressed in all cells[11,12]. Here, the TCGA database was utilized to determine EPAS1 expression in GC tissue. EPAS1 expression was upregulated in GC tissue compared with normal gastric mucosa tissue, which was confirmed by immunohistochemical (IHC) analysis of clinical samples. IHC staining revealed that EPAS1 expression was predominantly observed in the nucleus and cytoplasm. Consistent with our results, previous studies have confirmed that EPAS1 is found primarily in the nucleus or cytoplasm. It stabilizes the protein, translocates it to the nucleus, forms a heterodimer with HIF-1, and contacts the hypoxia response element inside the target gene regulatory element[13].
Our integrative analysis of TCGA data and clinical data revealed that elevated EPAS1 expression is significantly associated with poor prognosis in patients with GC, suggesting its potential as a prognostic biomarker for this aggressive malignancy. These findings align with prior studies demonstrating the oncogenic role of EPAS1 across diverse cancers, where the overexpression of its mRNA and protein correlates with disease progression and reduced survival[14,15]. EPAS1, a key transcriptional regulator of the HIF pathway, is induced under hypoxic conditions. Tumor cell proliferation creates a hypoxic niche, triggering EPAS1 activation to coordinate adaptive responses such as metabolic reprogramming and EMT[16]. Previous studies suggest that EPAS1 recruits transcriptional coactivators, including SP1, to drive target gene expression and induce transcription[17]. Consistent with the protumorigenic functions of EPAS1, our correlative analysis revealed that high EPAS1 expression in GC was significantly associated with advanced tumor infiltration depth and poor differentiation of primary lesions. Although the role of EPAS1 in GC growth and differentiation is unknown, hypoxia has been linked to the formation of an immunosuppressive microenvironment. Increased infiltration of tumor-associated macrophages and tumor-associated fibroblasts in hypoxic tumor areas results in tumor cell proliferation and deep infiltration through immune evasion[18]. Therefore, hypoxia is closely related to the depth of tumor invasion and differentiation.
To elucidate the potential mechanisms underlying the oncogenic role of EPAS1 in GC, we performed GSEA on the basis of EPAS1 expression levels. Our results revealed that EPAS1 expression was significantly associated with EMT, the inflammatory response, and the activation of the KRAS, TGF-β, TNF-α/NF-κB, and IL6/JAK/STAT3 signaling pathways. Hypoxia is a prominent feature of the tumor microenvironment, which activates EPAS1 to drive adaptive responses via direct transcriptional regulation of key EMT transcription factors, such as Twist and Snail, thereby increasing tumor cell invasiveness and metastatic potential[19]. In addition to promoting EMT, EPAS1 may also amplify angiogenic mimicry through Twist1-mediated upregulation of VE-cadherin expression, a critical step in tumor vascularization[20]. Moreover, EPAS1 activation in tumor tissues aggravates local inflammation by increasing the secretion of proinflammatory cytokines (such as TNF-α and IL-6), which in turn amplifies the NF-κB and JAK/STAT3 signaling cascades[21]. This creates a feedforward loop: EPAS1-driven cytokine release recruits T lymphocytes, further activating STAT3 and sustaining a protumorigenic inflammatory milieu. This cross-interference among hypoxia, EMT, and inflammation is consistent with our GSEA findings and may explain how EPAS1 sustains GC growth in a hypoxic niche.
In addition, immune cell infiltration correlation analysis indicated that EPAS1 was positively correlated with various immune cells. As a stromal component of the inflammatory milieu that influences tumor formation, immune cells play a vital role in maintaining normal tissue homeostasis or driving tumor progression[22]. Studies have revealed that intratumoral hypoxia increases EPAS1 expression and attracts numerous immune cells following tumor invasion. Monocytes become tumor-associated macrophages and aggregate in hypoxic areas, inducing HIF transcriptional alterations[23]. Mast cells and eosinophils collaborate to promote GC tumor growth by producing angiogenic (VEGF-A, CXCL8, and MMP-9) and lymphangiogenic components (VEGF-C and VEGF-F)[24]. Tumor-infiltrating lymphocytes, including T cells, B cells, and NK cells, are found in tumor tissue and are linked to immunological checkpoint expression[25]. EPAS1 expression reduces CD8+ T-cell and NK-cell infiltration and cytotoxic activity while increasing regulatory T-cell (Treg) infiltration and immunosuppressive activity[26]. By linking EPAS1 to hypoxia-driven immune suppression, this study advances our understanding of GC progression.
The tumor microenvironment is characterized by an immunosuppressive mechanism that enables malignant cells to evade immune surveillance, and the activation of immune checkpoints represents a key evasion strategy[27]. Immune checkpoint blockade therapy targeting PD-1 and its ligands (PD-L1) has demonstrated therapeutic efficacy across multiple solid tumor types and is being actively investigated in the context of GC management[28]. In this study, we found that there was a significant correlation between the expression level of EPAS1 and the expression of immune inhibitory checkpoint molecules (including PD-L1, PD-L2, CTLA4 and TIM3). Compared with the low EPAS1 expression group, the high EPAS1 expression group presented markedly elevated levels of these immune checkpoint regulators. EPAS1 may transcriptionally upregulate PD-L1 expression through direct binding to hypoxia response elements within the PD-L1 promoter region, as previously described[29]. Moreover, HIF inhibition could enhance the responsiveness to PD-1/PD-L1 blockade therapies. The established association between EPAS1 and PD-1/PD-L1 expression patterns not only clarifies a potential mechanism of immune checkpoint inhibitor resistance but also provides a convincing theoretical basis for exploring strategies targeting EPAS1 as a combined therapy to increase the efficacy of immune checkpoint blockade therapy in GC treatment. There are several drawbacks to this research. First, the results were derived from pan cancer datasets (TCGA database) rather than being specifically tailored to GC-related clinical data. The dedicated GC clinical data should be analyzed in the future to strengthen the specificity of our conclusions. Second, further research is needed to determine whether EPAS1 modulates EMT pathways directly or indirectly and to elucidate the molecular processes involved. Third, migration and invasion capabilities must be confirmed in animal models of metastasis in vivo.
In conclusion, our findings suggest that EPAS1 may be a prognostic marker in patients with GC and may promote tumor growth through an immune response via the EMT, inflammatory response, KRAS, TGF, TNF-/NF-kB, and IL6/JAK/STAT3 signaling pathways.
| 1. | Yasuda T, Wang YA. Gastric cancer immunosuppressive microenvironment heterogeneity: implications for therapy development. Trends Cancer. 2024;10:627-642. [RCA] [PubMed] [DOI] [Full Text] [Cited by in Crossref: 1] [Cited by in RCA: 117] [Article Influence: 58.5] [Reference Citation Analysis (0)] |
| 2. | Sung H, Ferlay J, Siegel RL, Laversanne M, Soerjomataram I, Jemal A, Bray F. Global Cancer Statistics 2020: GLOBOCAN Estimates of Incidence and Mortality Worldwide for 36 Cancers in 185 Countries. CA Cancer J Clin. 2021;71:209-249. [RCA] [PubMed] [DOI] [Full Text] [Cited by in Crossref: 75126] [Cited by in RCA: 68439] [Article Influence: 13687.8] [Reference Citation Analysis (201)] |
| 3. | Li Q, Zeng K, Chen Q, Han C, Wang X, Li B, Miao J, Zheng B, Liu J, Yuan X, Liu B. Atractylenolide I inhibits angiogenesis and reverses sunitinib resistance in clear cell renal cell carcinoma through ATP6V0D2-mediated autophagic degradation of EPAS1/HIF2α. Autophagy. 2025;21:619-638. [RCA] [PubMed] [DOI] [Full Text] [Cited by in Crossref: 2] [Cited by in RCA: 17] [Article Influence: 17.0] [Reference Citation Analysis (0)] |
| 4. | Lin Z, Song J, Gao Y, Huang S, Dou R, Zhong P, Huang G, Han L, Zheng J, Zhang X, Wang S, Xiong B. Hypoxia-induced HIF-1α/lncRNA-PMAN inhibits ferroptosis by promoting the cytoplasmic translocation of ELAVL1 in peritoneal dissemination from gastric cancer. Redox Biol. 2022;52:102312. [RCA] [PubMed] [DOI] [Full Text] [Full Text (PDF)] [Cited by in Crossref: 7] [Cited by in RCA: 191] [Article Influence: 47.8] [Reference Citation Analysis (0)] |
| 5. | Sun R, Sun C, Yue Z, Yin G, Zhou L, Zhang S, Zhang Y, Tang D, Tan X. Astragali Radix-Curcumae Rhizoma herb pair reduces the stemness of colorectal cancer cells through HIF-2α/β-catenin pathway. Phytomedicine. 2024;132:155824. [RCA] [PubMed] [DOI] [Full Text] [Cited by in Crossref: 1] [Cited by in RCA: 12] [Article Influence: 6.0] [Reference Citation Analysis (0)] |
| 6. | Lin JX, Desiderio J, Lin JP, Wang W, Tu RH, Li P, Xie JW, Wang JB, Lu J, Chen QY, Cao LL, Lin M, Zheng CH, Zhou ZW, Parisi A, Huang CM. Multicenter Validation Study of the American Joint Commission on Cancer (8th Edition) for Gastric Cancer: Proposal for a Simplified and Improved TNM Staging System. J Cancer. 2020;11:3483-3491. [RCA] [PubMed] [DOI] [Full Text] [Full Text (PDF)] [Cited by in Crossref: 15] [Cited by in RCA: 18] [Article Influence: 3.0] [Reference Citation Analysis (1)] |
| 7. | Hu Q, Qin Y, Xiang J, Liu W, Xu W, Sun Q, Ji S, Liu J, Zhang Z, Ni Q, Xu J, Yu X, Zhang B. dCK negatively regulates the NRF2/ARE axis and ROS production in pancreatic cancer. Cell Prolif. 2018;51:e12456. [RCA] [PubMed] [DOI] [Full Text] [Full Text (PDF)] [Cited by in Crossref: 27] [Cited by in RCA: 29] [Article Influence: 3.6] [Reference Citation Analysis (0)] |
| 8. | Slemc L, Kunej T. Transcription factor HIF1A: downstream targets, associated pathways, polymorphic hypoxia response element (HRE) sites, and initiative for standardization of reporting in scientific literature. Tumour Biol. 2016;37:14851-14861. [RCA] [PubMed] [DOI] [Full Text] [Cited by in Crossref: 47] [Cited by in RCA: 73] [Article Influence: 7.3] [Reference Citation Analysis (0)] |
| 9. | Lee FS. At the crossroads of oxygen and iron sensing: hepcidin control of HIF-2α. J Clin Invest. 2019;129:72-74. [RCA] [PubMed] [DOI] [Full Text] [Cited by in Crossref: 5] [Cited by in RCA: 11] [Article Influence: 1.4] [Reference Citation Analysis (0)] |
| 10. | Han S, Huang T, Li W, Liu S, Yang W, Shi Q, Li H, Ren J, Hou F. Association Between Hypoxia-Inducible Factor-2α (HIF-2α) Expression and Colorectal Cancer and Its Prognostic Role: a Systematic Analysis. Cell Physiol Biochem. 2018;48:516-527. [RCA] [PubMed] [DOI] [Full Text] [Cited by in Crossref: 14] [Cited by in RCA: 19] [Article Influence: 2.4] [Reference Citation Analysis (0)] |
| 11. | Majmundar AJ, Wong WJ, Simon MC. Hypoxia-inducible factors and the response to hypoxic stress. Mol Cell. 2010;40:294-309. [RCA] [PubMed] [DOI] [Full Text] [Full Text (PDF)] [Cited by in Crossref: 1923] [Cited by in RCA: 1873] [Article Influence: 117.1] [Reference Citation Analysis (0)] |
| 12. | Wang Z, Wei Y, Zhang R, Su L, Gogarten SM, Liu G, Brennan P, Field JK, McKay JD, Lissowska J, Swiatkowska B, Janout V, Bolca C, Kontic M, Scelo G, Zaridze D, Laurie CC, Doheny KF, Pugh EK, Marosy BA, Hetrick KN, Xiao X, Pikielny C, Hung RJ, Amos CI, Lin X, Christiani DC. Multi-Omics Analysis Reveals a HIF Network and Hub Gene EPAS1 Associated with Lung Adenocarcinoma. EBioMedicine. 2018;32:93-101. [RCA] [PubMed] [DOI] [Full Text] [Full Text (PDF)] [Cited by in Crossref: 26] [Cited by in RCA: 35] [Article Influence: 4.4] [Reference Citation Analysis (0)] |
| 13. | Cowman SJ, Koh MY. Revisiting the HIF switch in the tumor and its immune microenvironment. Trends Cancer. 2022;8:28-42. [RCA] [PubMed] [DOI] [Full Text] [Cited by in Crossref: 80] [Cited by in RCA: 173] [Article Influence: 43.3] [Reference Citation Analysis (0)] |
| 14. | Gao ZJ, Wang Y, Yuan WD, Yuan JQ, Yuan K. HIF-2α not HIF-1α overexpression confers poor prognosis in non-small cell lung cancer. Tumour Biol. 2017;39:1010428317709637. [RCA] [PubMed] [DOI] [Full Text] [Cited by in Crossref: 13] [Cited by in RCA: 31] [Article Influence: 3.4] [Reference Citation Analysis (0)] |
| 15. | Cao MQ, You AB, Cui W, Zhang S, Guo ZG, Chen L, Zhu XD, Zhang W, Zhu XL, Guo H, Deng DJ, Sun HC, Zhang T. Cross talk between oxidative stress and hypoxia via thioredoxin and HIF-2α drives metastasis of hepatocellular carcinoma. FASEB J. 2020;34:5892-5905. [RCA] [PubMed] [DOI] [Full Text] [Cited by in Crossref: 12] [Cited by in RCA: 19] [Article Influence: 3.2] [Reference Citation Analysis (0)] |
| 16. | Song Y, Zhang M, Lu MM, Qu LY, Xu SG, Li YZ, Wang MY, Zhu HF, Zhang ZY, He GY, Yuan ZQ, Li N. EPAS1 targeting by miR-152-3p in Paclitaxel-resistant Breast Cancer. J Cancer. 2020;11:5822-5830. [RCA] [PubMed] [DOI] [Full Text] [Full Text (PDF)] [Cited by in Crossref: 16] [Cited by in RCA: 23] [Article Influence: 3.8] [Reference Citation Analysis (0)] |
| 17. | Yamamura K, Uruno T, Shiraishi A, Tanaka Y, Ushijima M, Nakahara T, Watanabe M, Kido-Nakahara M, Tsuge I, Furue M, Fukui Y. The transcription factor EPAS1 links DOCK8 deficiency to atopic skin inflammation via IL-31 induction. Nat Commun. 2017;8:13946. [RCA] [PubMed] [DOI] [Full Text] [Full Text (PDF)] [Cited by in Crossref: 47] [Cited by in RCA: 65] [Article Influence: 7.2] [Reference Citation Analysis (0)] |
| 18. | Xie G, Cheng T, Lin J, Zhang L, Zheng J, Liu Y, Xie G, Wang B, Yuan Y. Local angiotensin II contributes to tumor resistance to checkpoint immunotherapy. J Immunother Cancer. 2018;6:88. [RCA] [PubMed] [DOI] [Full Text] [Full Text (PDF)] [Cited by in Crossref: 23] [Cited by in RCA: 47] [Article Influence: 5.9] [Reference Citation Analysis (0)] |
| 19. | Yeo CD, Kang N, Choi SY, Kim BN, Park CK, Kim JW, Kim YK, Kim SJ. The role of hypoxia on the acquisition of epithelial-mesenchymal transition and cancer stemness: a possible link to epigenetic regulation. Korean J Intern Med. 2017;32:589-599. [RCA] [PubMed] [DOI] [Full Text] [Full Text (PDF)] [Cited by in Crossref: 66] [Cited by in RCA: 86] [Article Influence: 9.6] [Reference Citation Analysis (0)] |
| 20. | Yang J, Zhu DM, Zhou XG, Yin N, Zhang Y, Zhang ZX, Li DC, Zhou J. HIF-2α promotes the formation of vasculogenic mimicry in pancreatic cancer by regulating the binding of Twist1 to the VE-cadherin promoter. Oncotarget. 2017;8:47801-47815. [RCA] [PubMed] [DOI] [Full Text] [Full Text (PDF)] [Cited by in Crossref: 34] [Cited by in RCA: 44] [Article Influence: 5.5] [Reference Citation Analysis (0)] |
| 21. | Souza RF. Reflux esophagitis and its role in the pathogenesis of Barrett's metaplasia. J Gastroenterol. 2017;52:767-776. [RCA] [PubMed] [DOI] [Full Text] [Cited by in Crossref: 36] [Cited by in RCA: 48] [Article Influence: 5.3] [Reference Citation Analysis (0)] |
| 22. | Hanahan D, Coussens LM. Accessories to the crime: functions of cells recruited to the tumor microenvironment. Cancer Cell. 2012;21:309-322. [RCA] [PubMed] [DOI] [Full Text] [Cited by in Crossref: 2921] [Cited by in RCA: 3451] [Article Influence: 246.5] [Reference Citation Analysis (0)] |
| 23. | Susen RM, Bauer R, Olesch C, Fuhrmann DC, Fink AF, Dehne N, Jain A, Ebersberger I, Schmid T, Brüne B. Macrophage HIF-2α regulates tumor-suppressive Spint1 in the tumor microenvironment. Mol Carcinog. 2019;58:2127-2138. [RCA] [PubMed] [DOI] [Full Text] [Cited by in Crossref: 11] [Cited by in RCA: 22] [Article Influence: 3.1] [Reference Citation Analysis (0)] |
| 24. | Sammarco G, Varricchi G, Ferraro V, Ammendola M, De Fazio M, Altomare DF, Luposella M, Maltese L, Currò G, Marone G, Ranieri G, Memeo R. Mast Cells, Angiogenesis and Lymphangiogenesis in Human Gastric Cancer. Int J Mol Sci. 2019;20. [RCA] [PubMed] [DOI] [Full Text] [Full Text (PDF)] [Cited by in Crossref: 146] [Cited by in RCA: 156] [Article Influence: 22.3] [Reference Citation Analysis (0)] |
| 25. | Zeng D, Li M, Zhou R, Zhang J, Sun H, Shi M, Bin J, Liao Y, Rao J, Liao W. Tumor Microenvironment Characterization in Gastric Cancer Identifies Prognostic and Immunotherapeutically Relevant Gene Signatures. Cancer Immunol Res. 2019;7:737-750. [RCA] [PubMed] [DOI] [Full Text] [Cited by in Crossref: 353] [Cited by in RCA: 704] [Article Influence: 100.6] [Reference Citation Analysis (0)] |
| 26. | Semenza GL. Intratumoral Hypoxia and Mechanisms of Immune Evasion Mediated by Hypoxia-Inducible Factors. Physiology (Bethesda). 2021;36:73-83. [RCA] [PubMed] [DOI] [Full Text] [Cited by in Crossref: 9] [Cited by in RCA: 32] [Article Influence: 6.4] [Reference Citation Analysis (0)] |
| 27. | Zaidi N, Jaffee EM. Immunotherapy transforms cancer treatment. J Clin Invest. 2019;129:46-47. [RCA] [PubMed] [DOI] [Full Text] [Cited by in Crossref: 22] [Cited by in RCA: 37] [Article Influence: 4.6] [Reference Citation Analysis (0)] |
| 28. | Coutzac C, Pernot S, Chaput N, Zaanan A. Immunotherapy in advanced gastric cancer, is it the future? Crit Rev Oncol Hematol. 2019;133:25-32. [RCA] [PubMed] [DOI] [Full Text] [Cited by in Crossref: 68] [Cited by in RCA: 109] [Article Influence: 13.6] [Reference Citation Analysis (0)] |
| 29. | Messai Y, Gad S, Noman MZ, Le Teuff G, Couve S, Janji B, Kammerer SF, Rioux-Leclerc N, Hasmim M, Ferlicot S, Baud V, Mejean A, Mole DR, Richard S, Eggermont AM, Albiges L, Mami-Chouaib F, Escudier B, Chouaib S. Renal Cell Carcinoma Programmed Death-ligand 1, a New Direct Target of Hypoxia-inducible Factor-2 Alpha, is Regulated by von Hippel-Lindau Gene Mutation Status. Eur Urol. 2016;70:623-632. [RCA] [PubMed] [DOI] [Full Text] [Cited by in Crossref: 106] [Cited by in RCA: 122] [Article Influence: 12.2] [Reference Citation Analysis (0)] |
Open Access: This article is an open-access article that was selected by an in-house editor and fully peer-reviewed by external reviewers. It is distributed in accordance with the Creative Commons Attribution NonCommercial (CC BY-NC 4.0) license, which permits others to distribute, remix, adapt, build upon this work non-commercially, and license their derivative works on different terms, provided the original work is properly cited and the use is non-commercial. See: https://creativecommons.org/Licenses/by-nc/4.0/


