
















Copyright: ©Author(s) 2026.
World J Gastrointest Oncol. Aug 15, 2026; 18(8): 120942
Published online Aug 15, 2026. doi: 10.4251/wjgo.120942
Published online Aug 15, 2026. doi: 10.4251/wjgo.120942
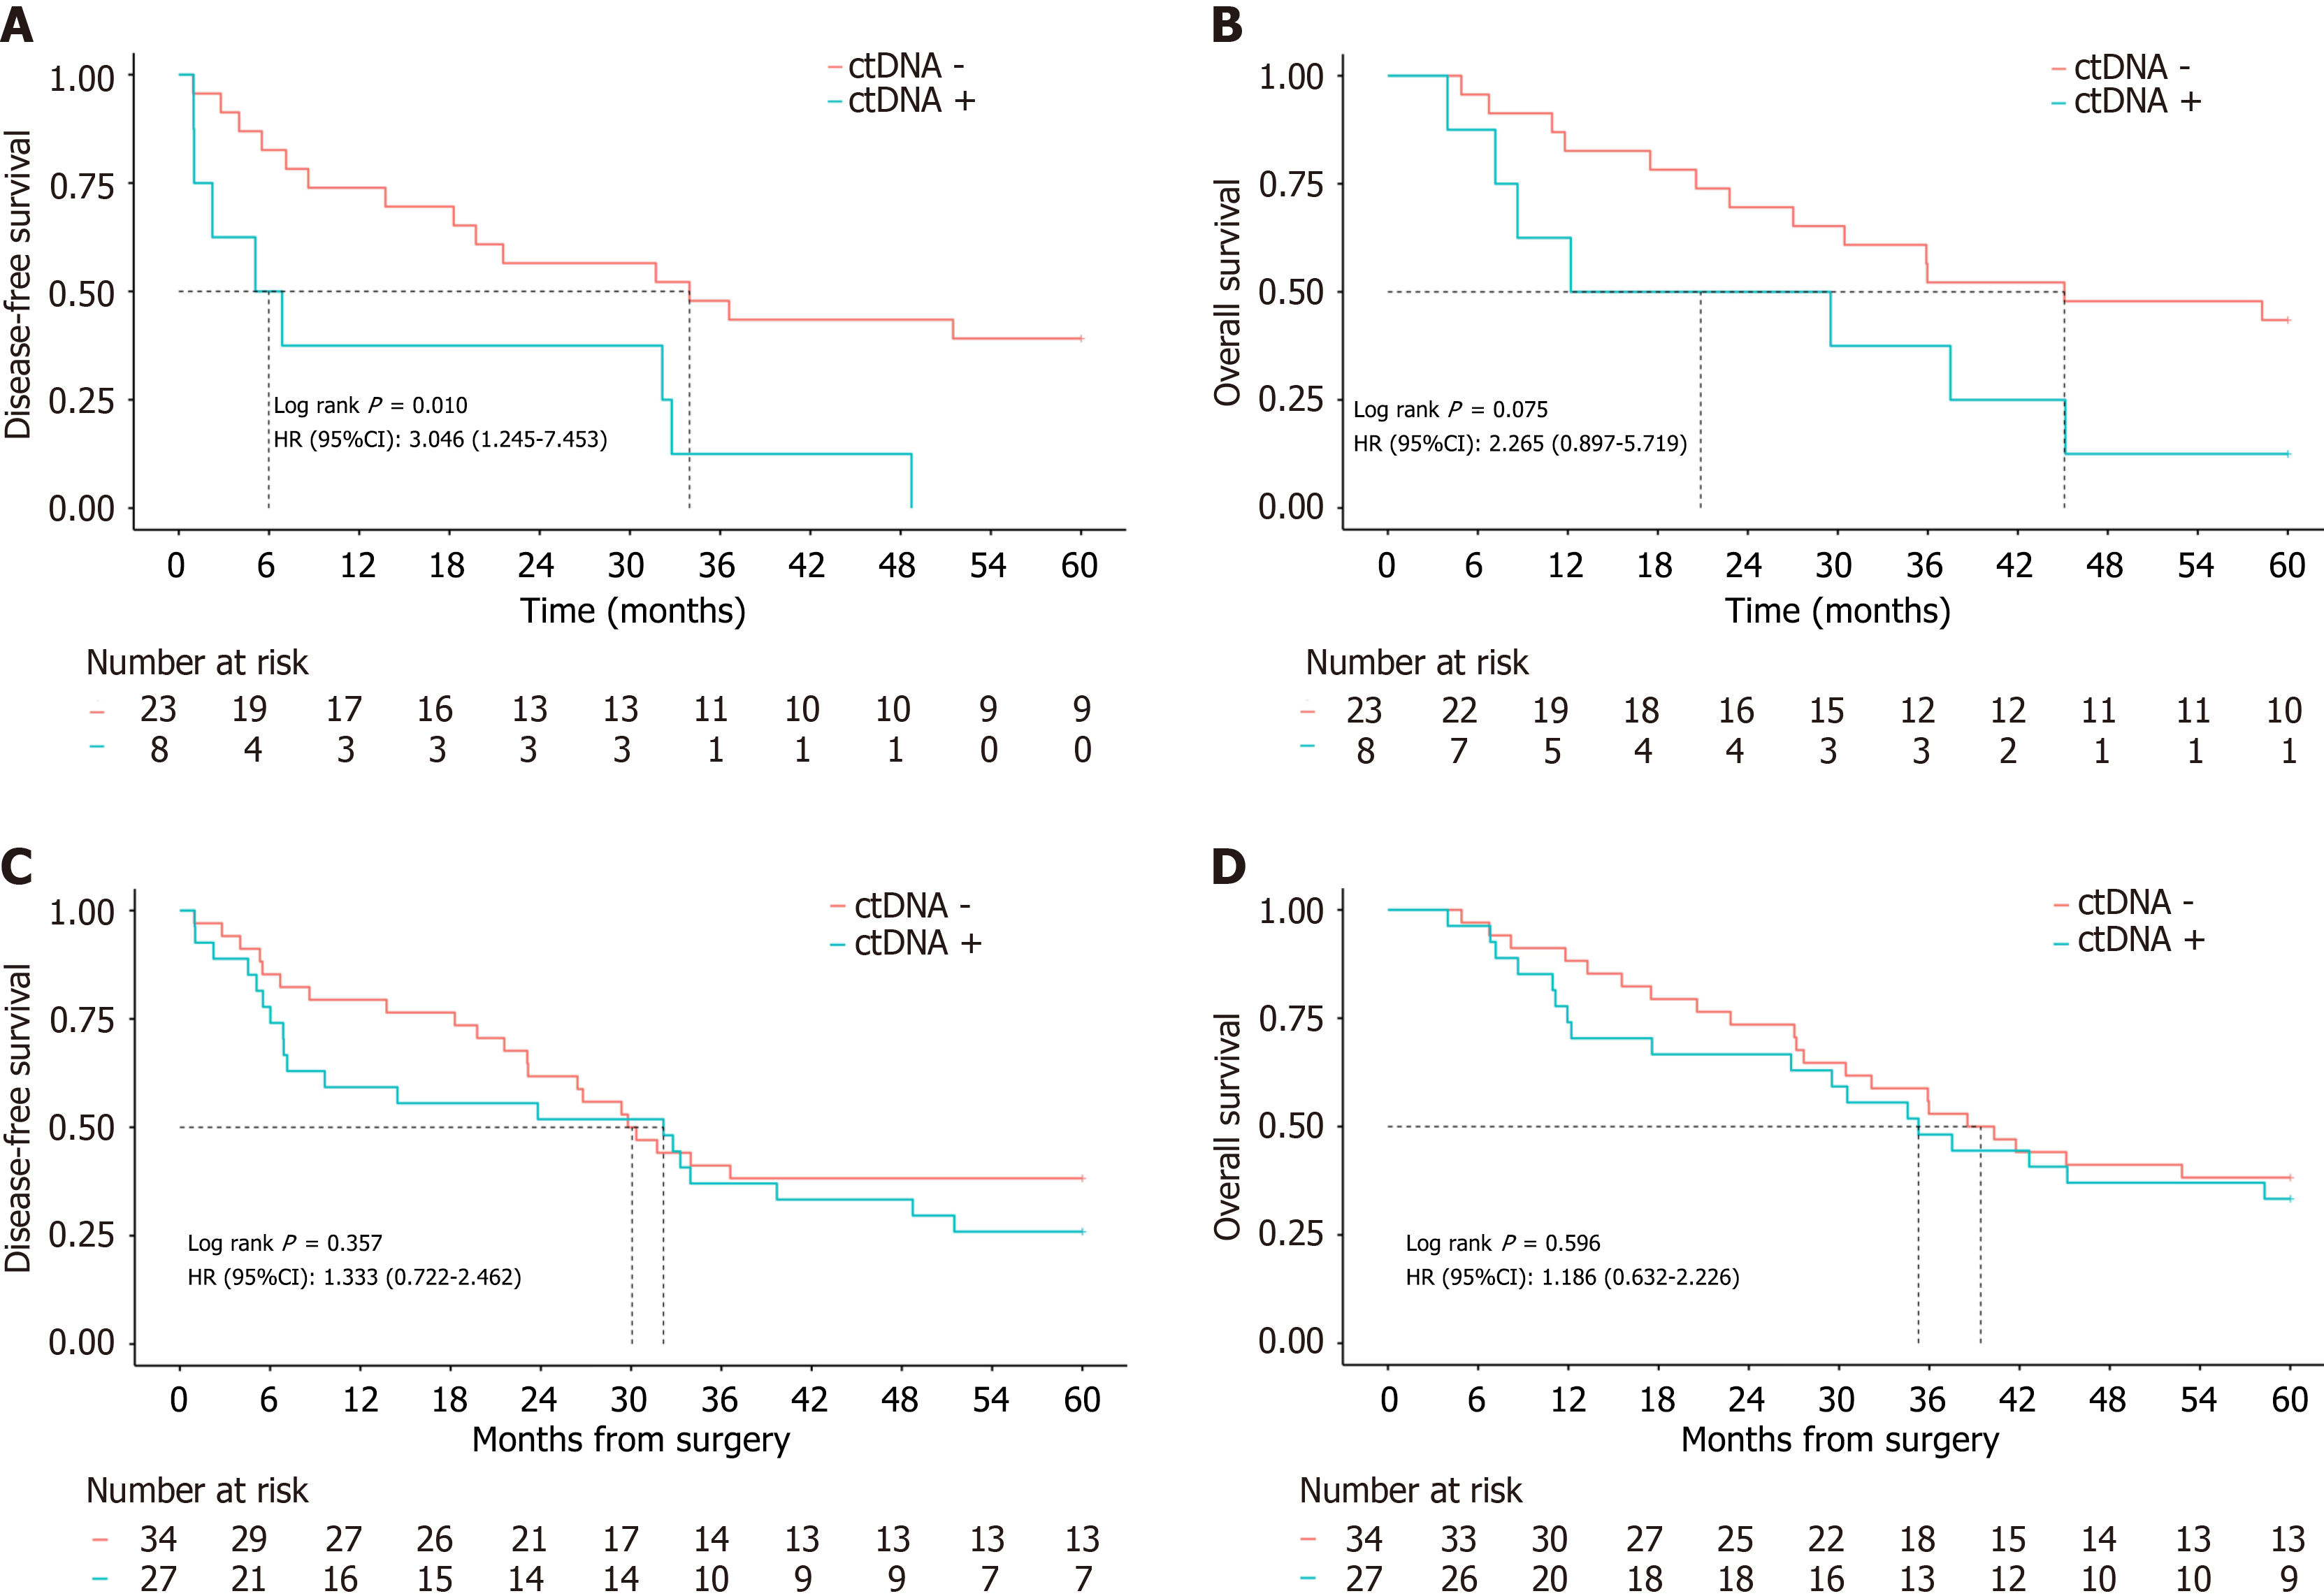
Figure 1 Kaplan-Meier survival analyses comparing circulating tumor DNA status in patients.
A: Disease-free survival stratified by postoperative tumor-informed circulating tumor DNA (ctDNA) status; B: Overall survival stratified by postoperative tumor-informed ctDNA status; C: Disease-free survival according to tumor-agnostic postoperative ctDNA status; D: Overall survival based on tumor-agnostic ctDNA detection. Log-rank tests were used for all comparisons. HR: Hazard ratio; CI: Confidence interval; ctDNA: Circulating tumor DNA.
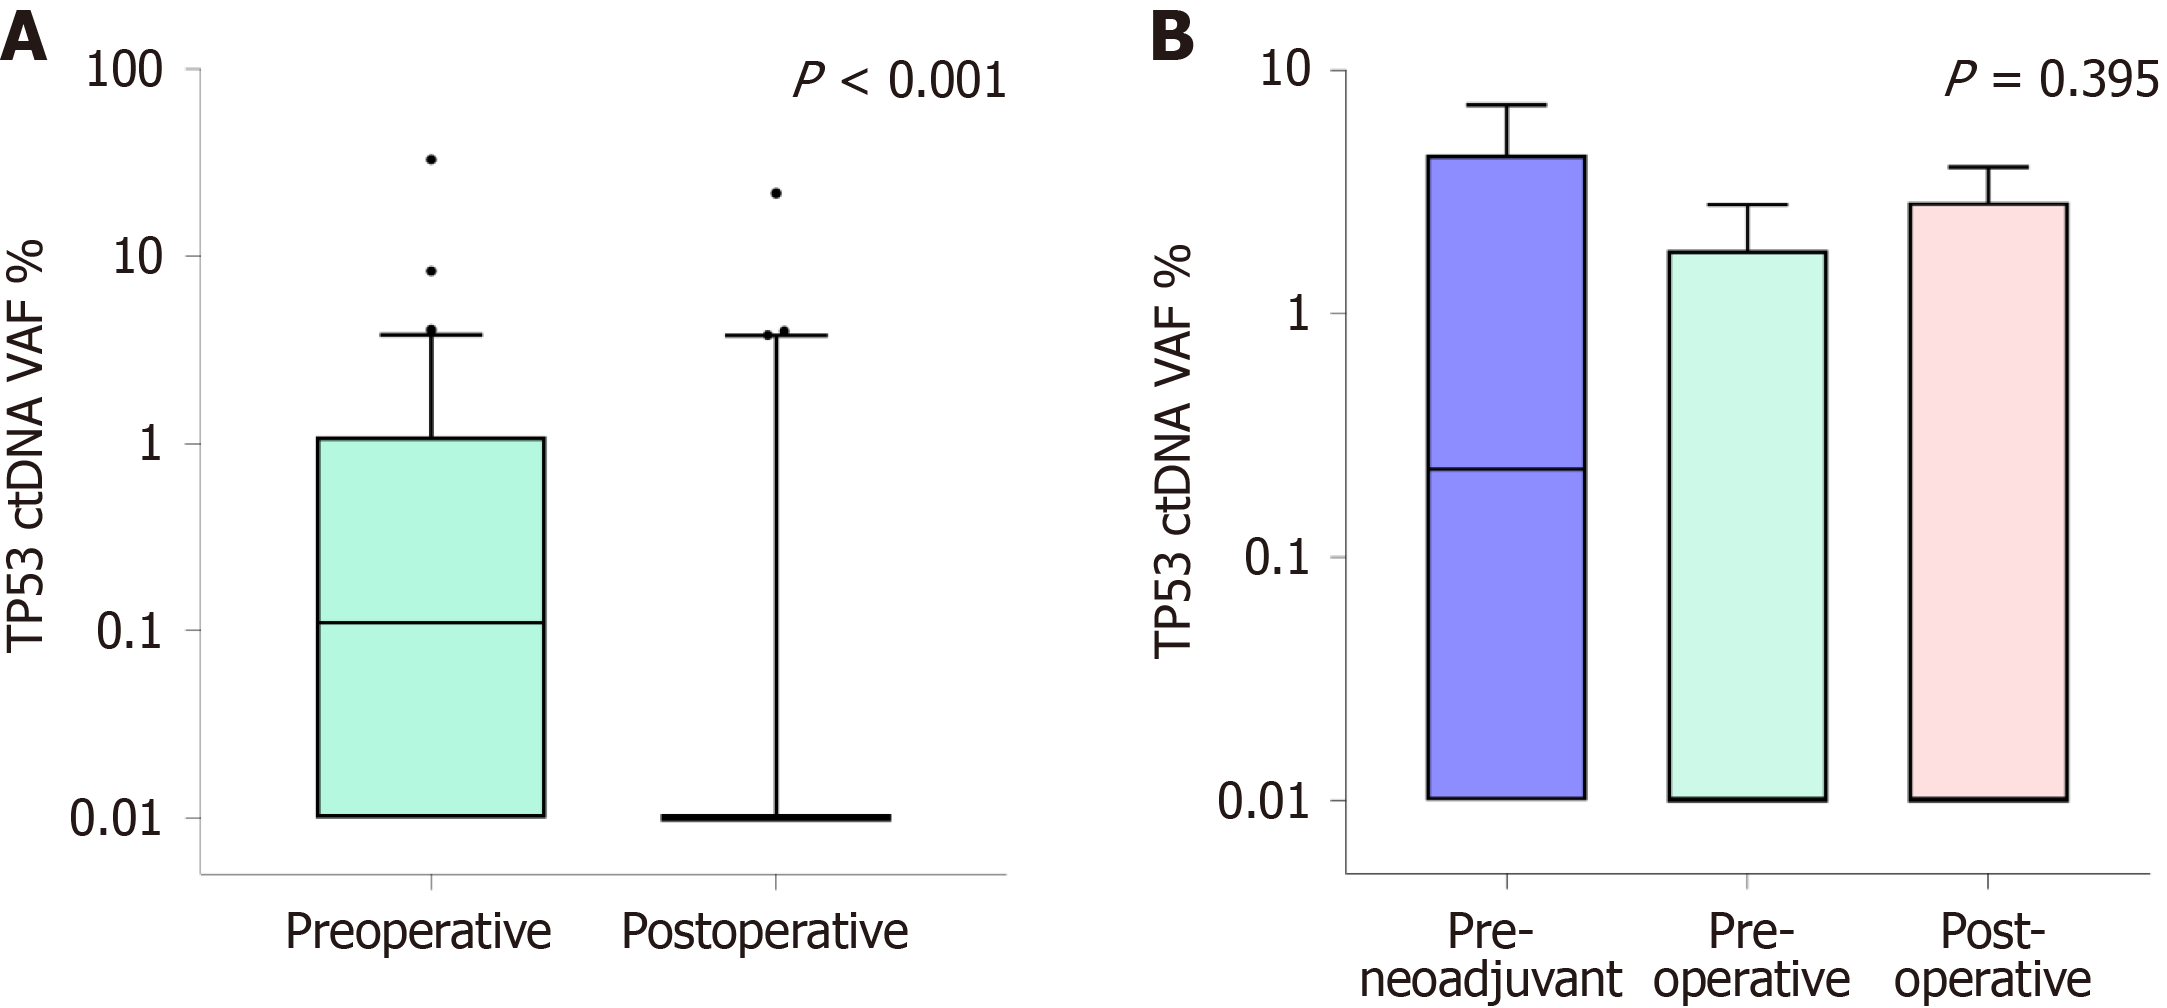
Figure 2 Dynamics of TP53 circulating tumor DNA variant allele frequency in esophageal squamous cell carcinoma patients.
A: Postoperative TP53 ctDNA variant allele frequency was significantly reduced compared to preoperative levels; B: In the neoadjuvant chemotherapy (NCT) subgroup, no significant differences were observed in TP53 ctDNA levels across treatment timepoints (pre-NCT vs post-NCT vs post-surgery); ctDNA not detected: Shown as 0.01% on log scale. VAF: Variant allele frequency; ctDNA: Circulating tumor DNA.
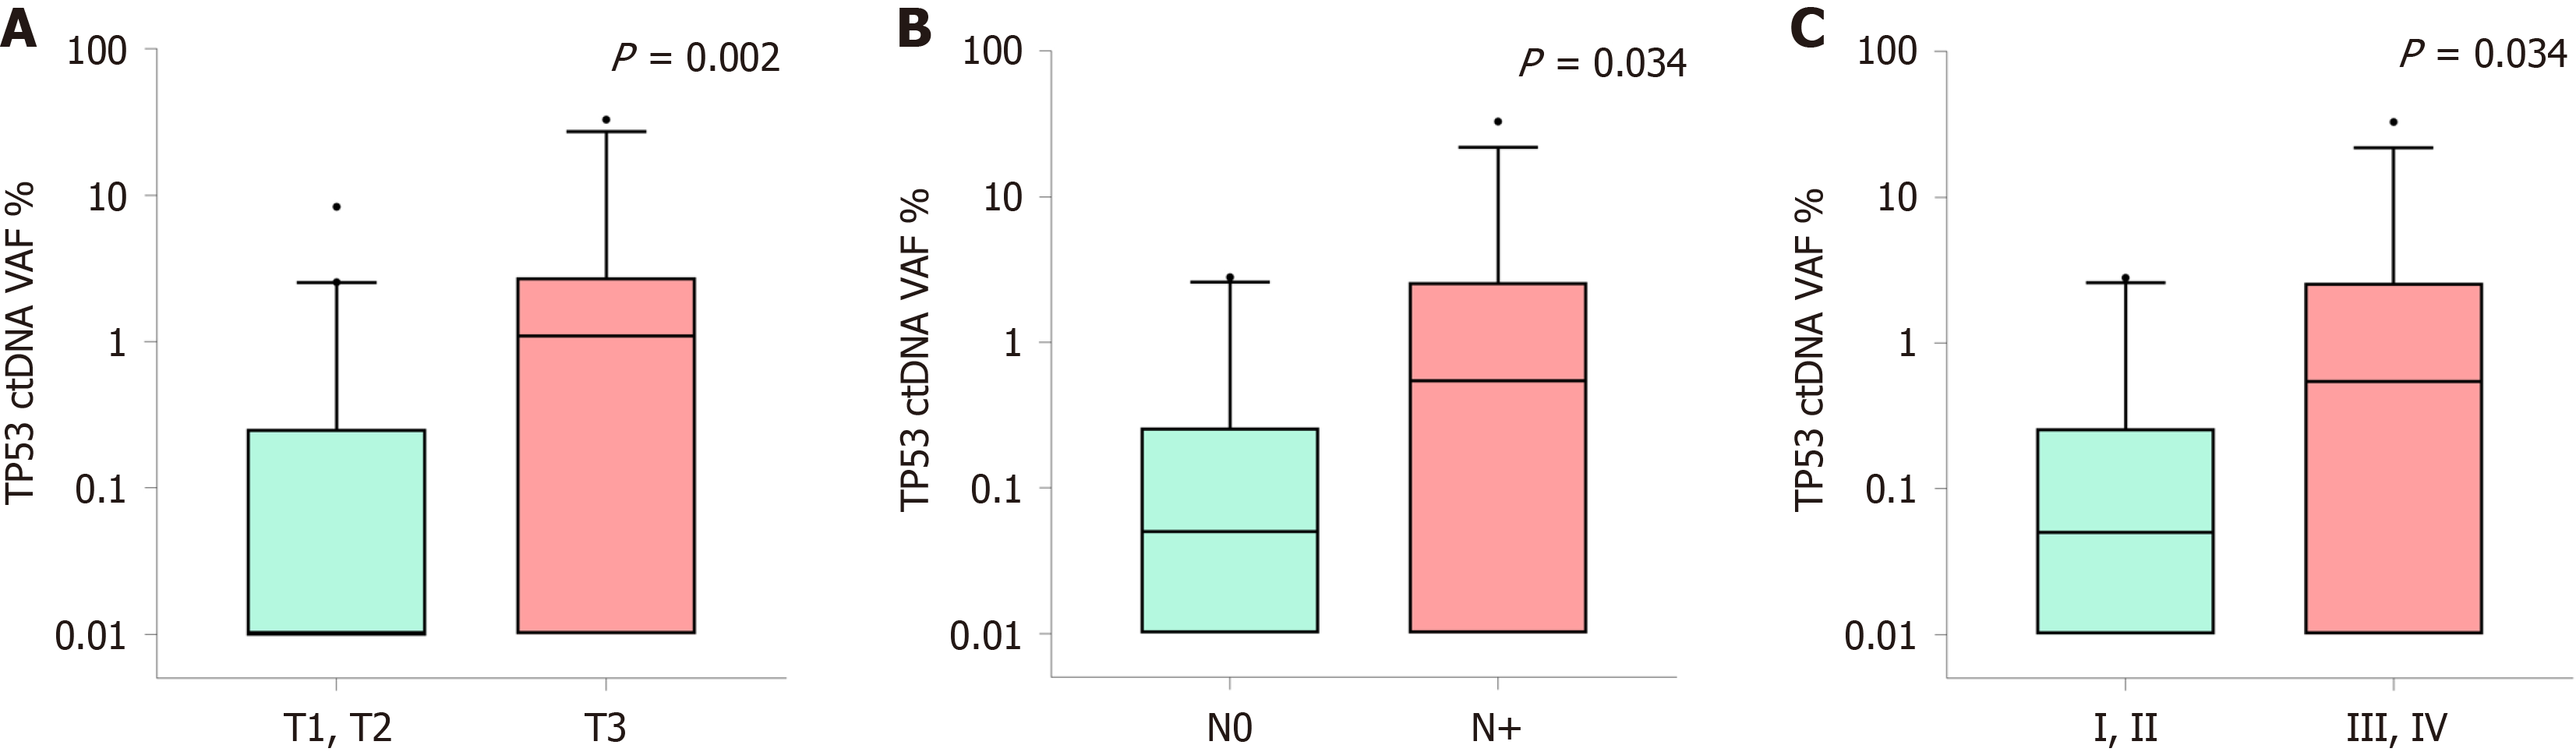
Figure 3 Association between preoperative TP53 circulating tumor DNA variant allele frequency and pathological staging in esophageal squamous cell carcinoma patients.
A: T-stage stratification: Median TP53 circulating tumor DNA variant allele frequency was 0.00% (T1, T2) and 1.09% (T3); B: N-stage stratification: Progressive increase in median mutation abundance from 0.05% (N0) to 0.54% (N+); C: Tumor-node-metastasis stage stratification: Significant elevation in median mutation abundance with advancing stage: 0.05% (stage I-II) and 0.54% (stage III-IV); ctDNA not detected: Shown as 0.01% on log scale. VAF: Variant allele frequency; ctDNA: Circulating tumor DNA.
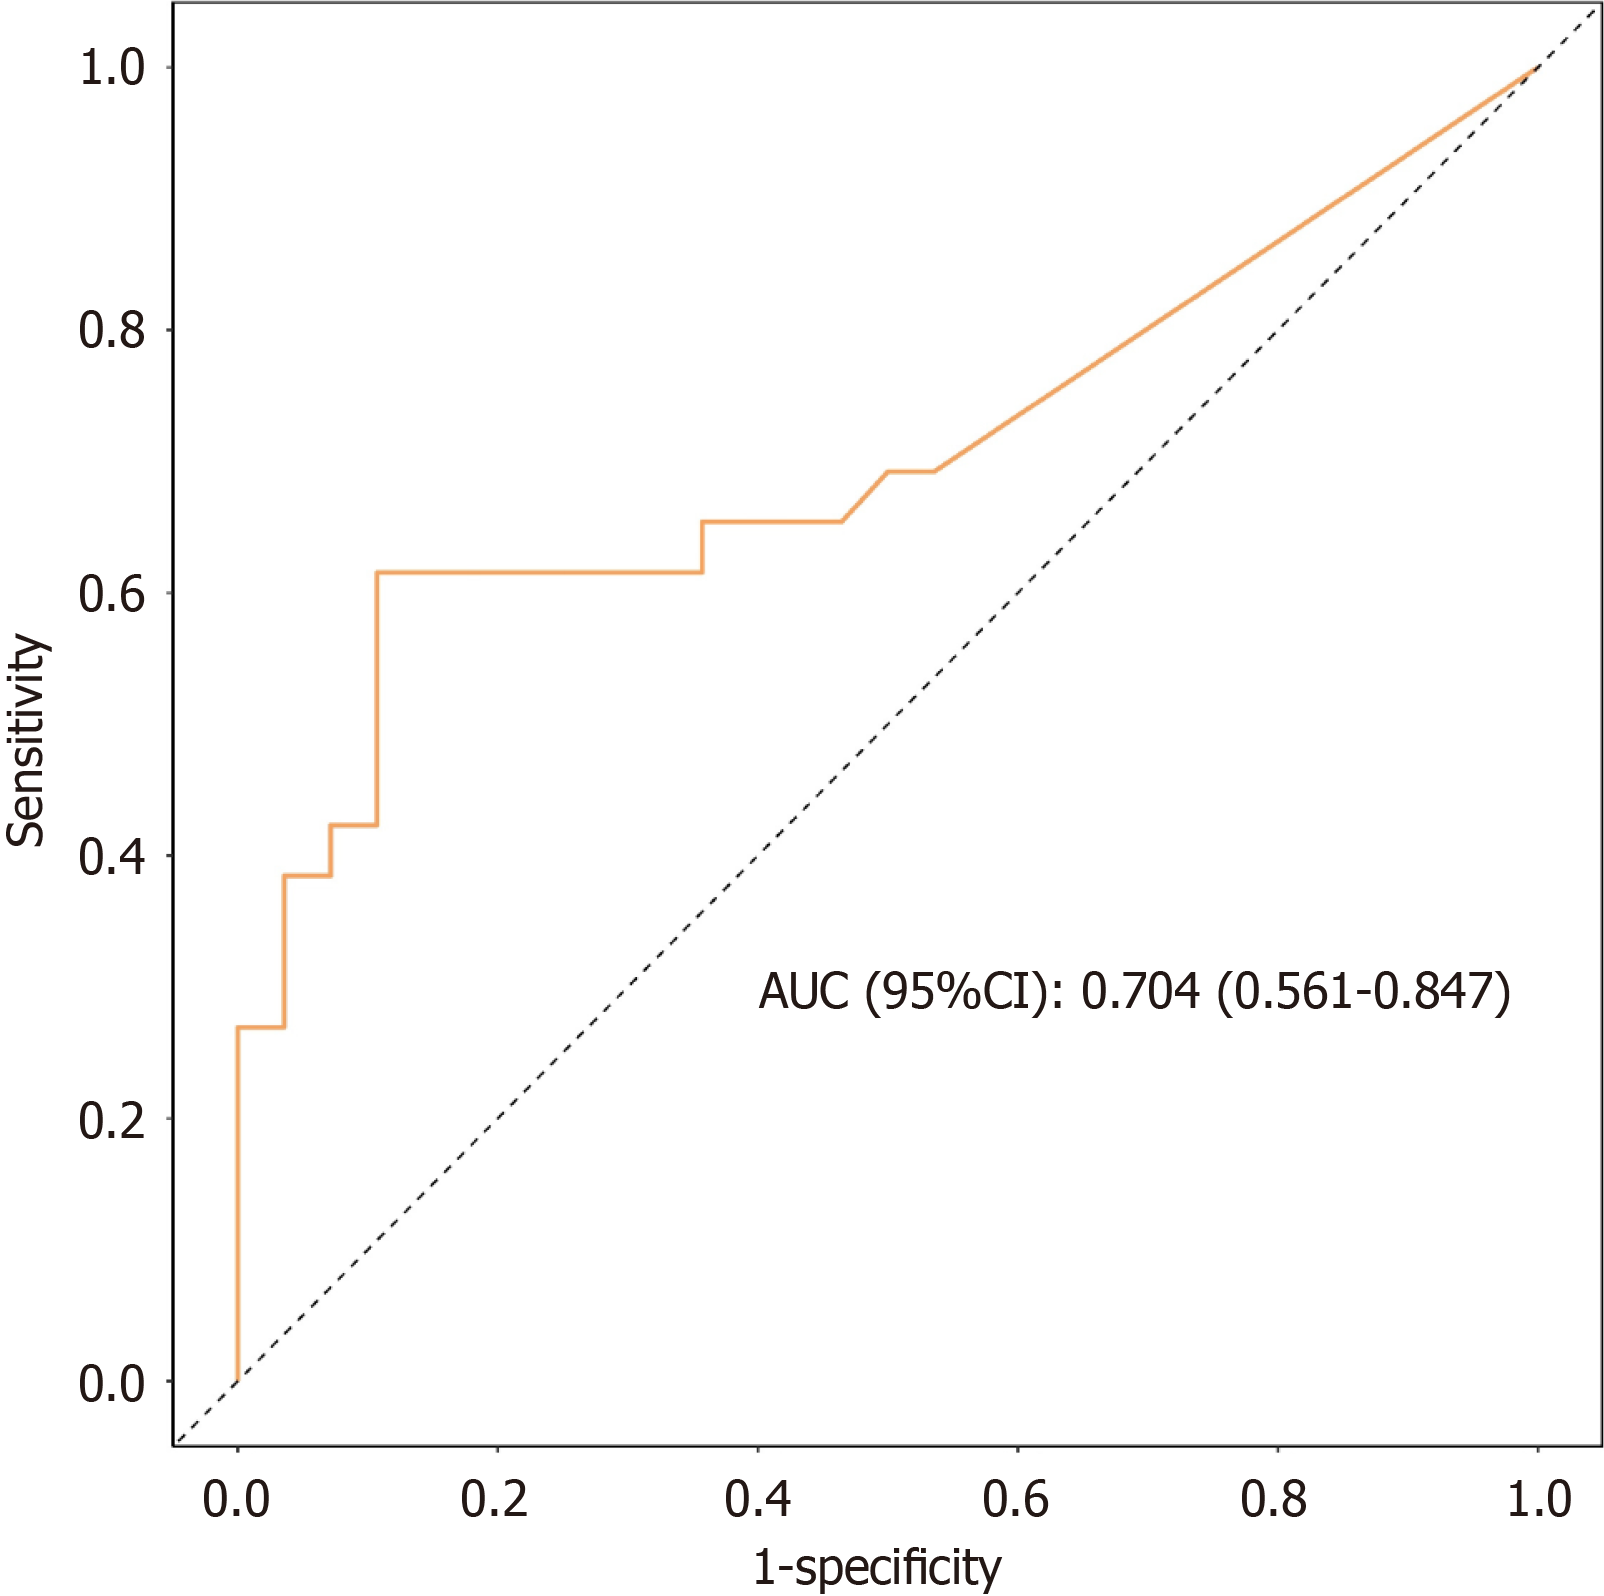
Figure 4 Receiver operating characteristic analysis of preoperative TP53 circulating tumor DNA for lymph node metastasis prediction.
The analysis yields an area under the curve of 0.704, indicating the potential of TP53 circulating tumor DNA variant allele frequency as a predictive biomarker for nodal metastasis. AUC: Area under the curve; CI: Confidence interval.
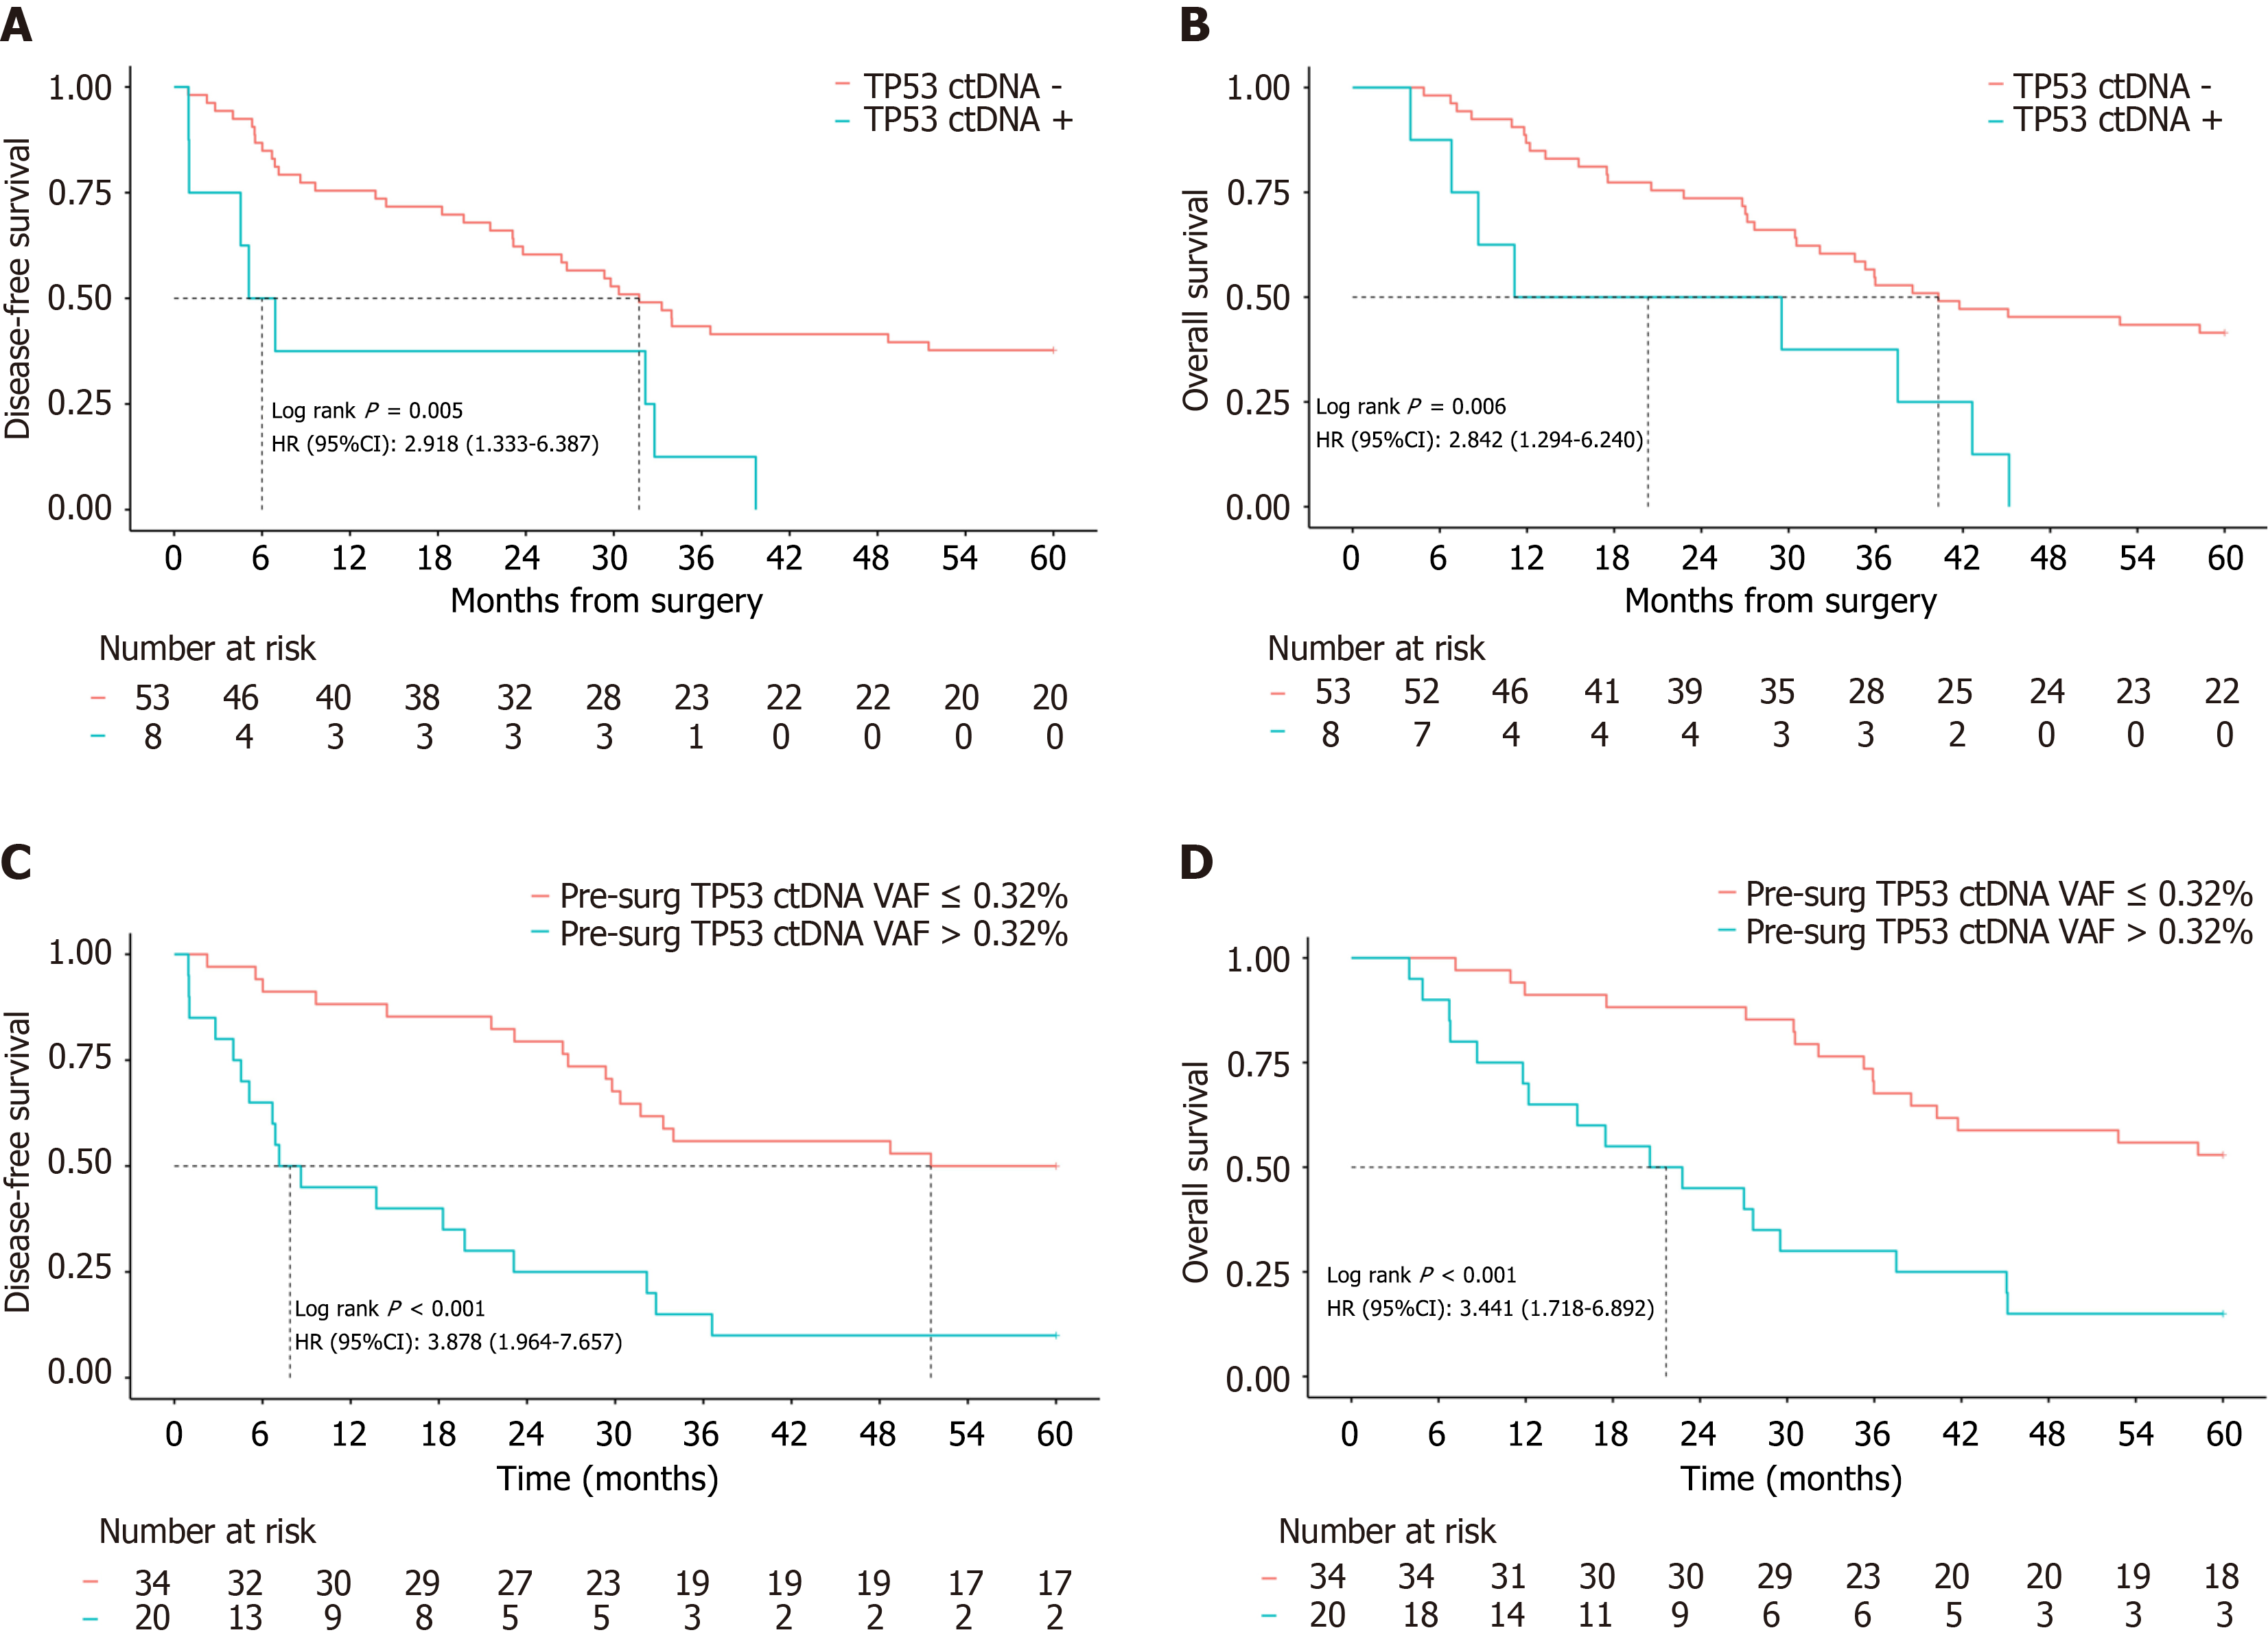
Figure 5 Prognostic impact of TP53 circulating tumor DNA in esophageal squamous cell carcinoma patients.
A: Disease-free survival according to postoperative TP53 circulating tumor DNA (ctDNA) status (positive vs negative); B: Overall survival based on postoperative TP53 ctDNA detection; C: Disease-free survival according to preoperative TP53 ctDNA variant allele frequency (≤ 0.32% vs > 0.32%); D: Overall survival according to preoperative TP53 ctDNA variant allele frequency (≤ 0.32% vs > 0.32%). All comparisons were performed using log-rank tests. VAF: Variant allele frequency; ctDNA: Circulating tumor DNA; CI: Confidence interval.
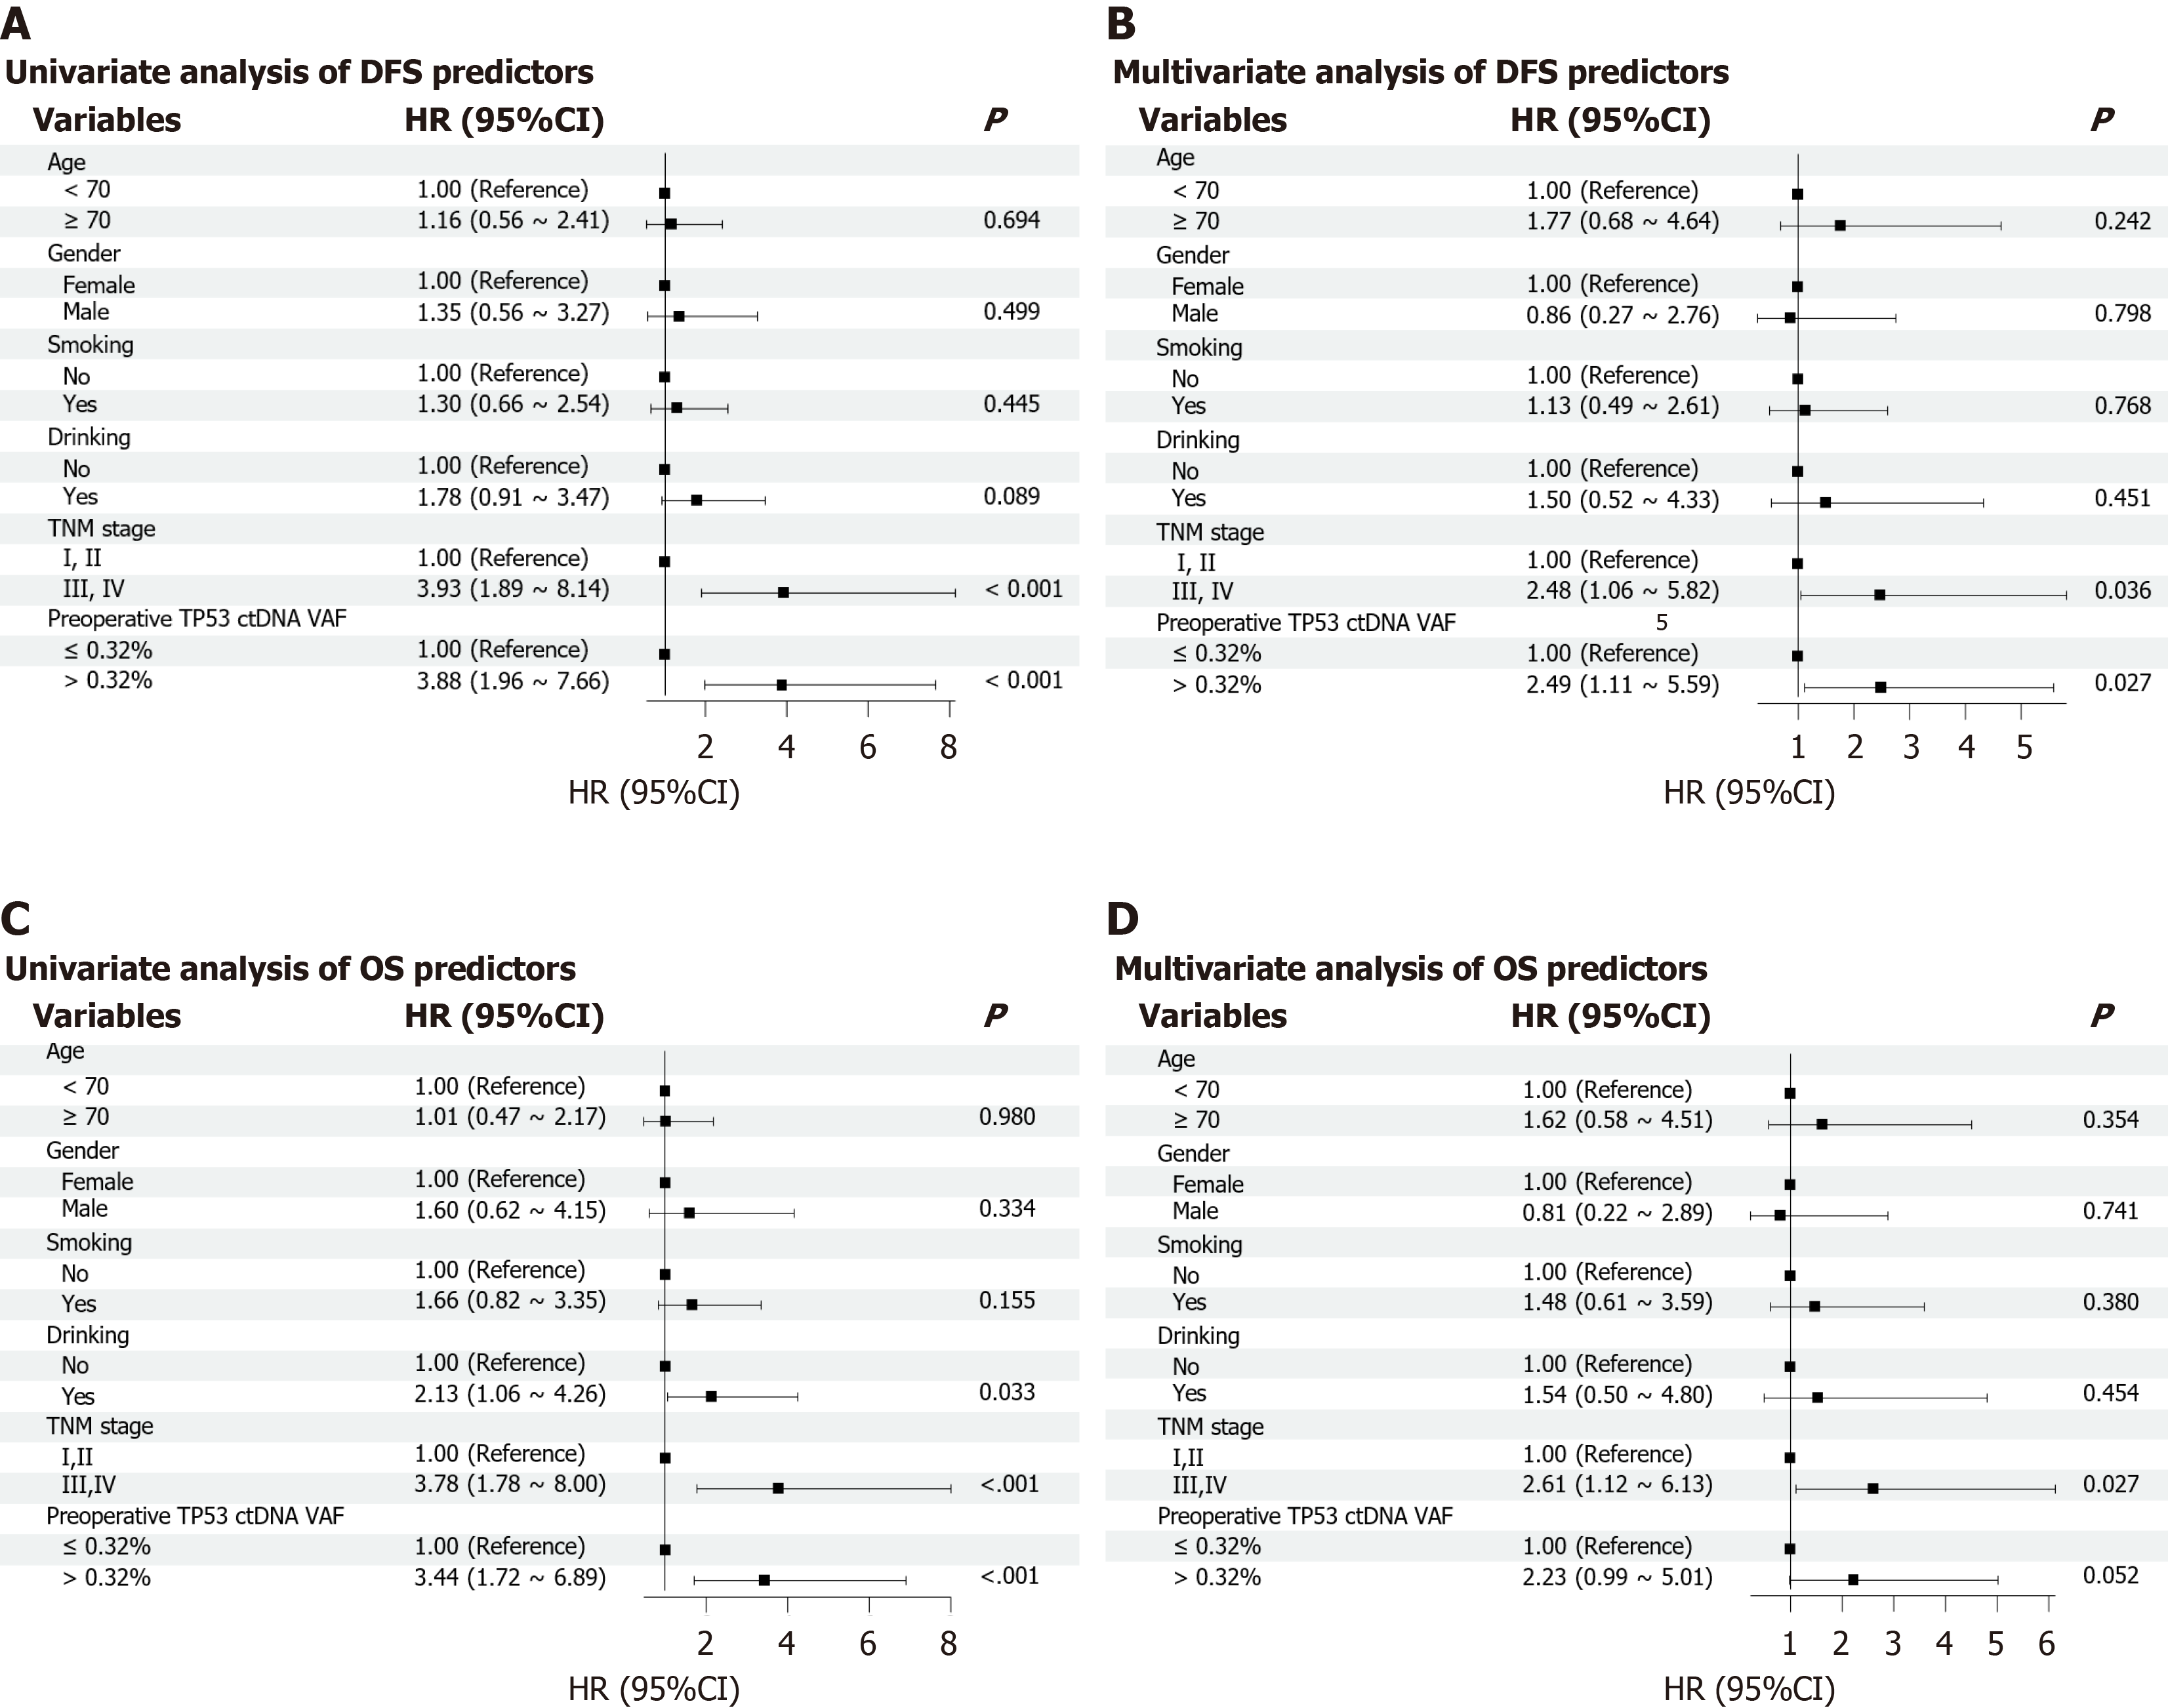
Figure 6 Multivariable Cox regression analysis of prognostic factors.
Multivariate analysis identified high preoperative TP53 circulating tumor DNA variant allele frequency as an independent factor for disease recurrence, alongside advanced tumor-node-metastasis stage. A: Univariate analysis of disease-free survival predictors; B: Multivariate analysis of disease-free survival predictors; C: Univariate analysis of overall survival predictors; D: Multivariate analysis of overall survival predictors. HR: Hazard ratio; CI: Confidence interval; TNM: Tumor-node-metastasis; DFS: Disease-free survival; OS: Overall survival; VAF: Variant allele frequency; ctDNA: Circulating tumor DNA.
- Citation: Gu RT, Liu T, Piao ZS, Jin H, Wang XW, Li X. Quantitative TP53 circulating tumor DNA predicts tumor response and survival outcomes in esophageal squamous cell carcinoma. World J Gastrointest Oncol 2026; 18(8): 120942
- URL: https://www.wjgnet.com/1948-5204/full/v18/i8/120942.htm
- DOI: https://dx.doi.org/10.4251/wjgo.120942