
















Copyright: ©Author(s) 2026.
World J Gastrointest Oncol. Aug 15, 2026; 18(8): 119026
Published online Aug 15, 2026. doi: 10.4251/wjgo.119026
Published online Aug 15, 2026. doi: 10.4251/wjgo.119026
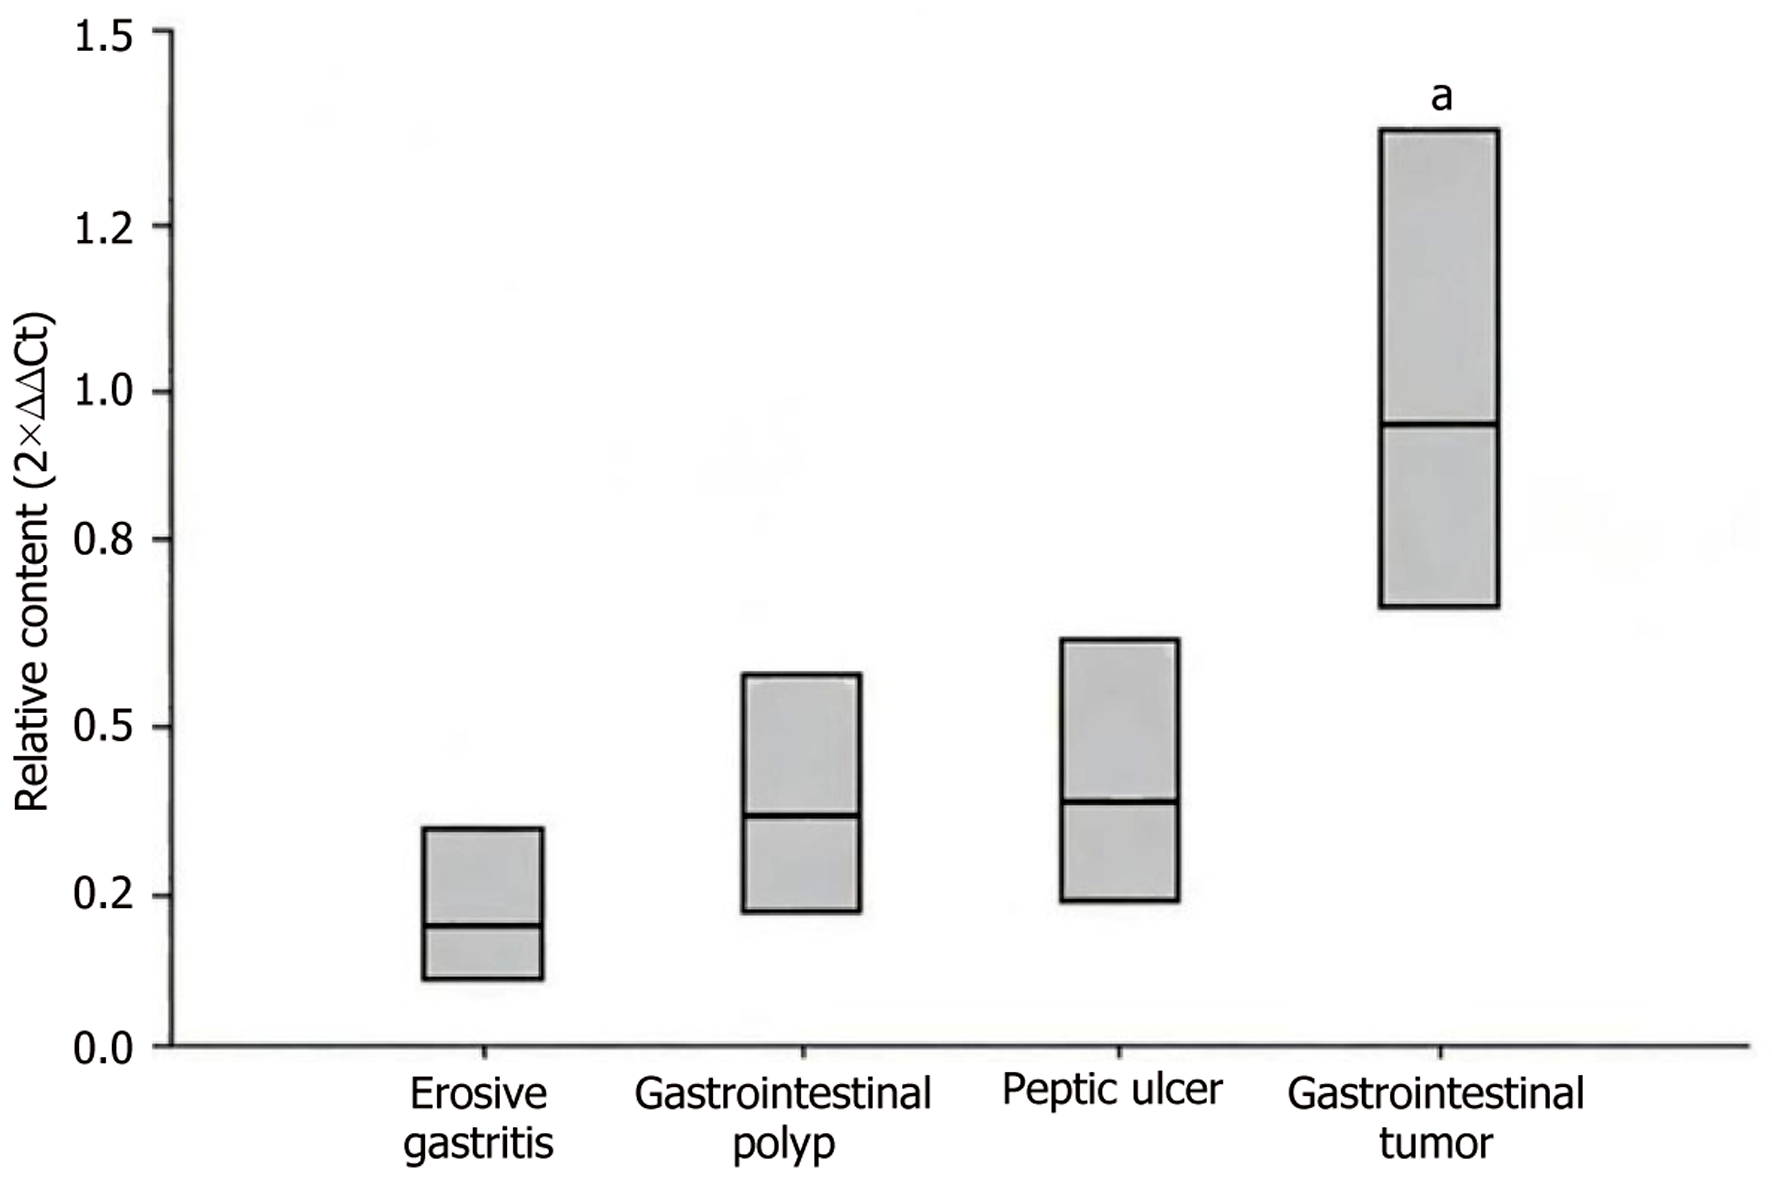
Figure 1 Comparison of relative bacterial load of Streptococcus pharyngitidis in patients with different gastrointestinal diseases.
Compared with the erosive gastritis group, gastrointestinal polyp group, and peptic ulcer group, aP < 0.05.
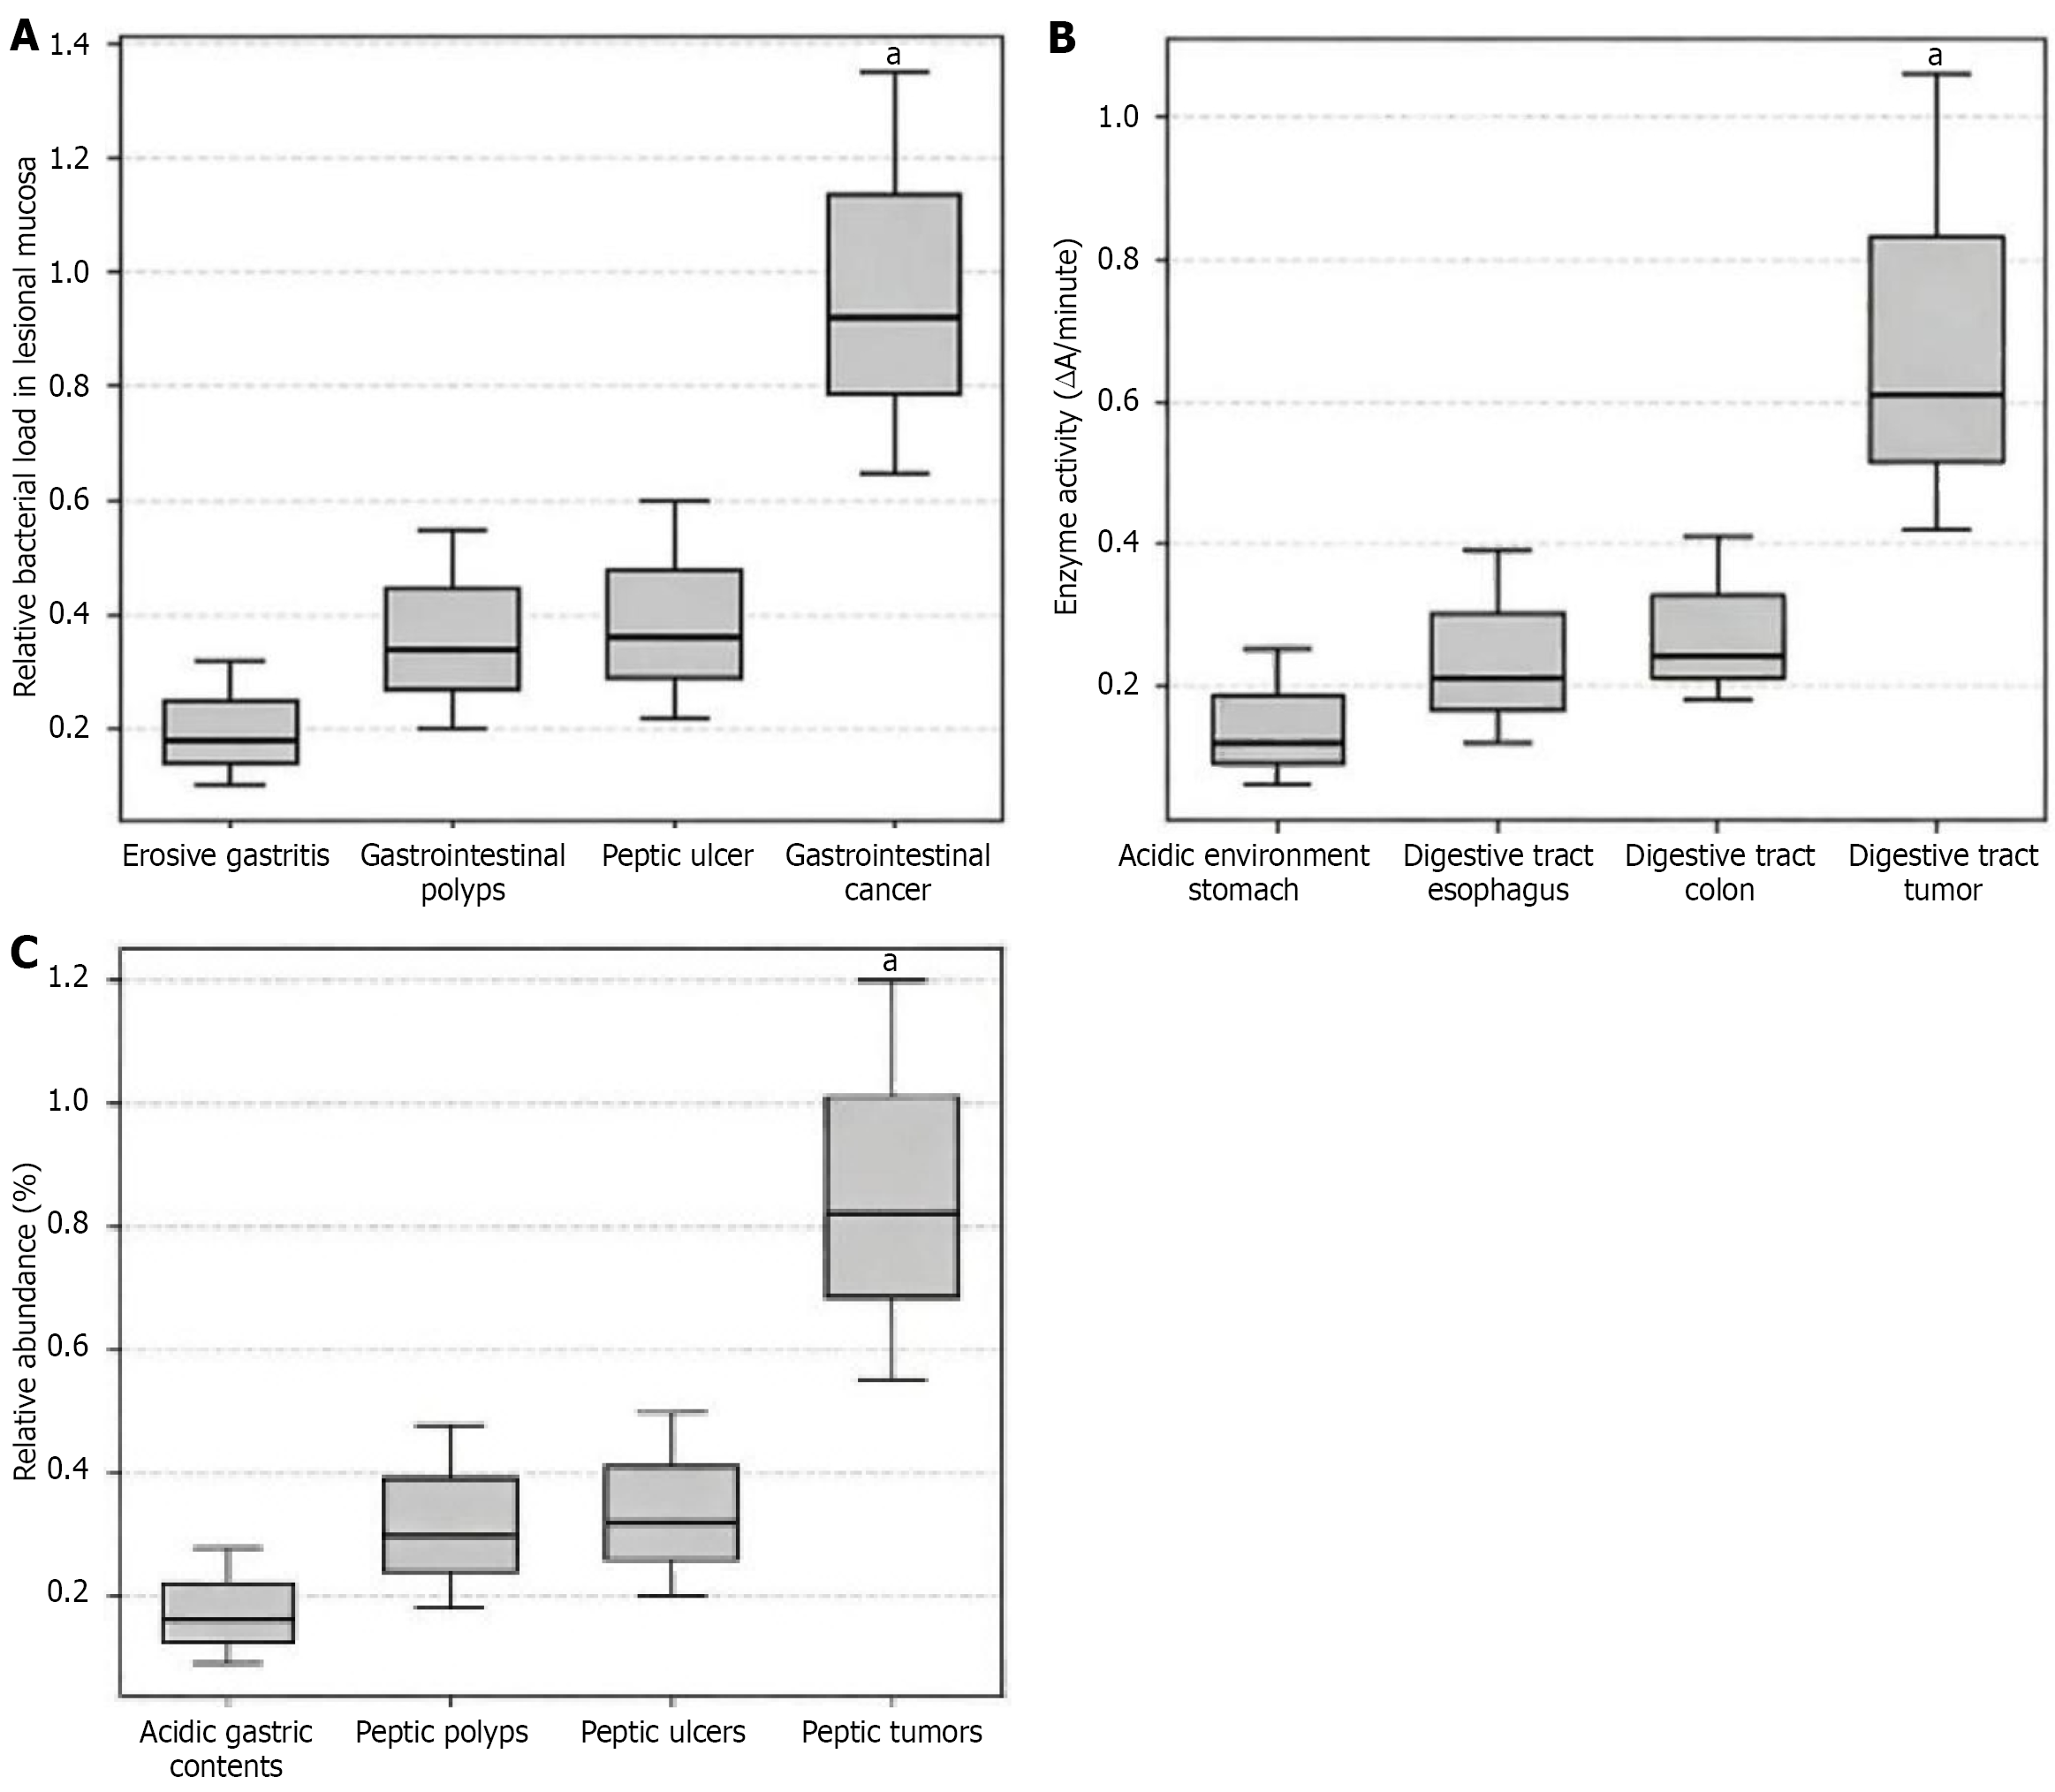
Figure 2 Comparison of relative bacterial load in pathological mucosa, distal mucosa, gastric juice/fecal matter among patients with different diseases.
A: Pathological mucosa; B: Distal mucosa; C: Gastric juice/fecal matter. Compared with erosive gastritis group, gastrointestinal polyp group, and peptic ulcer group, aP < 0.05.
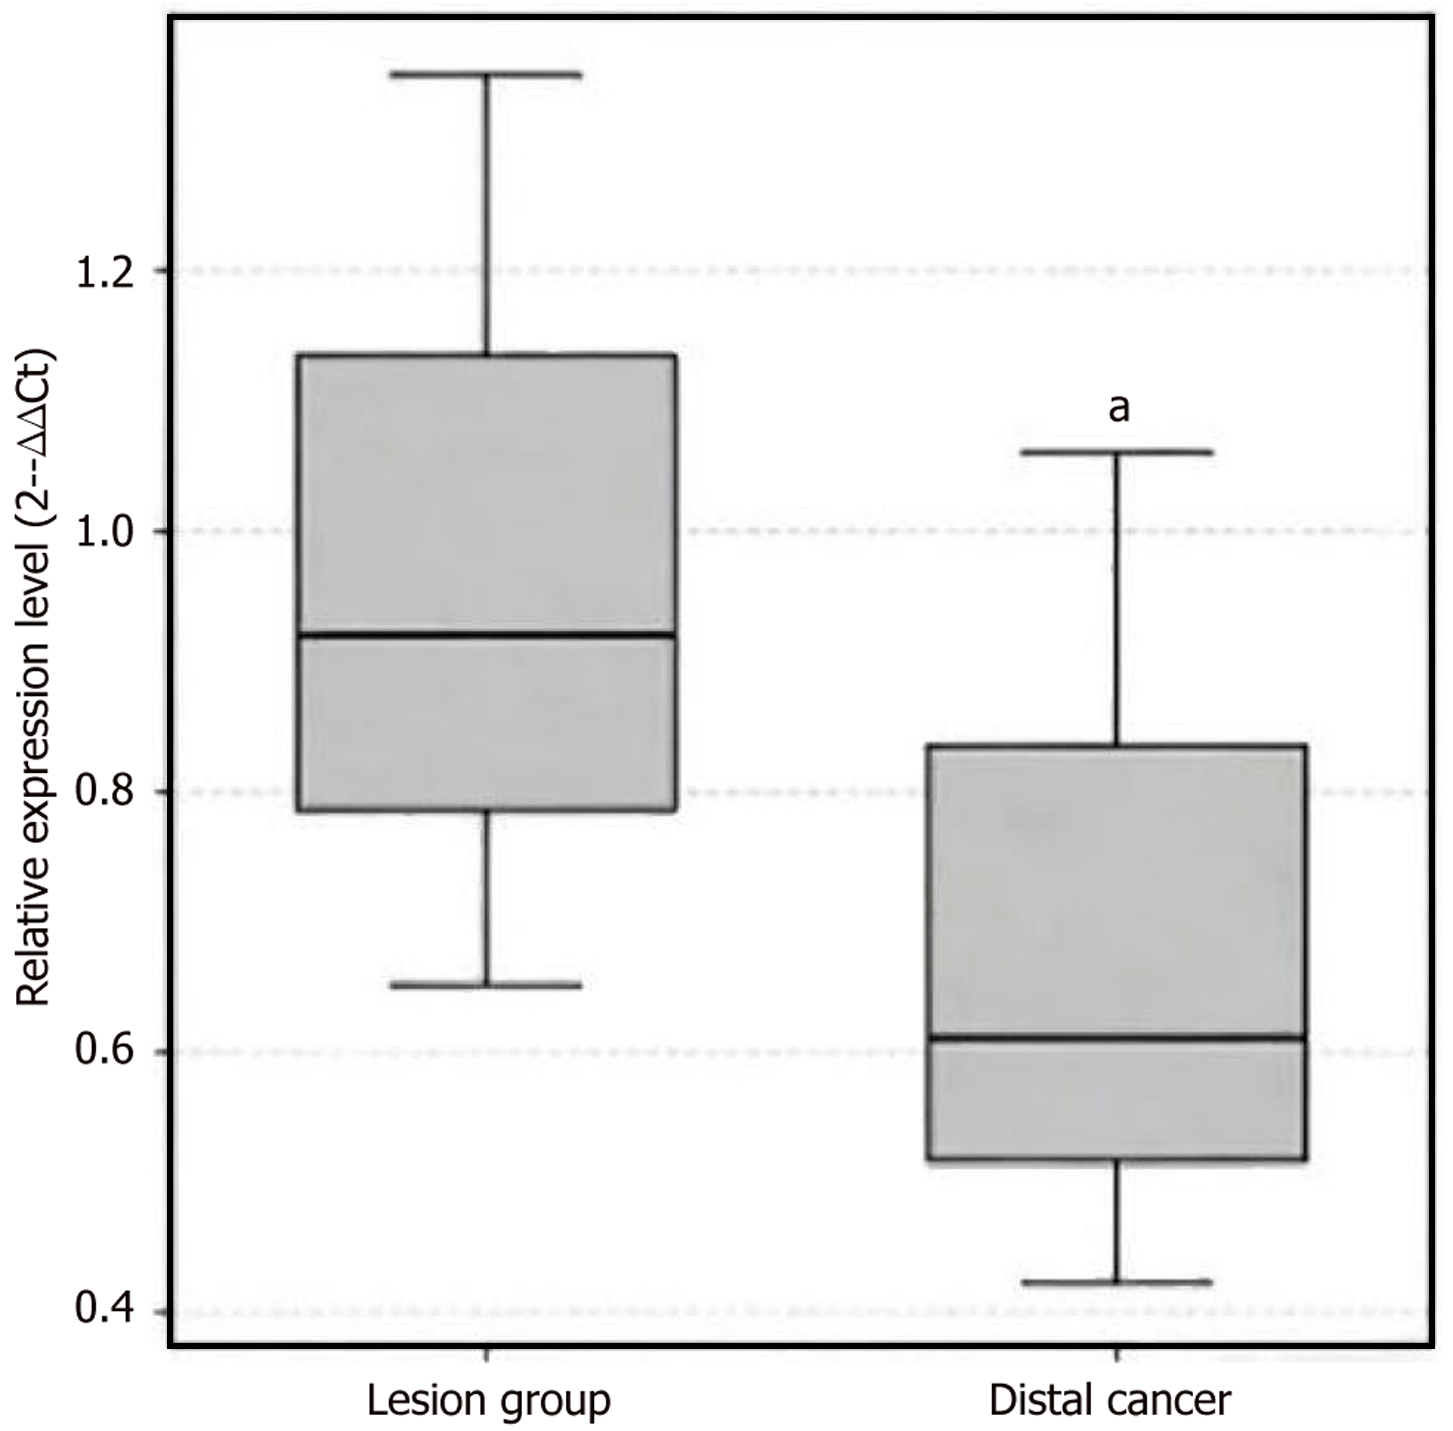
Figure 3 Comparison of relative bacterial load in different locations of gastrointestinal tumors.
Compared with pathological mucosa, aP < 0.05.
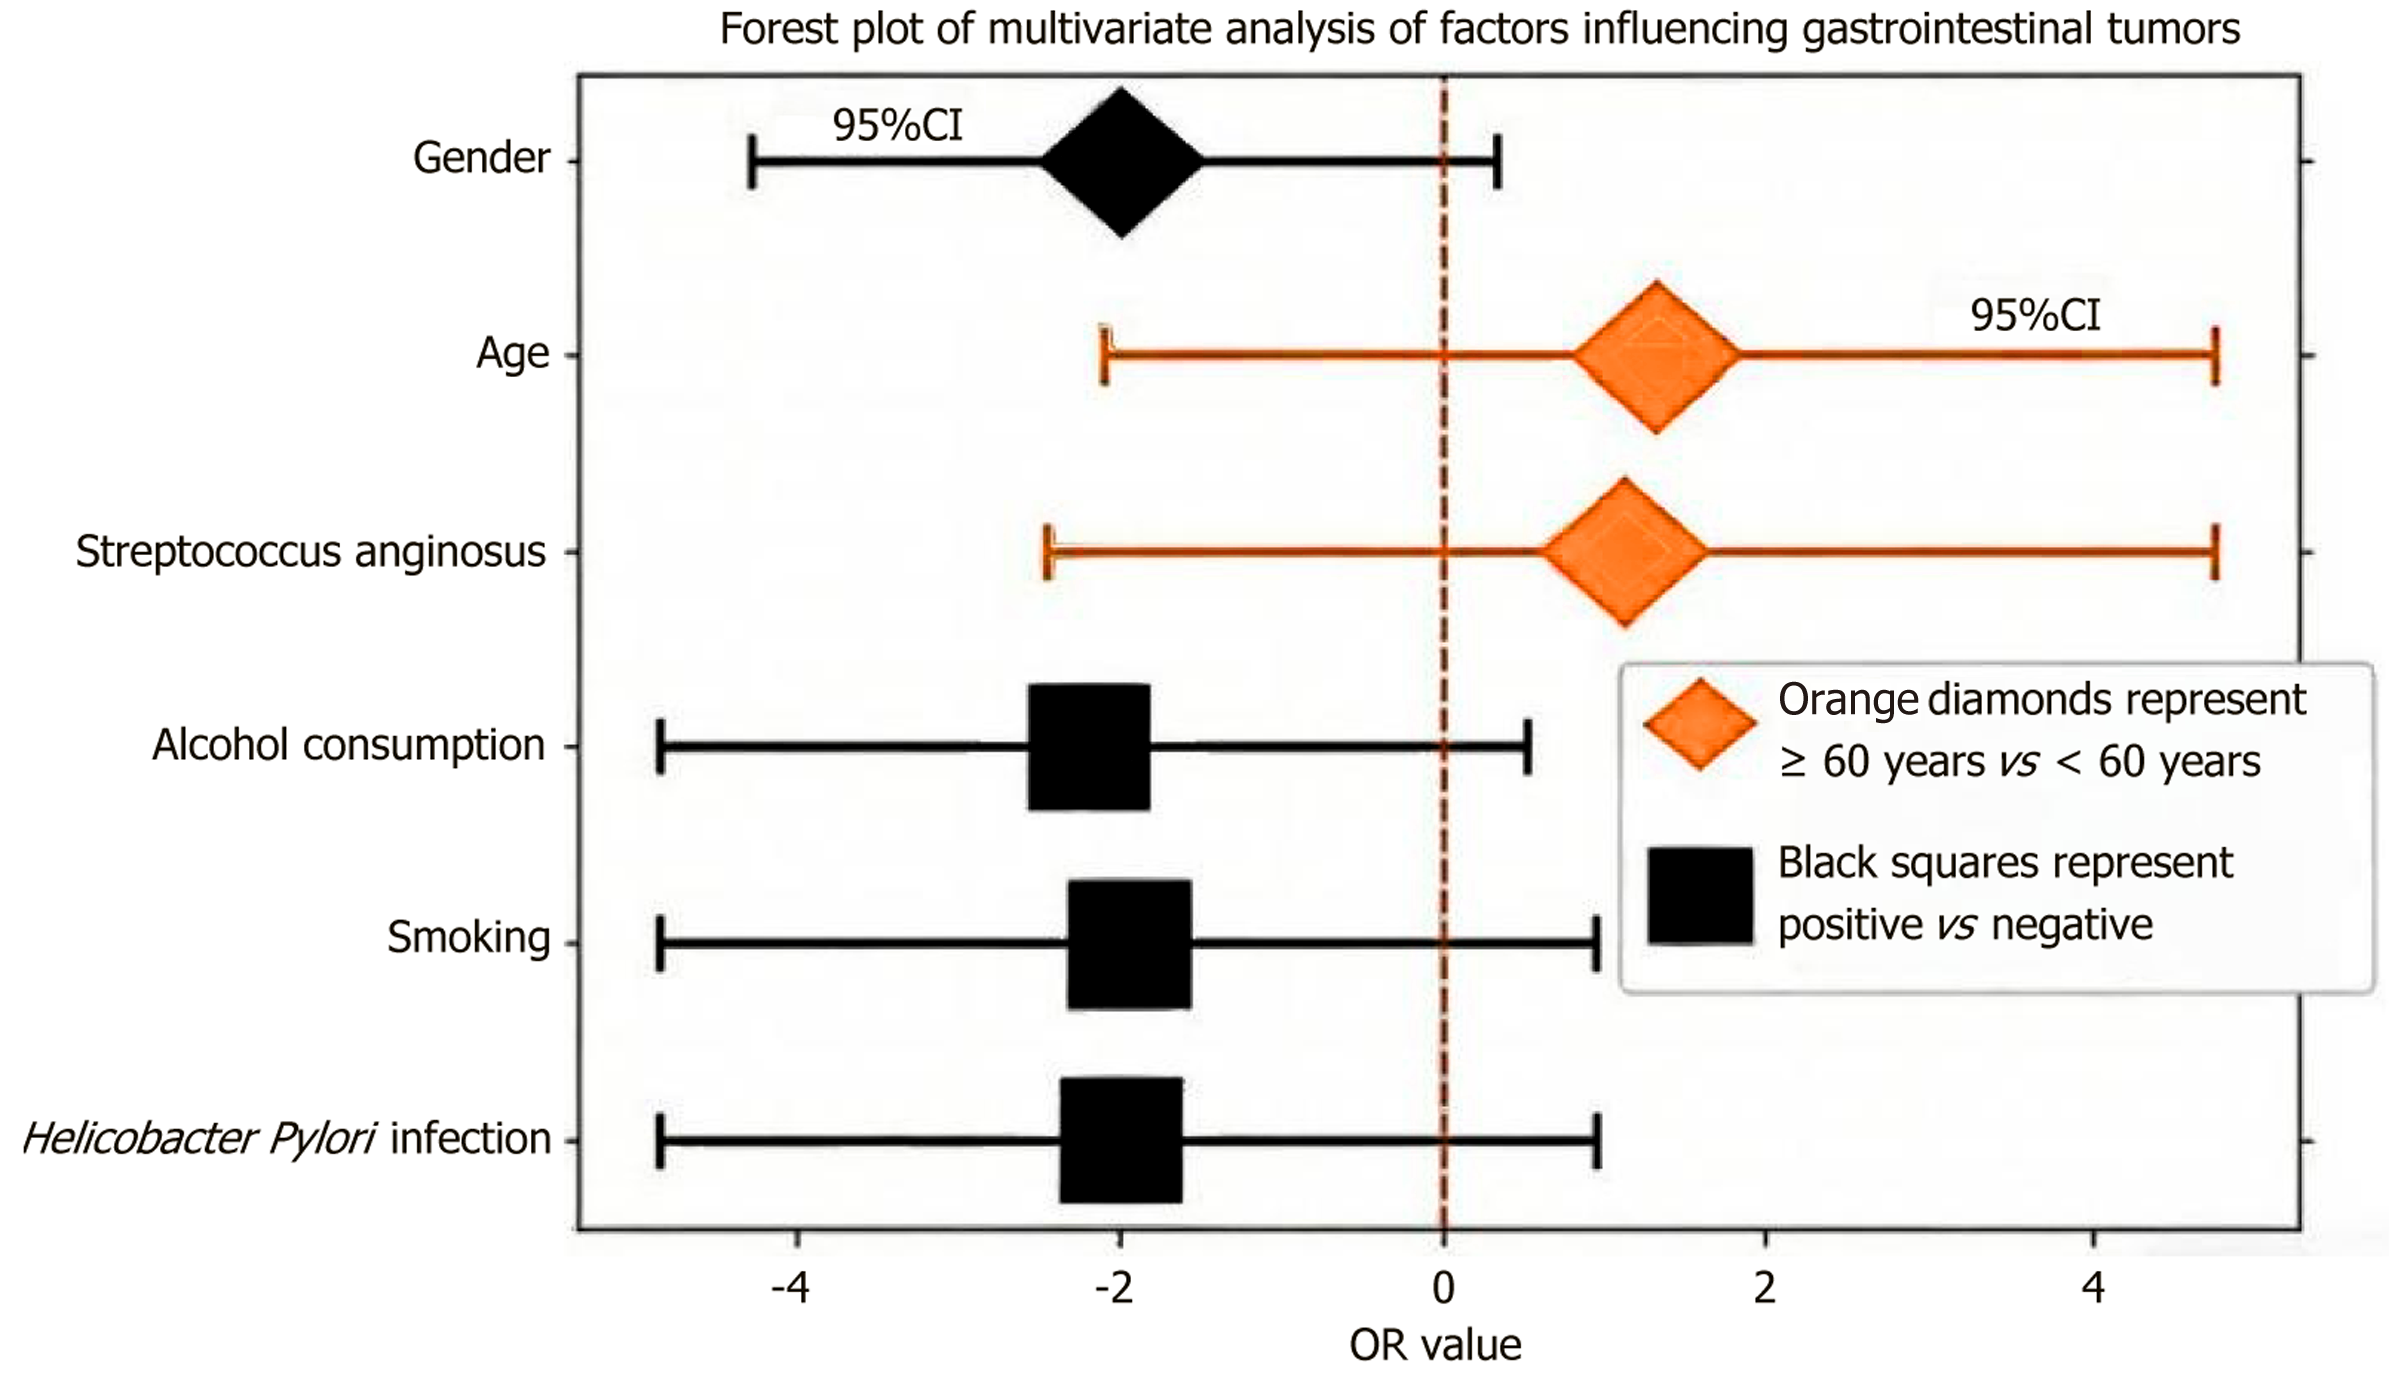
Figure 4 Forest plot of multivariate analysis influencing gastrointestinal tumors.
OR: Odds ratio.
- Citation: Huang DB, Chen BS, Wang AP, Hu XZ, Xu YJ. Polymerase chain reaction detection of Streptococcus anginosus in digestive diseases and its immunomodulation in rat gastric cancer model. World J Gastrointest Oncol 2026; 18(8): 119026
- URL: https://www.wjgnet.com/1948-5204/full/v18/i8/119026.htm
- DOI: https://dx.doi.org/10.4251/wjgo.119026