
















Copyright: ©Author(s) 2026.
World J Gastrointest Oncol. Jul 15, 2026; 18(7): 120724
Published online Jul 15, 2026. doi: 10.4251/wjgo.120724
Published online Jul 15, 2026. doi: 10.4251/wjgo.120724
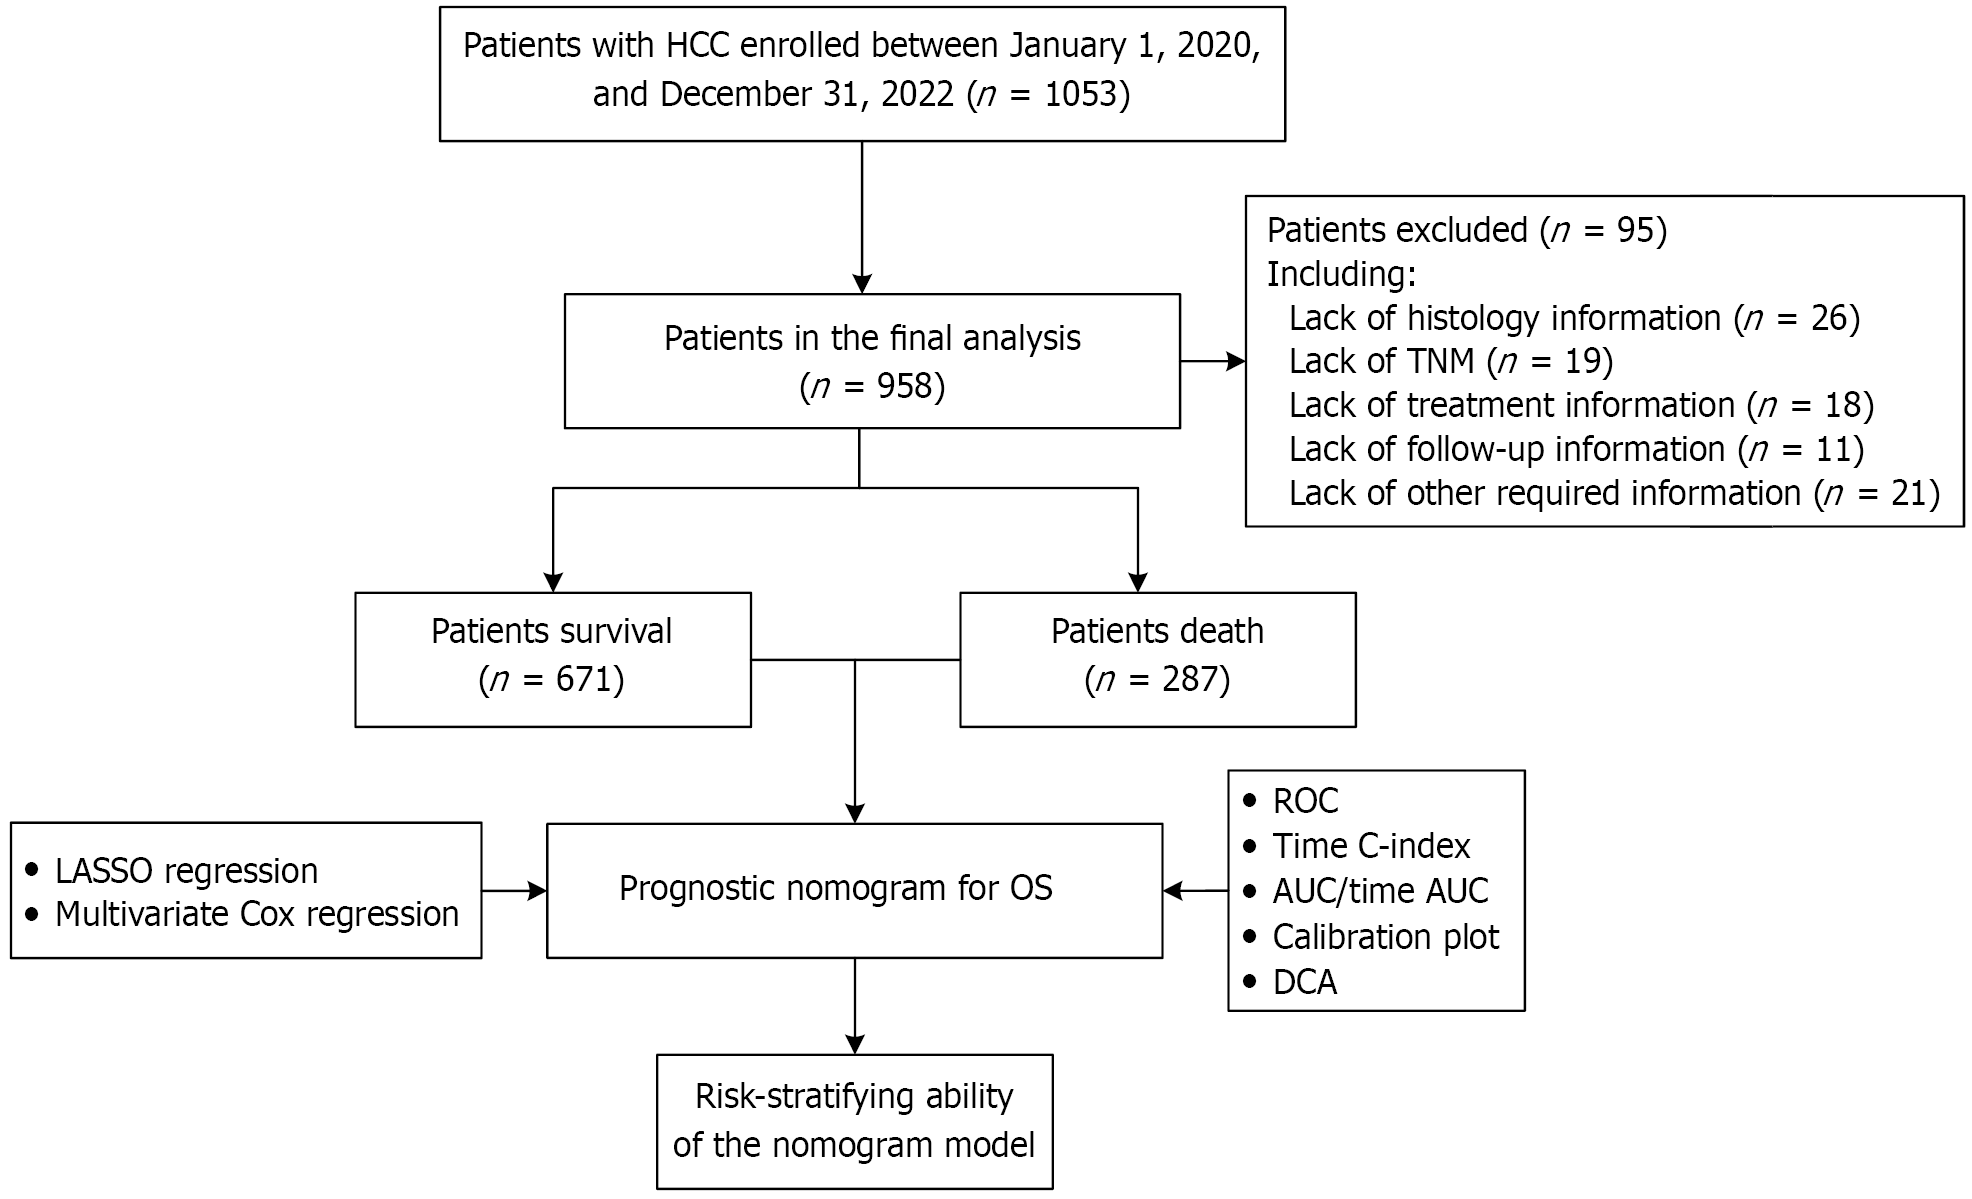
Figure 1 Flow chart of the patients enrolled in the final study cohorts.
AUC: Area under the receiver operating characteristic curve; DCA: Decision curve analysis; HCC: Hepatocellular carcinoma; LASSO: Least absolute shrinkage and selection operator; OS: Overall survival; ROC: Receiver operating cha
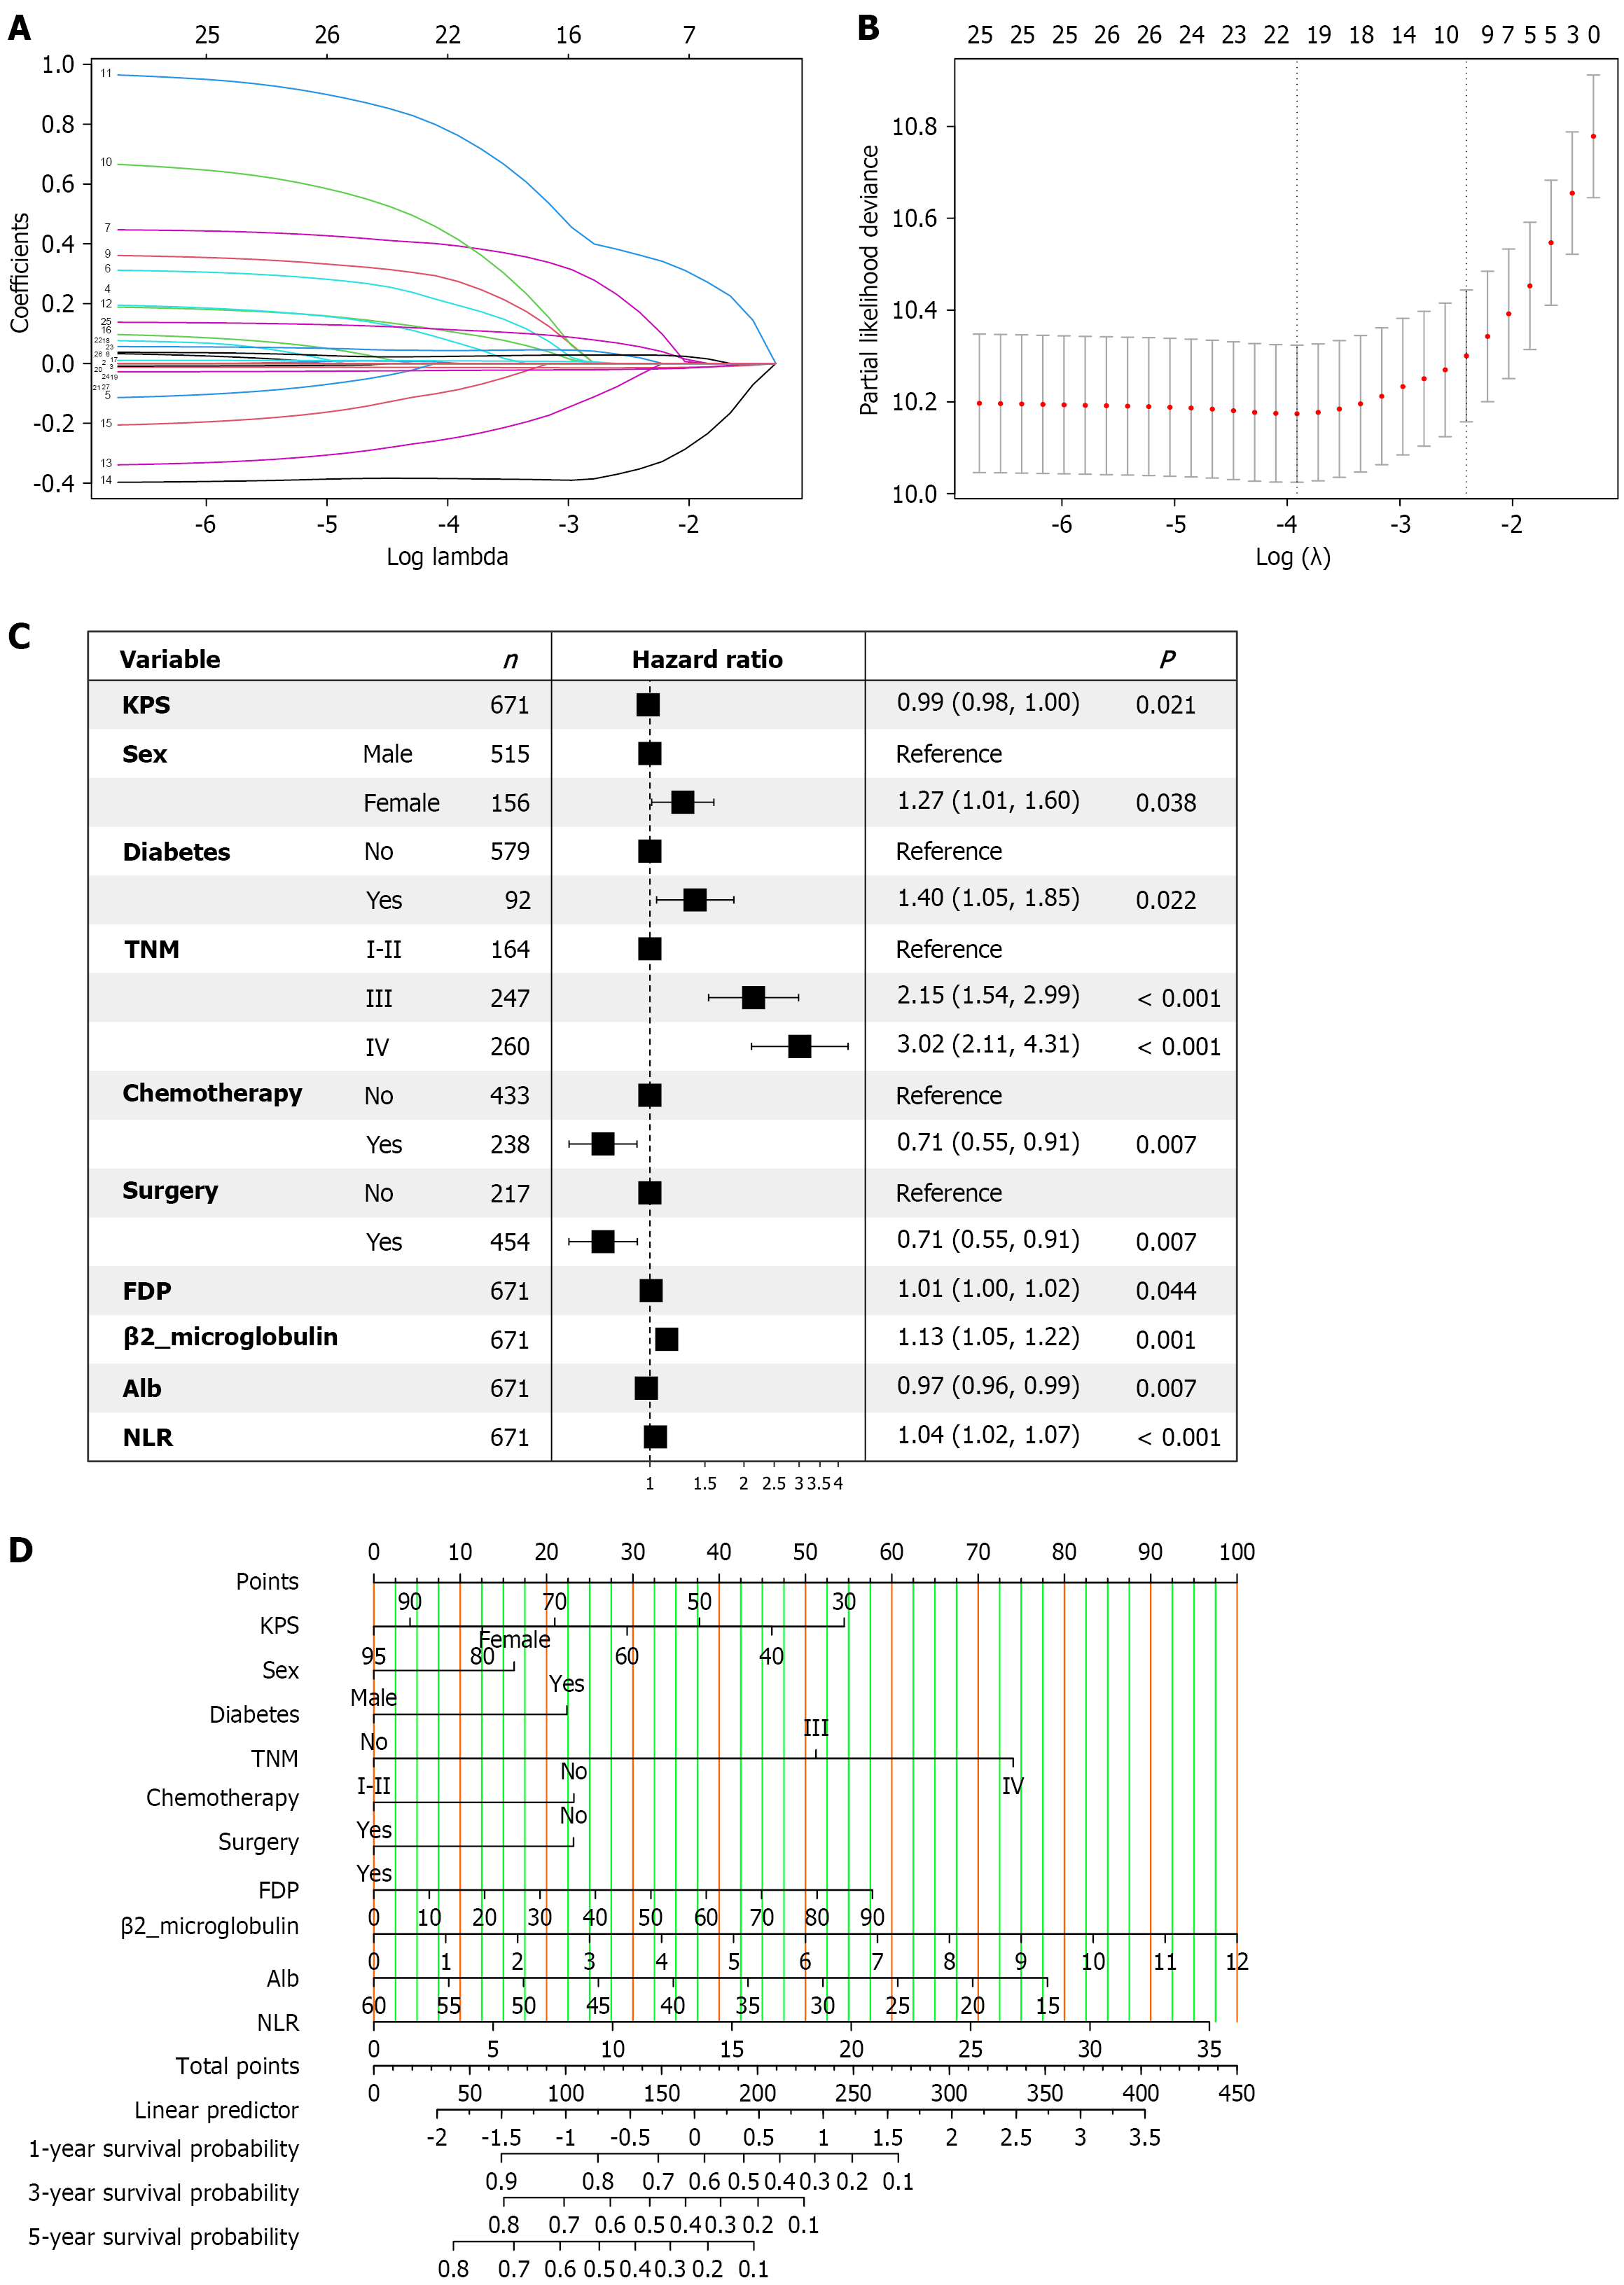
Figure 2 Results of the prognostic nomogram for overall survival.
A: Construction of a predictive model of hepatocellular carcinoma in the dataset by least absolute shrinkage and selection operator regression; B: Each curve in the figure represents the changed trajectory of each independent variable coefficient; C: The hazard ratio plot of stepwise multivariate Cox regression; D: Nomogram for predicting the 1-year, 3-year, and 5-year overall survival of hepatocellular carcinoma patients. Alb: Albumin; FDP: Fibrinogen degradation products; KPS: Karnofsky performance status; NLR: Neutrophil-to-lymphocyte ratio; TNM: Tumor node metastasis.
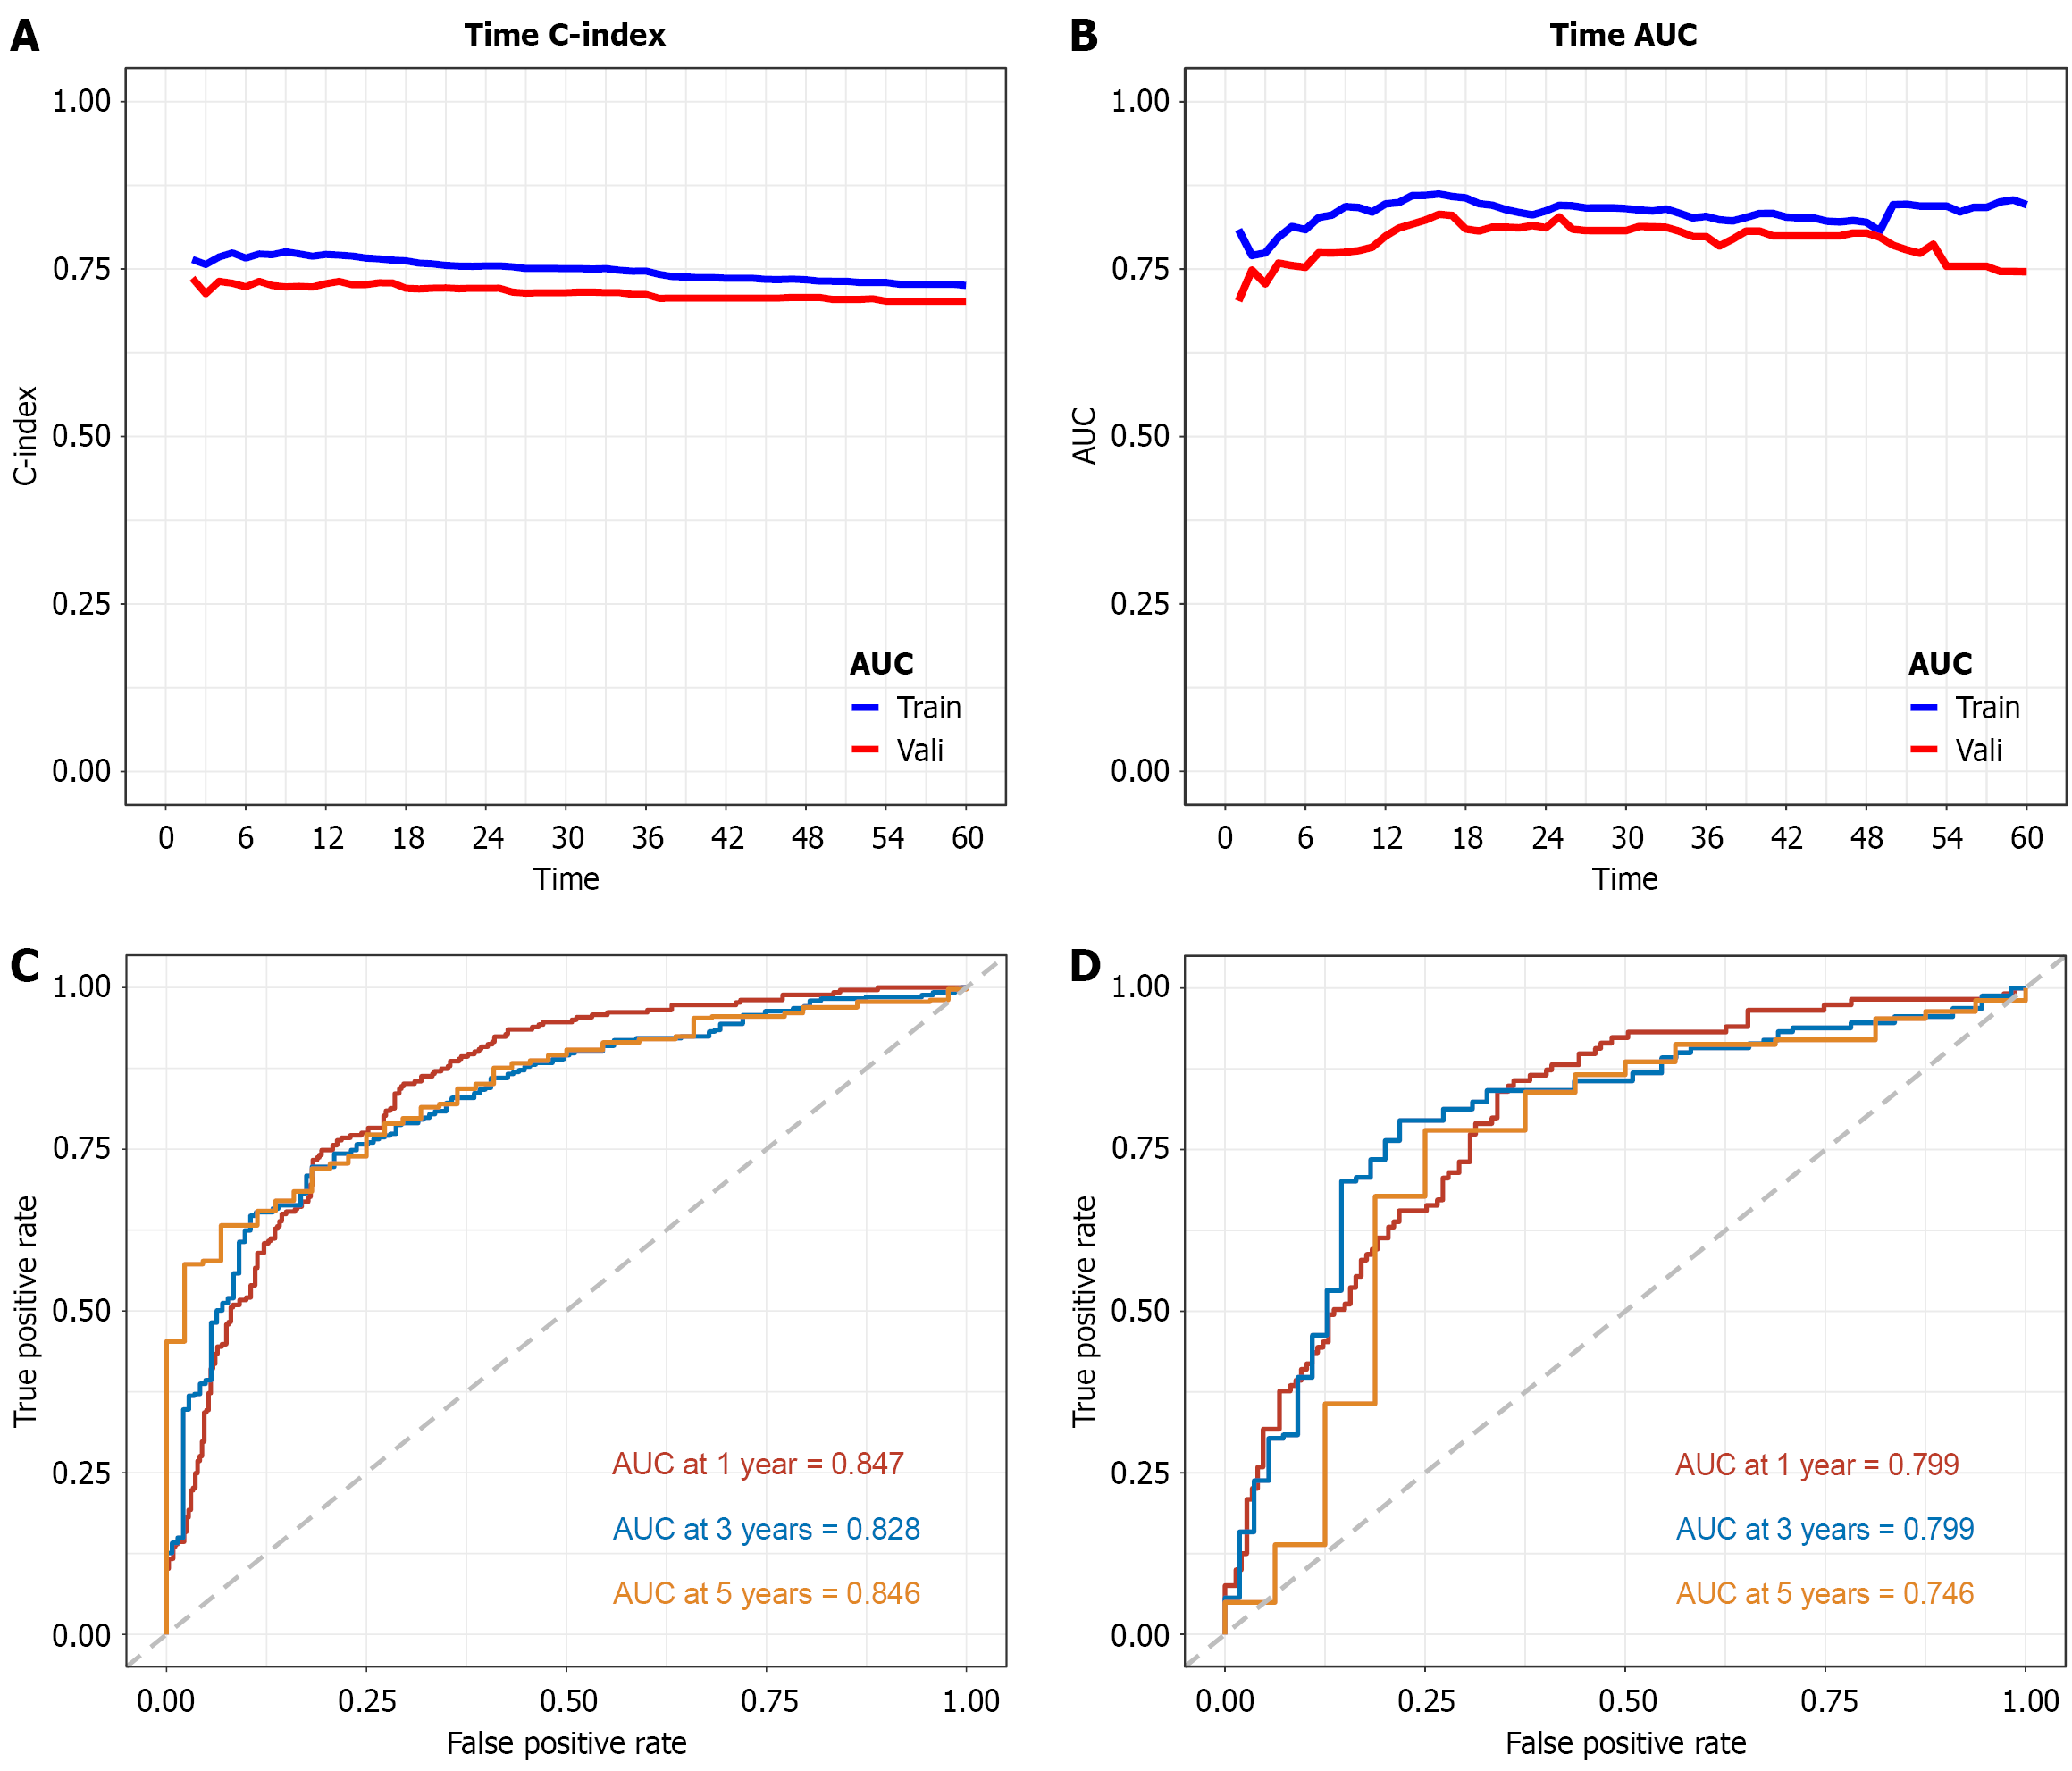
Figure 3 The generalization ability of the nomogram model.
A: The time-dependent concordance index of the nomogram model; B: The time-dependent area under the receiver operating characteristic curve of the nomogram model; C: The 1-year, 3-year and 5-year receiver operating characteristic curves for the nomogram model in the training set; D: The 1-year, 3-year and 5-year receiver operating characteristic curves for nomogram model in the validation set. AUC: Area under the receiver operating characteristic curve.
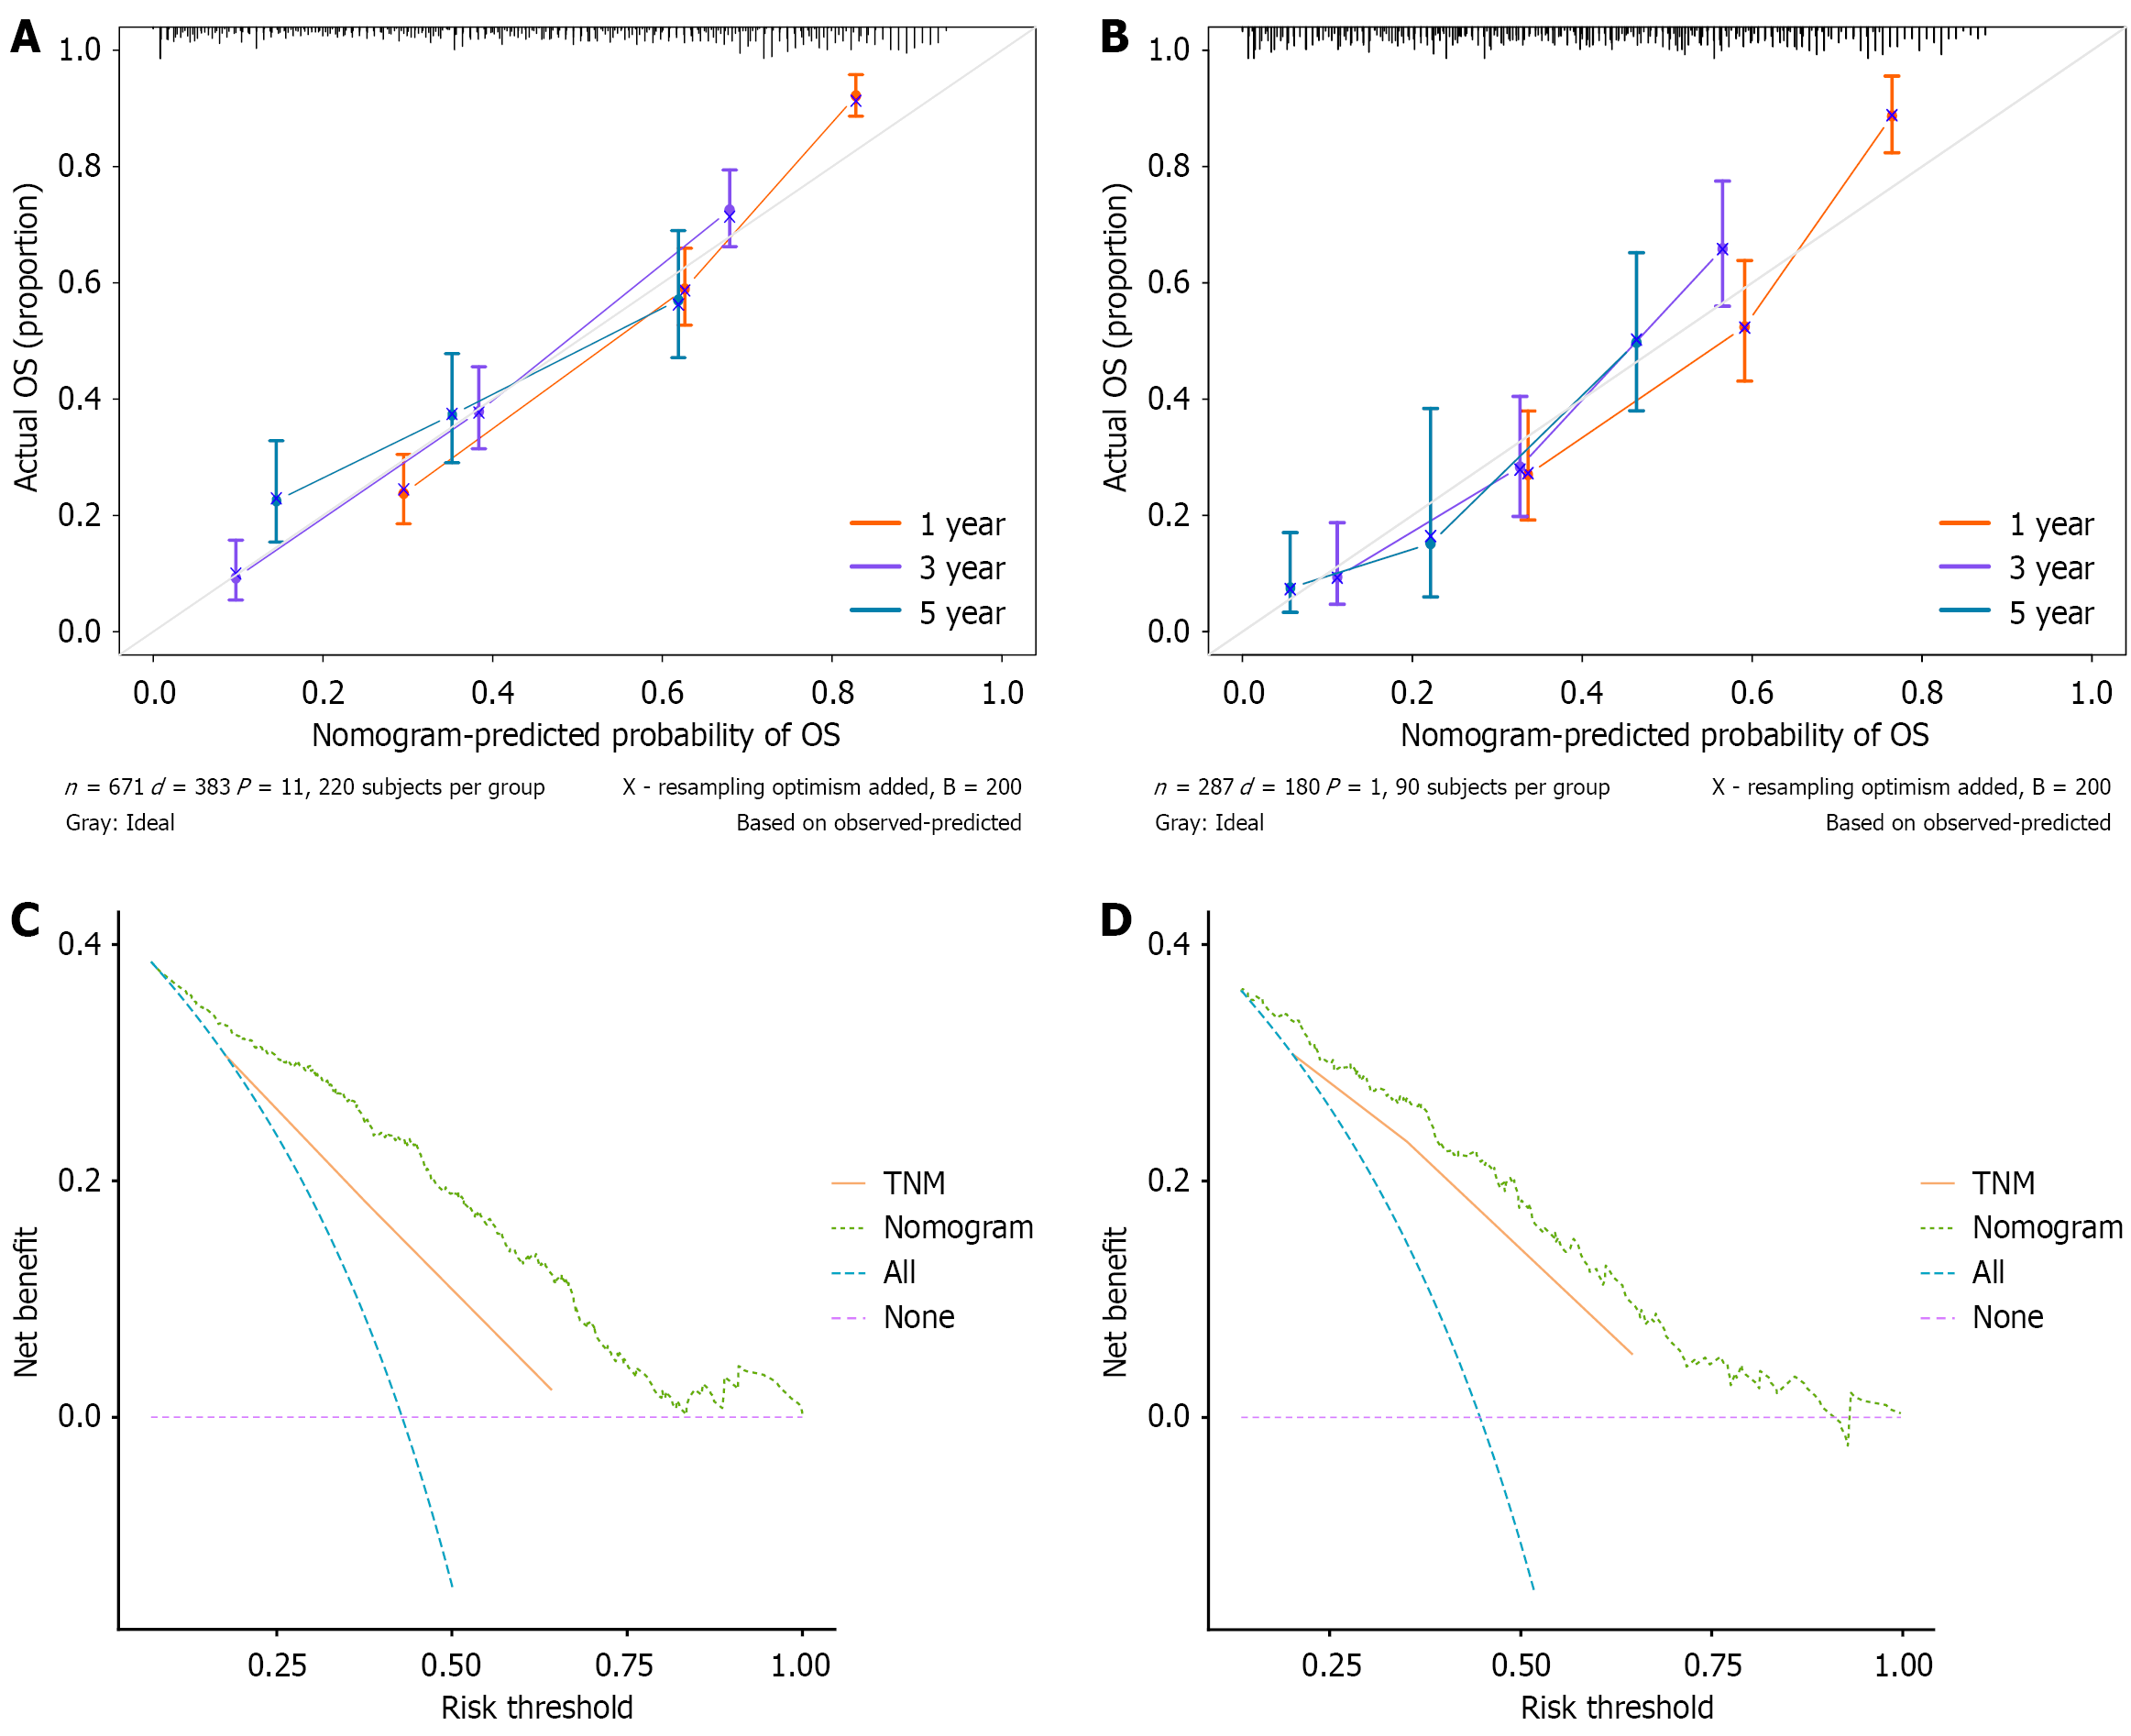
Figure 4 The prediction accuracy and clinical application value of the nomogram model.
A: The 1-year, 3-year, and 5-year calibration curves of the nomogram model in the training set; B: The 1-year, 3-year, and 5-year calibration curves of the nomogram model in the validation set; C: The 1-year, 3-year, and 5-year decision curve analysis curves for nomogram models in the training set; D: The 1-year, 3-year, and 5-year decision curve analysis curves for nomogram models in the validation set. OS: Overall survival; TNM: Tumor node metastasis.
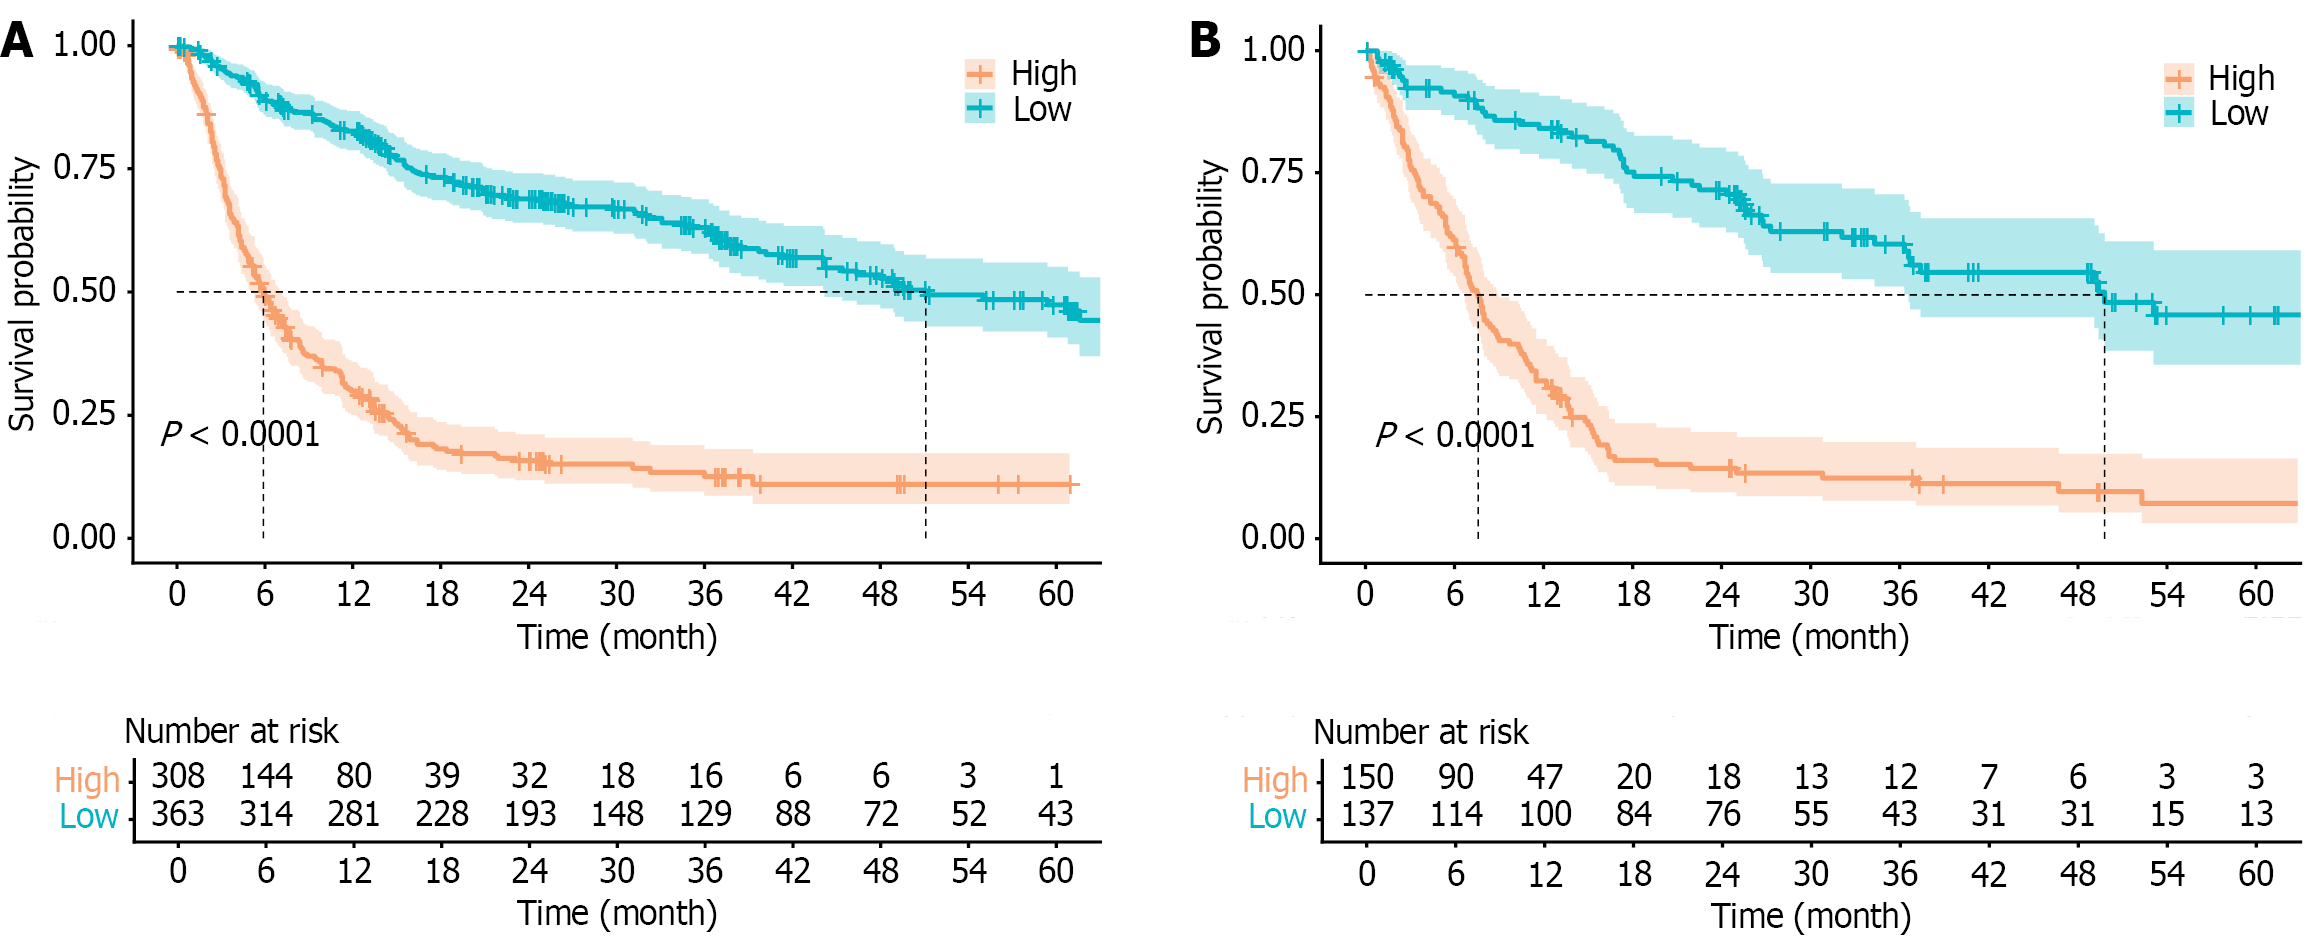
Figure 5 Kaplan-Meier curves of different risk levels to estimate the overall survival of patients in two groups.
A: Training set; B: Validation set.
- Citation: Tan JY, Yang JX, Xu QJ, Zhao YL, Zhang W, Li XS. Prognostic nomogram model for overall survival in patients with hepatocellular carcinoma. World J Gastrointest Oncol 2026; 18(7): 120724
- URL: https://www.wjgnet.com/1948-5204/full/v18/i7/120724.htm
- DOI: https://dx.doi.org/10.4251/wjgo.120724