
















Copyright: ©Author(s) 2026.
World J Gastrointest Oncol. Jul 15, 2026; 18(7): 120582
Published online Jul 15, 2026. doi: 10.4251/wjgo.120582
Published online Jul 15, 2026. doi: 10.4251/wjgo.120582
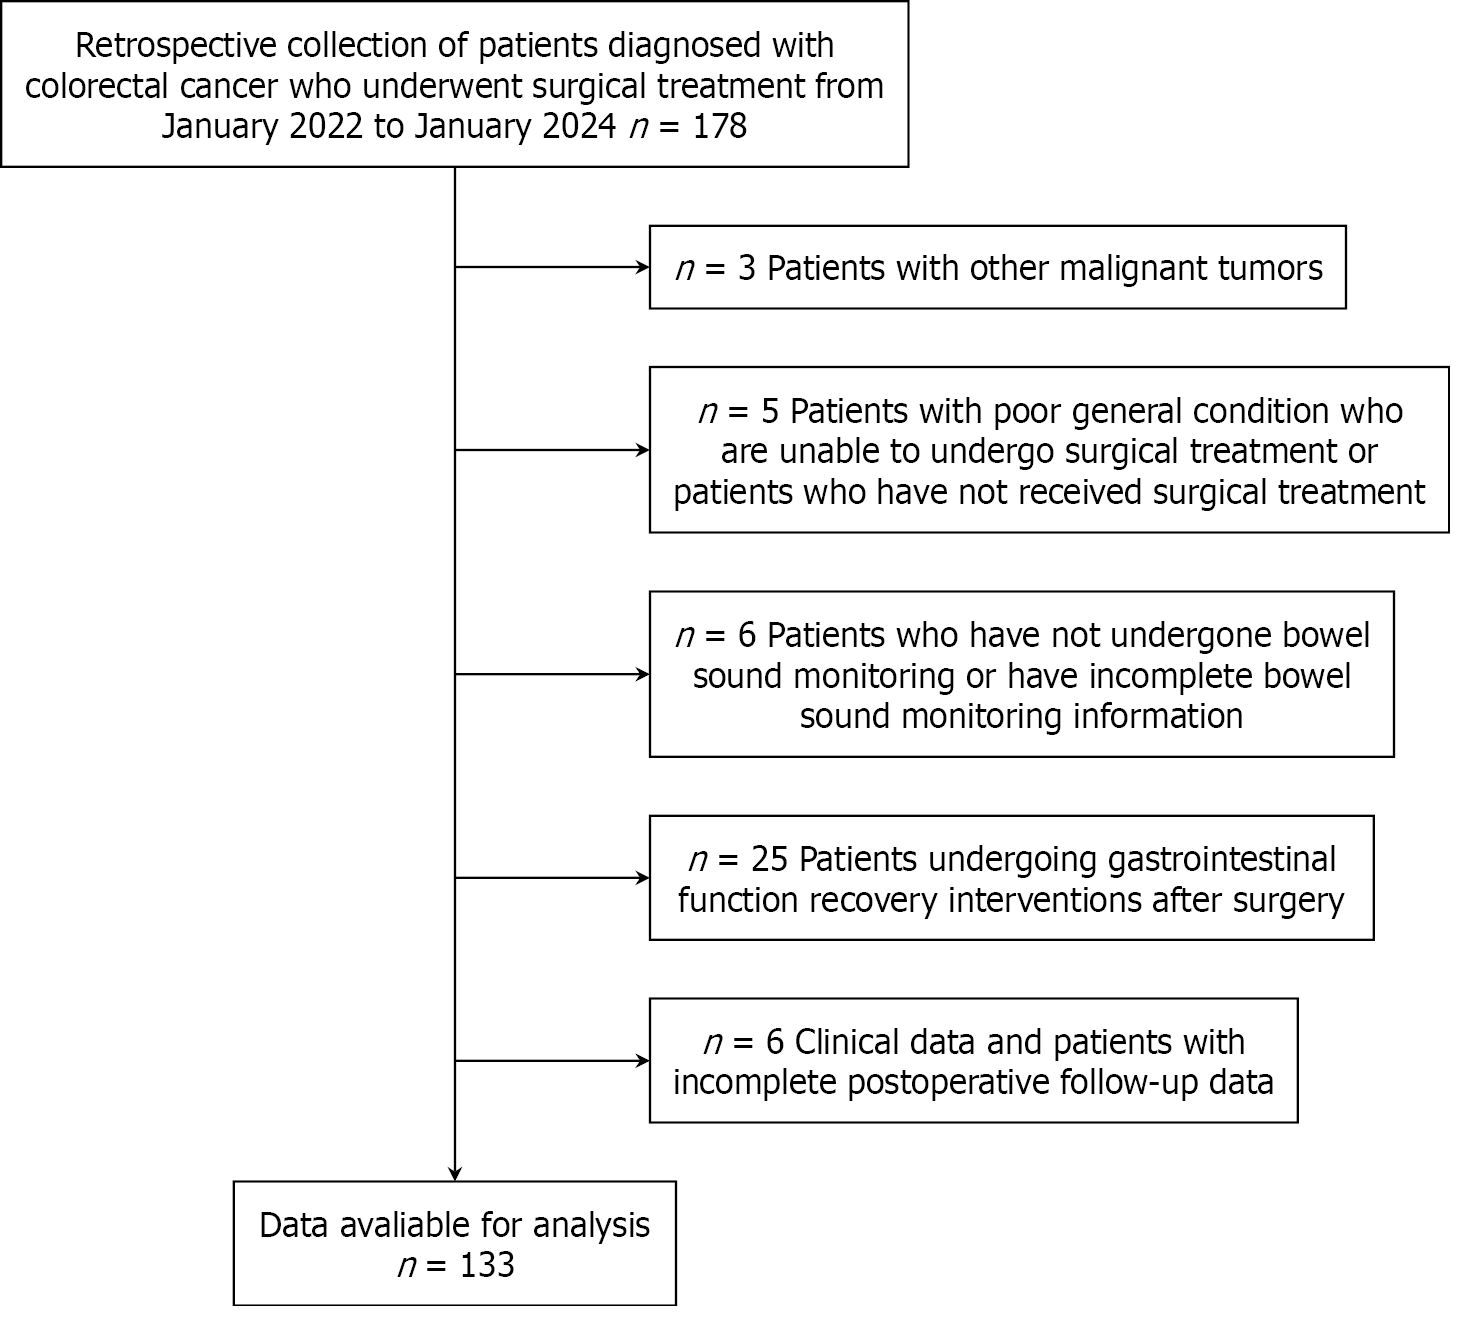
Figure 1
Patient screening flowchart.
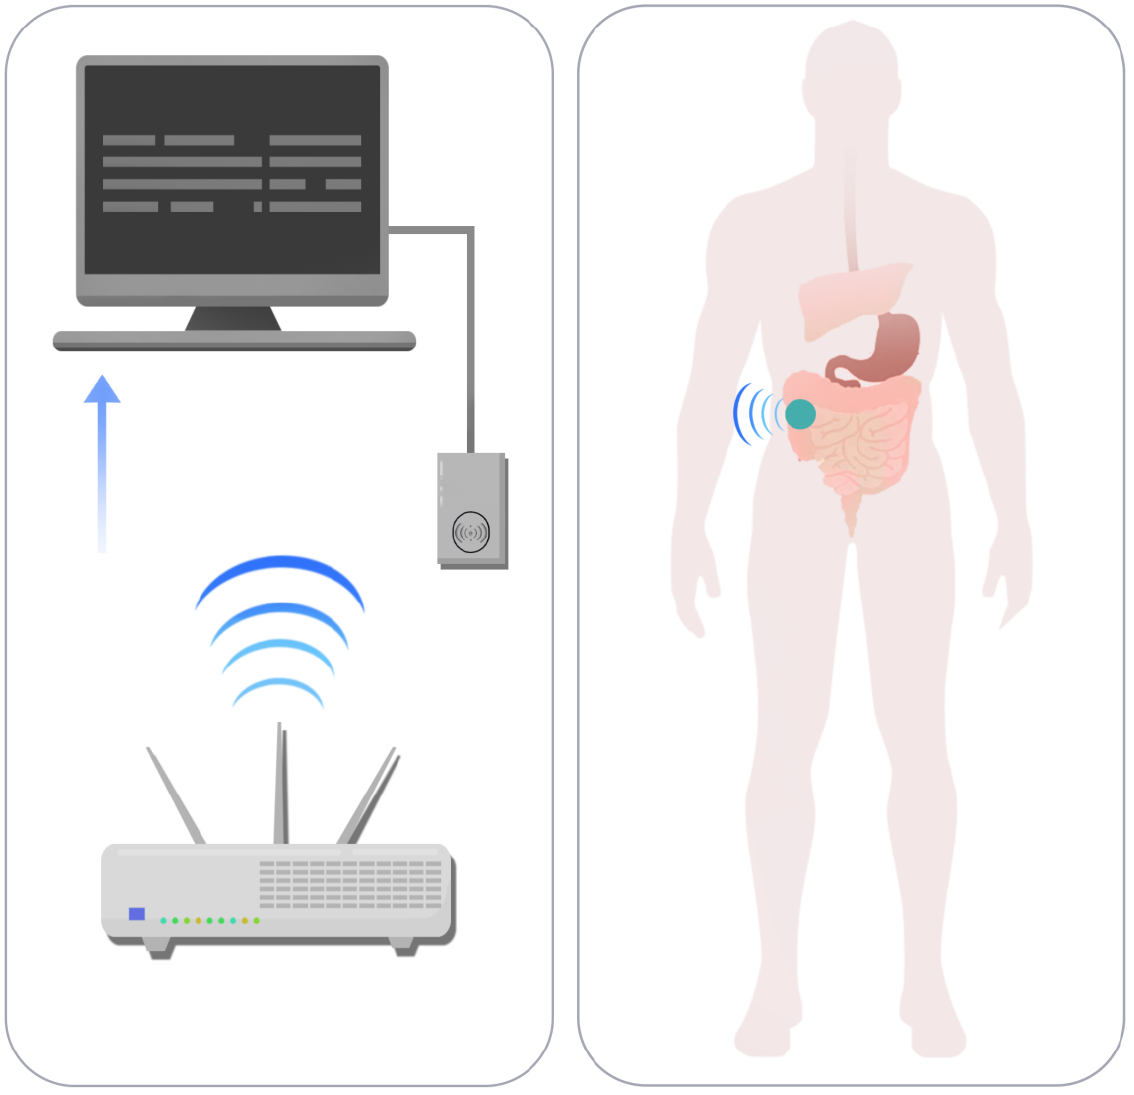
Figure 2 Schematic diagram of wireless bowel sound acquisition.
After registering the intestinal sound patch, it is attached to the patient’s lower right abdomen for long-term wireless collection, and the data is transmitted to the computer for real-time analysis of intestinal sound characteristics.
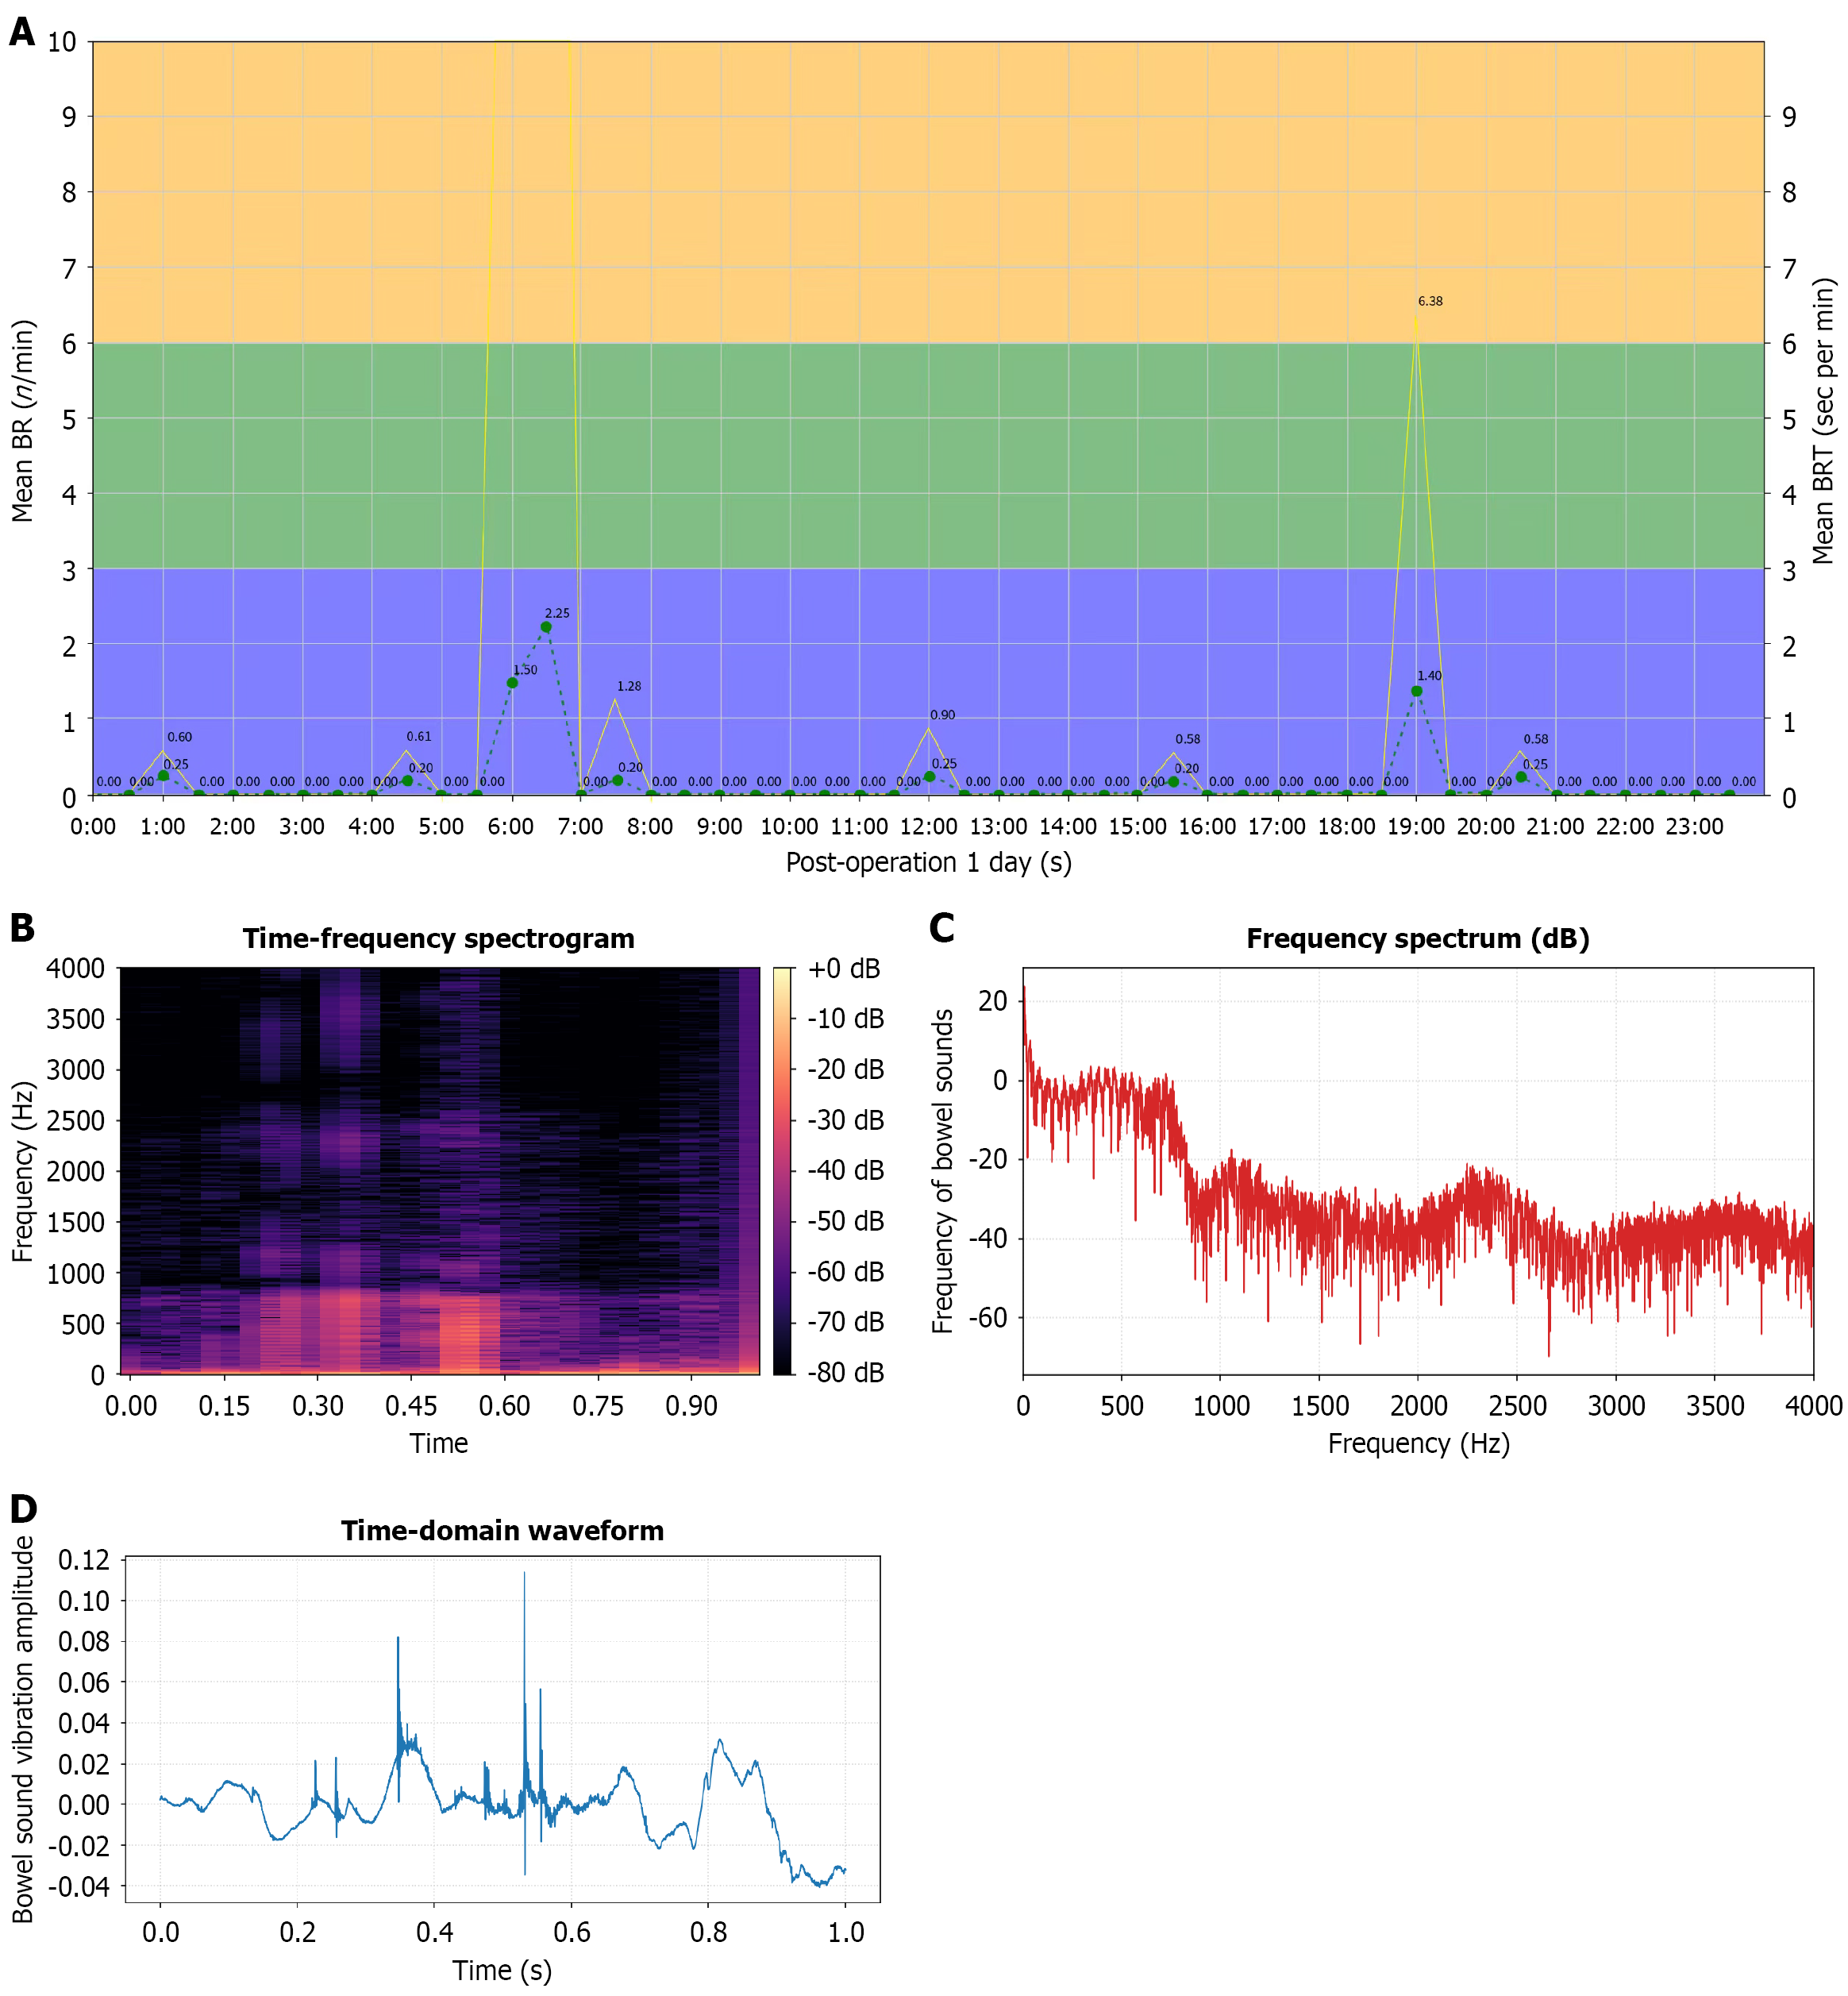
Figure 3 Characteristics of intestinal sounds diagram display.
A: Diagram showing changes in the number of bowel sounds at different times on post-operation 1 day, where blue represents the area of weakened intestinal sounds, green represents the area of normal intestinal sounds, and yellow represents the area of increased intestinal sounds; B: Frequency of chart of intestinal sounds, showing the relationship between detected intestinal sounds and time over a period; C: Display of frequency of bowel sounds analysis; D: Display of bowel sound vibration amplitude analysis. BR: Bowel rate.
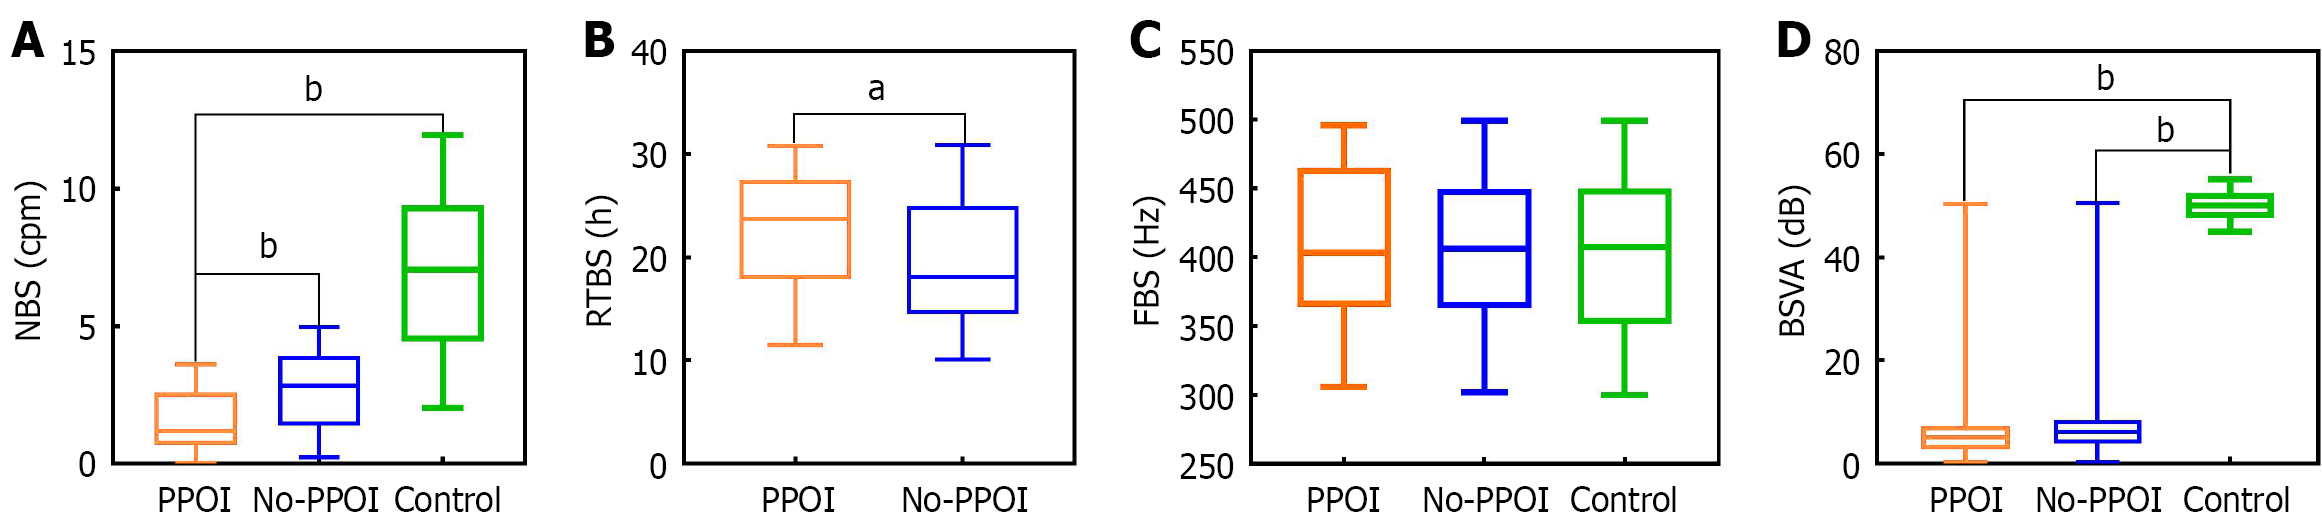
Figure 4 Comparison chart of bowel sounds indicators on the first postoperative day among different groups of patients.
A: Comparison of number of bowel sounds differences on the first postoperative day, with significant differences between the prolonged postoperative ileus (PPOI) group and the no-PPOI group as well as the blank control group; B: Comparison of recovery time of bowel sounds differences, with significant differences between the PPOI group and the no-PPOI group; C: Comparison of FBS differences on the first postoperative day, with no significant differences among the PPOI group, no-PPOI group, and blank control group; D: Comparison of bowel sound vibration amplitude differences on the first postoperative day, with no statistical significance between the PPOI group and the no-PPOI group, but significant differences between the PPOI group and no-PPOI group compared to the blank control group. aP < 0.01; bP < 0.0001. NBS: Number of bowel sounds; cpm: Counts per minute; RTBS: Recovery time of bowel sounds; FBS: Frequency of bowel sounds; BSVA: Bowel sound vibration amplitude; PPOI: Prolonged postoperative ileus.
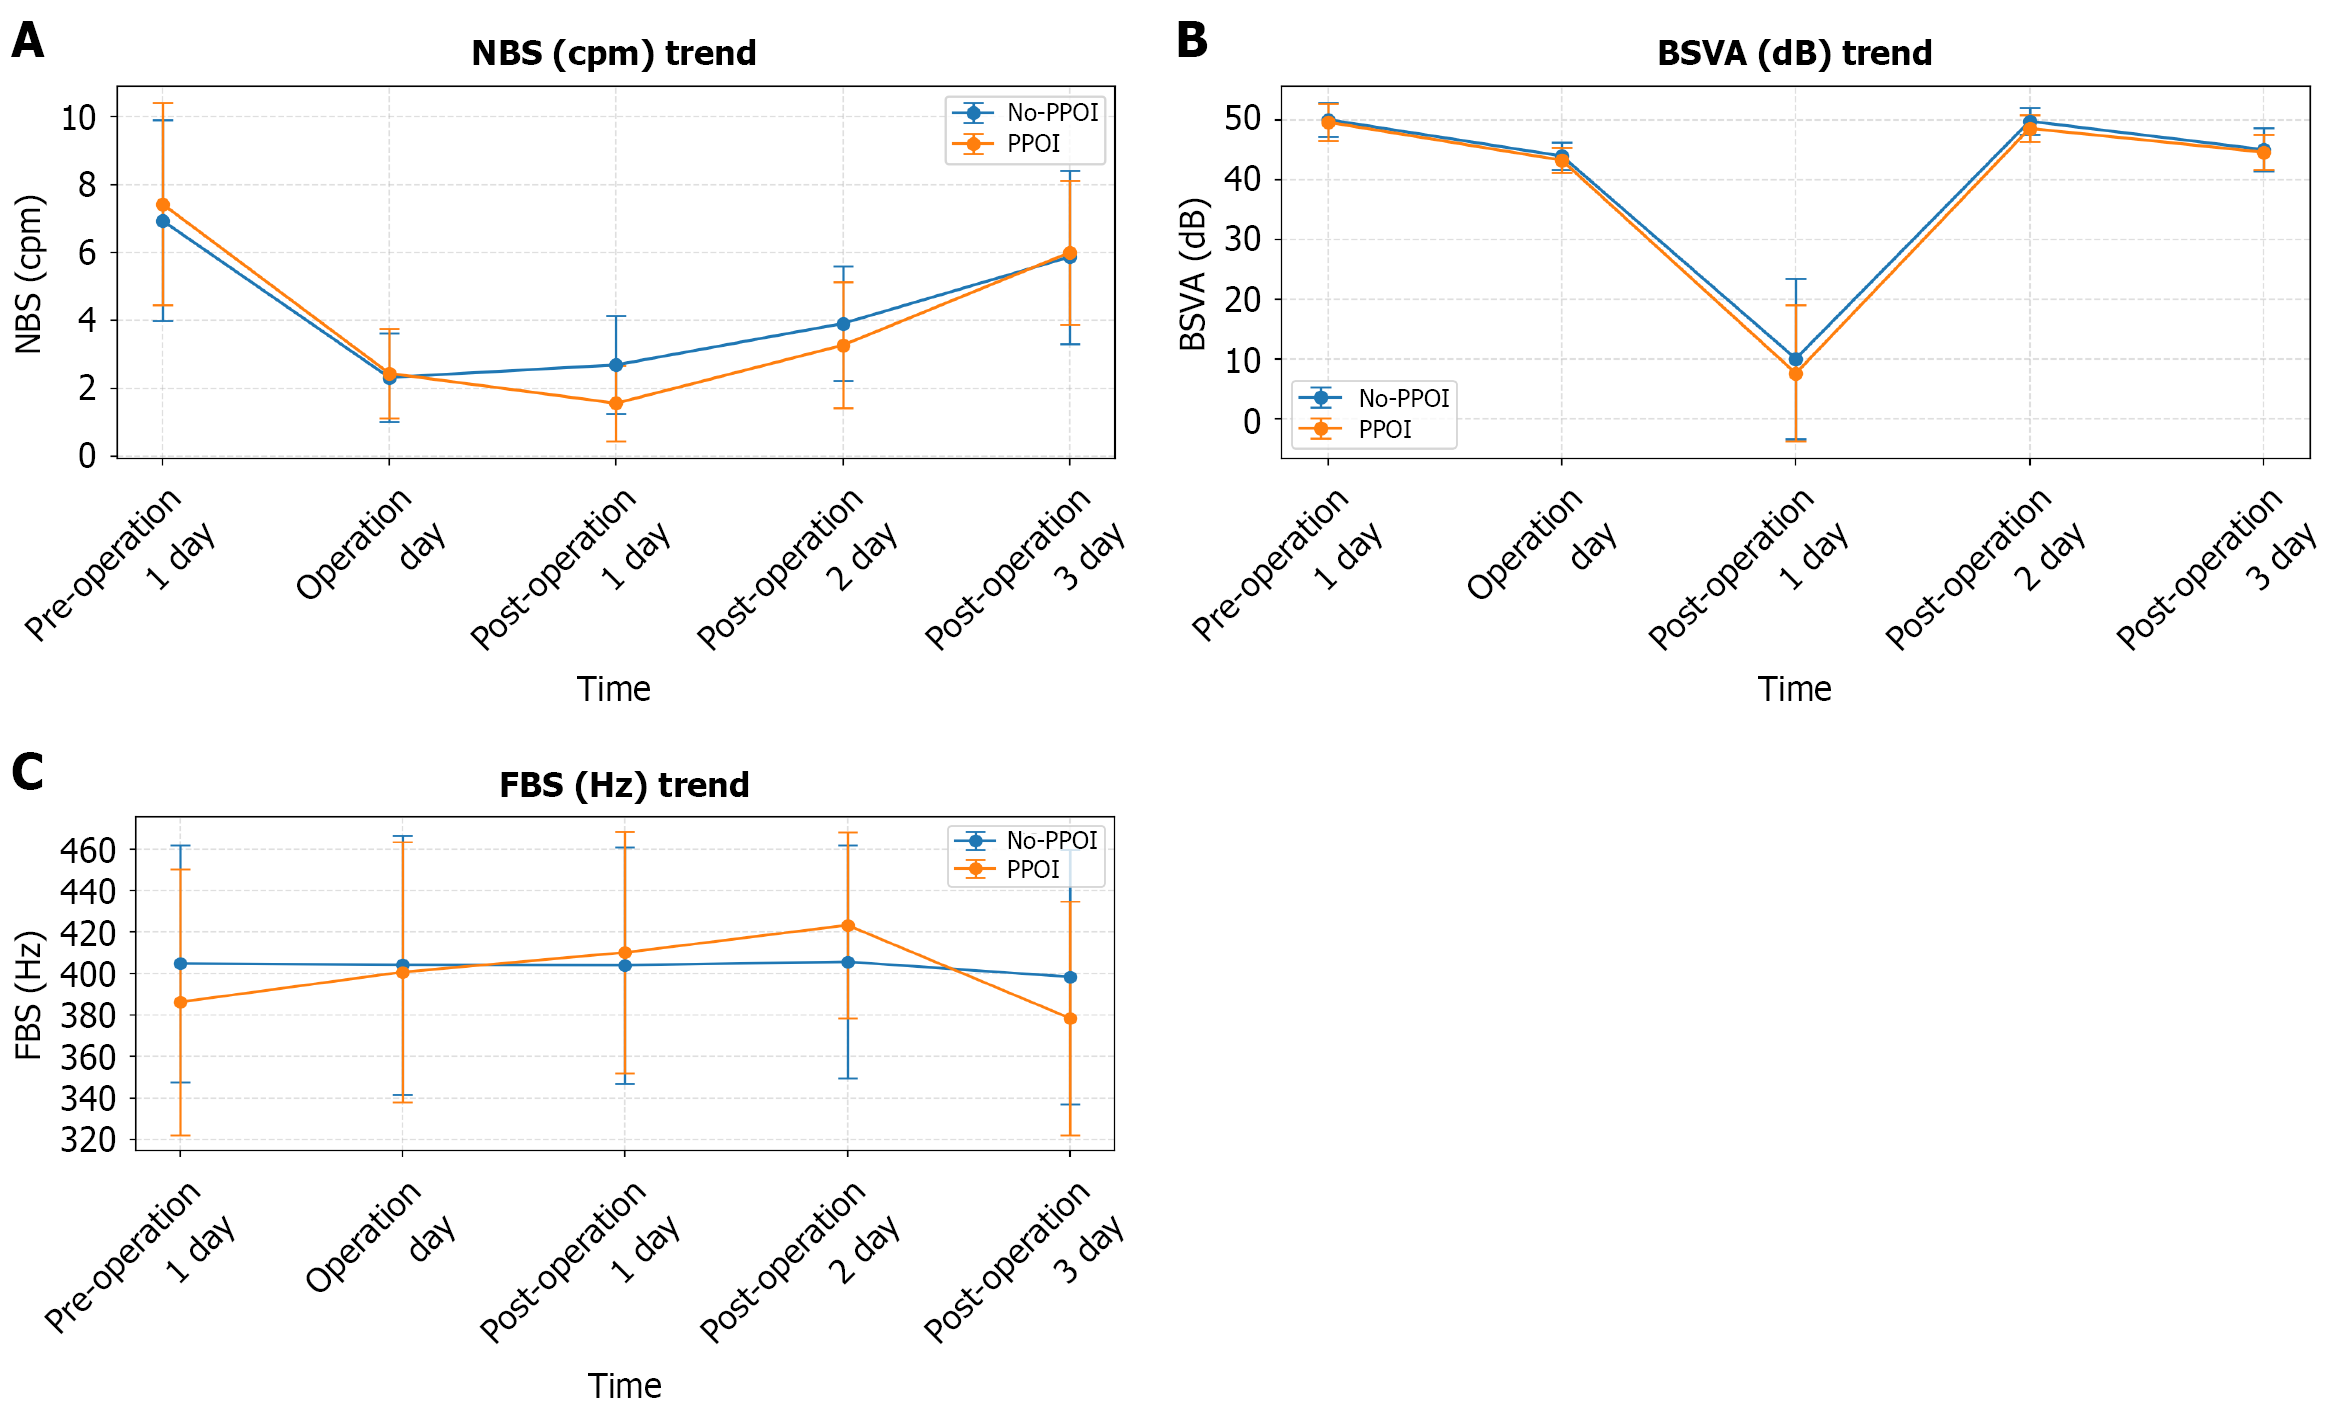
Figure 5 Trend chart of intestinal sounds characteristics at different time points.
A-C: Comparison of changes in numbers of bowel sounds (A) bowel sounds vibration amplitude (B) and frequency of bowel sounds (C) pre-operation, operation day, and post-operation 3 days in different groups of patients. NBS: Number of bowel sounds; cpm: Counts per minute; FBS: Frequency of bowel sounds; BSVA: Bowel sound vibration amplitude; PPOI: Prolonged postoperative ileus.
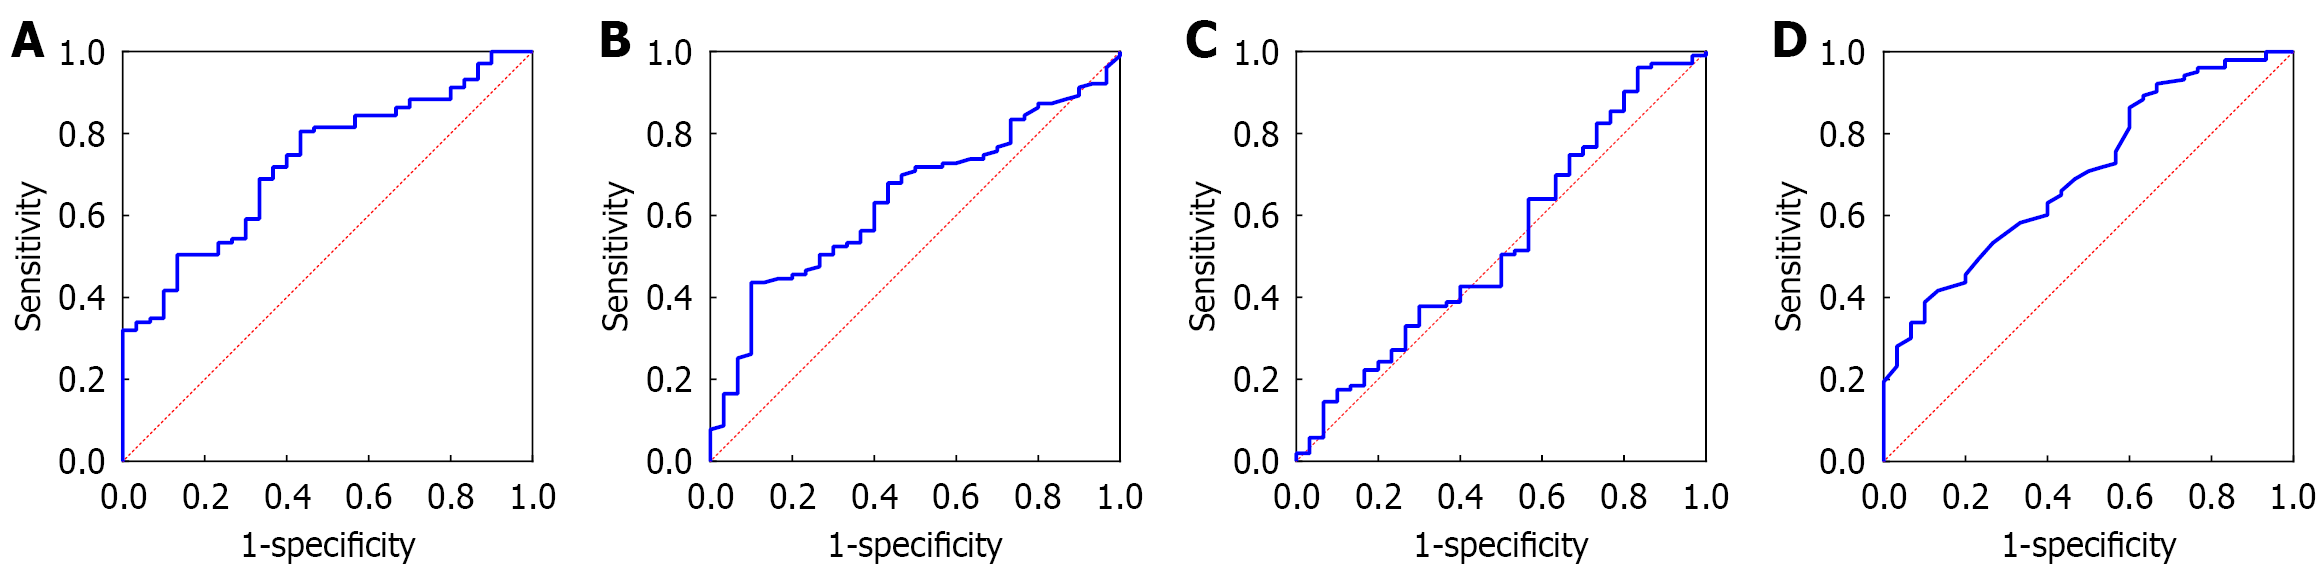
Figure 6 Analysis of the characteristics of bowel sounds and operation time on the cut-off values for predicting prolonged postoperative ileus.
A: Number of bowel sounds predictive value for prolonged postoperative ileus (PPOI), cut-off value is 1.201 counts per minute; sensitivity 56.67%, specificity 80.58%; B: Recovery time of bowel sounds predictive value for PPOI, cut-off value is 16.9 hours; sensitivity 90.00%, specificity 43.75%; C: Bowel sound vibration amplitude predictive value for postoperative PPOI, no statistically significant difference; D: Operative time predictive value for PPOI, cut-off value is 205 minutes; sensitivity 90.00%, specificity 38.83%.
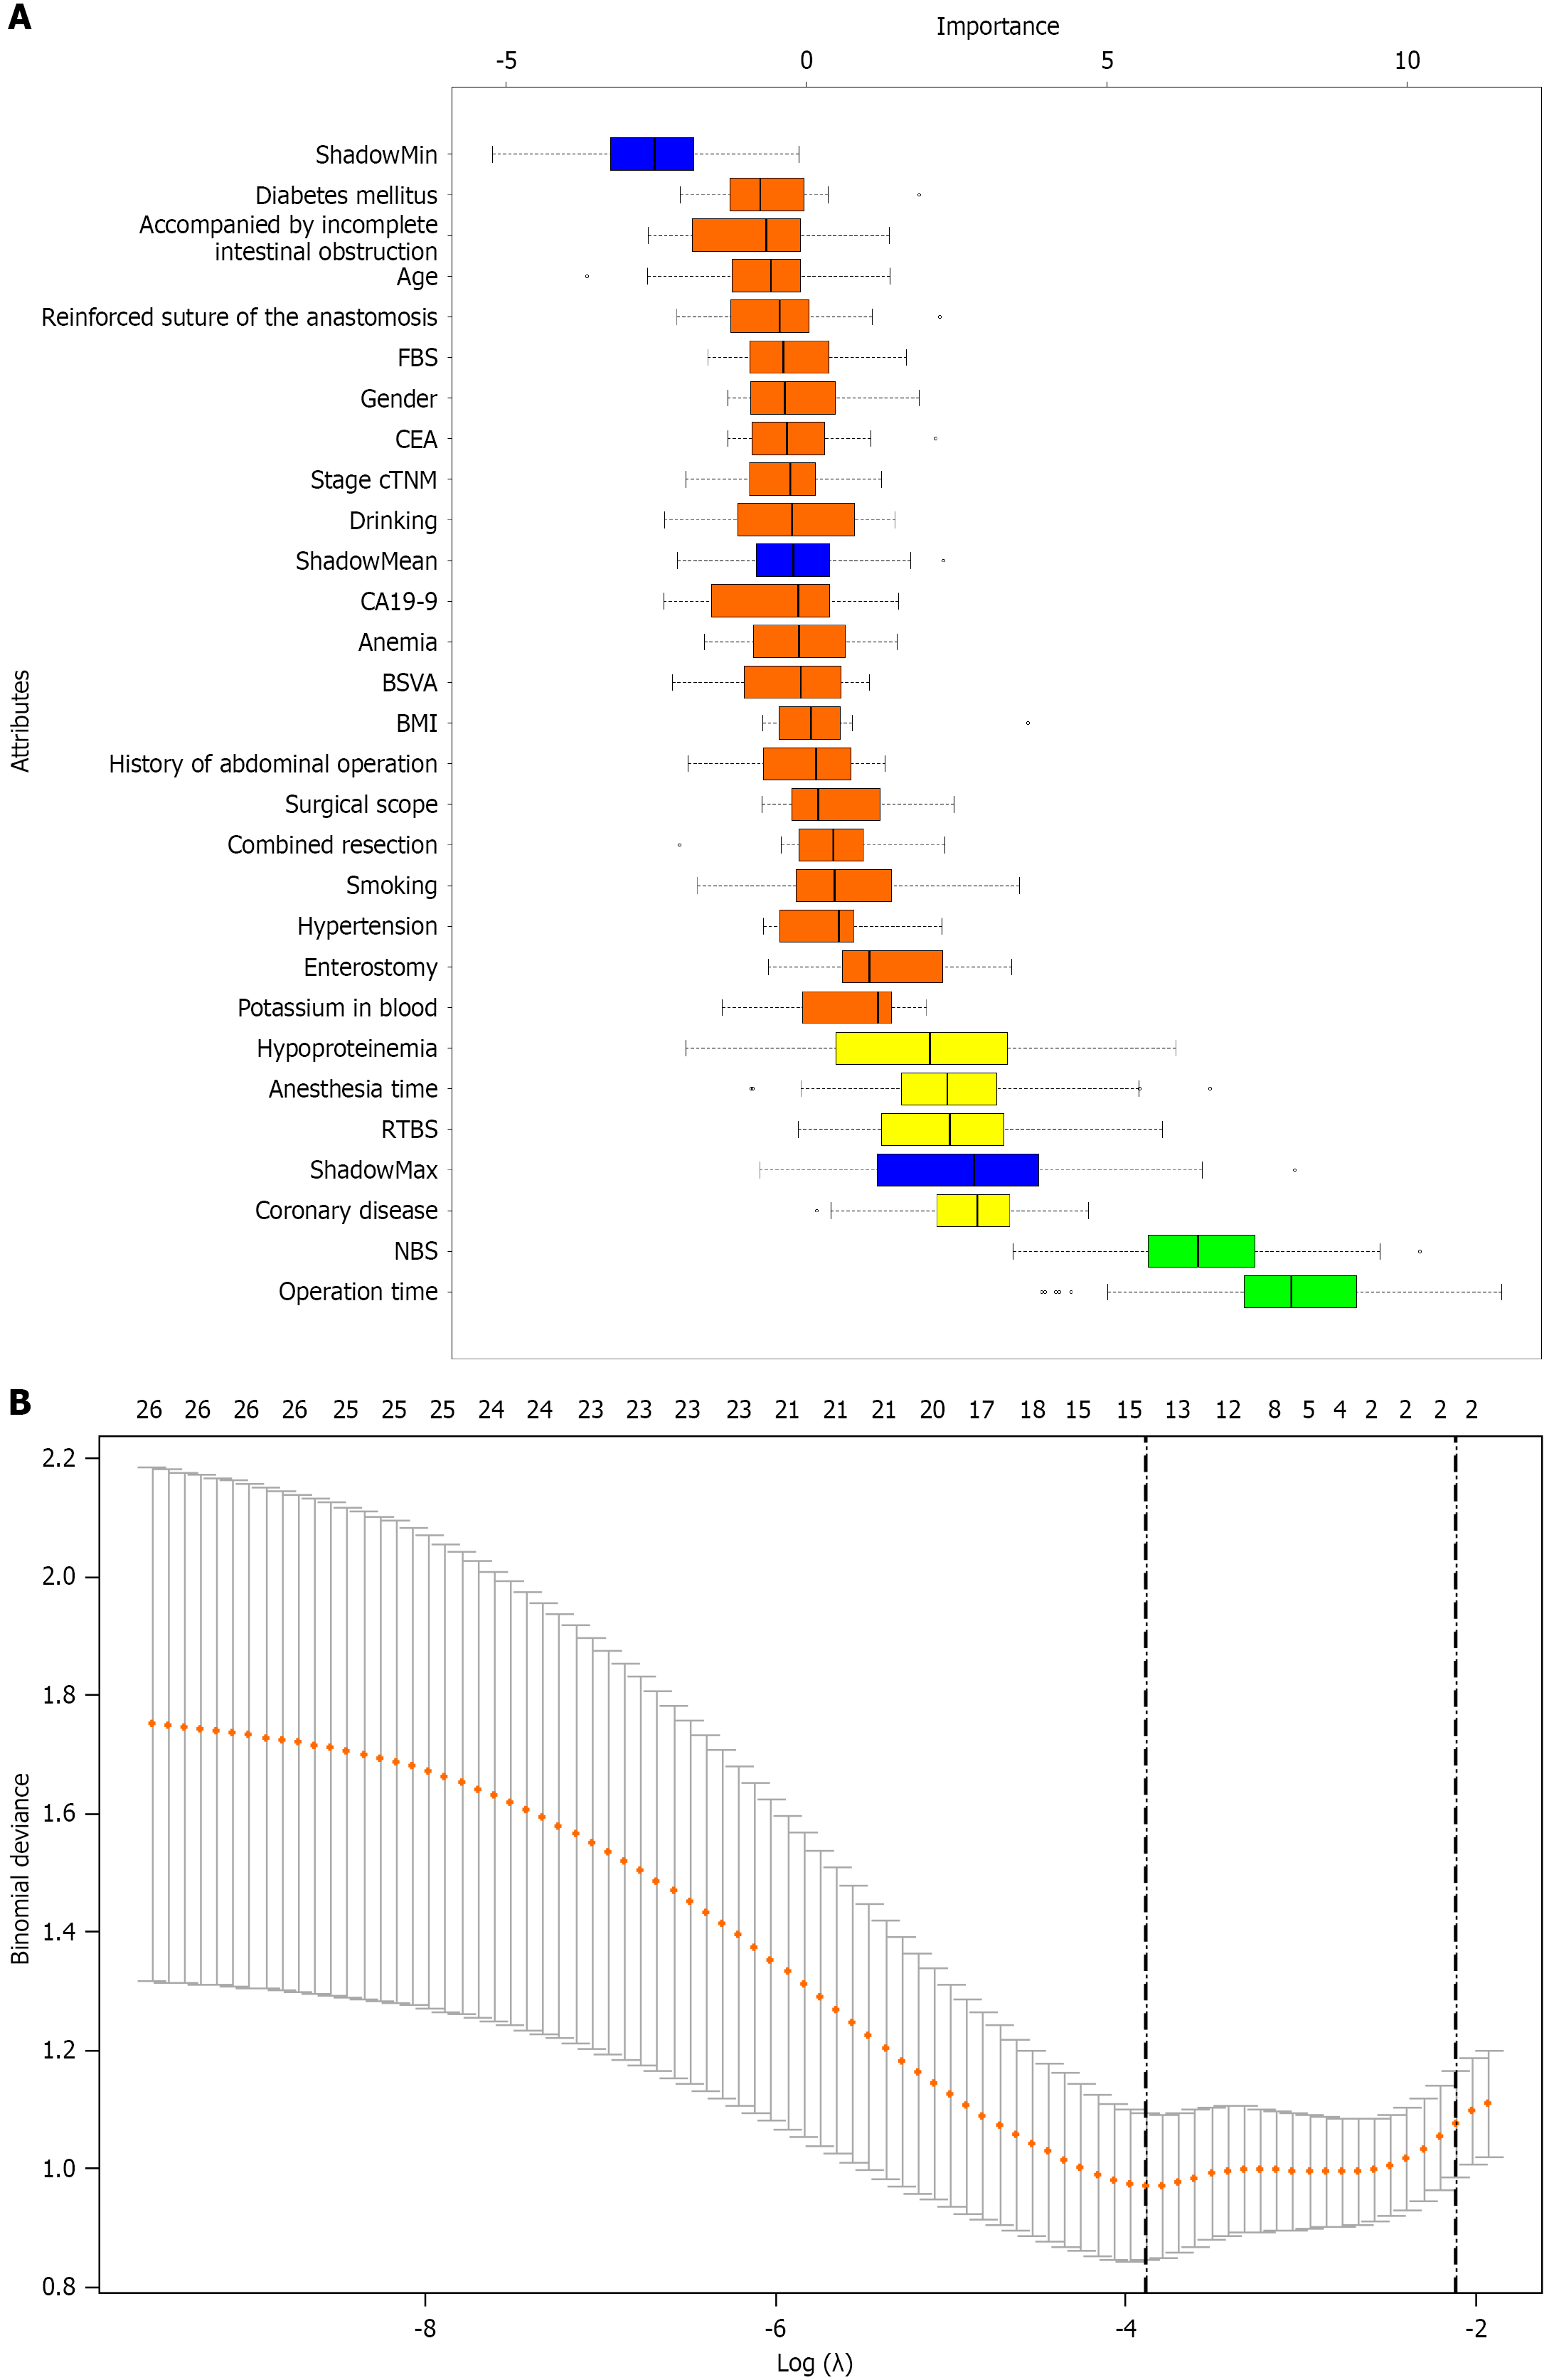
Figure 7 Variable screening schematic diagram.
A: Boruta analysis indicates that four variables—hypoproteinemia, recovery time of bowel sounds, number of bowel sounds, and operation time—were selected; B: The LASSO regression identified two variables, number of bowel sounds and operation time. FBS: Frequency of bowel sounds; CEA: Carcinoembryonic antigen; CA19-9: Carbohydrate antigen 19-9; BSVA: Bowel sound vibration amplitude; BMI: Body mass index; RTBS: Recovery time of bowel sounds; NBS: Number of bowel sounds.
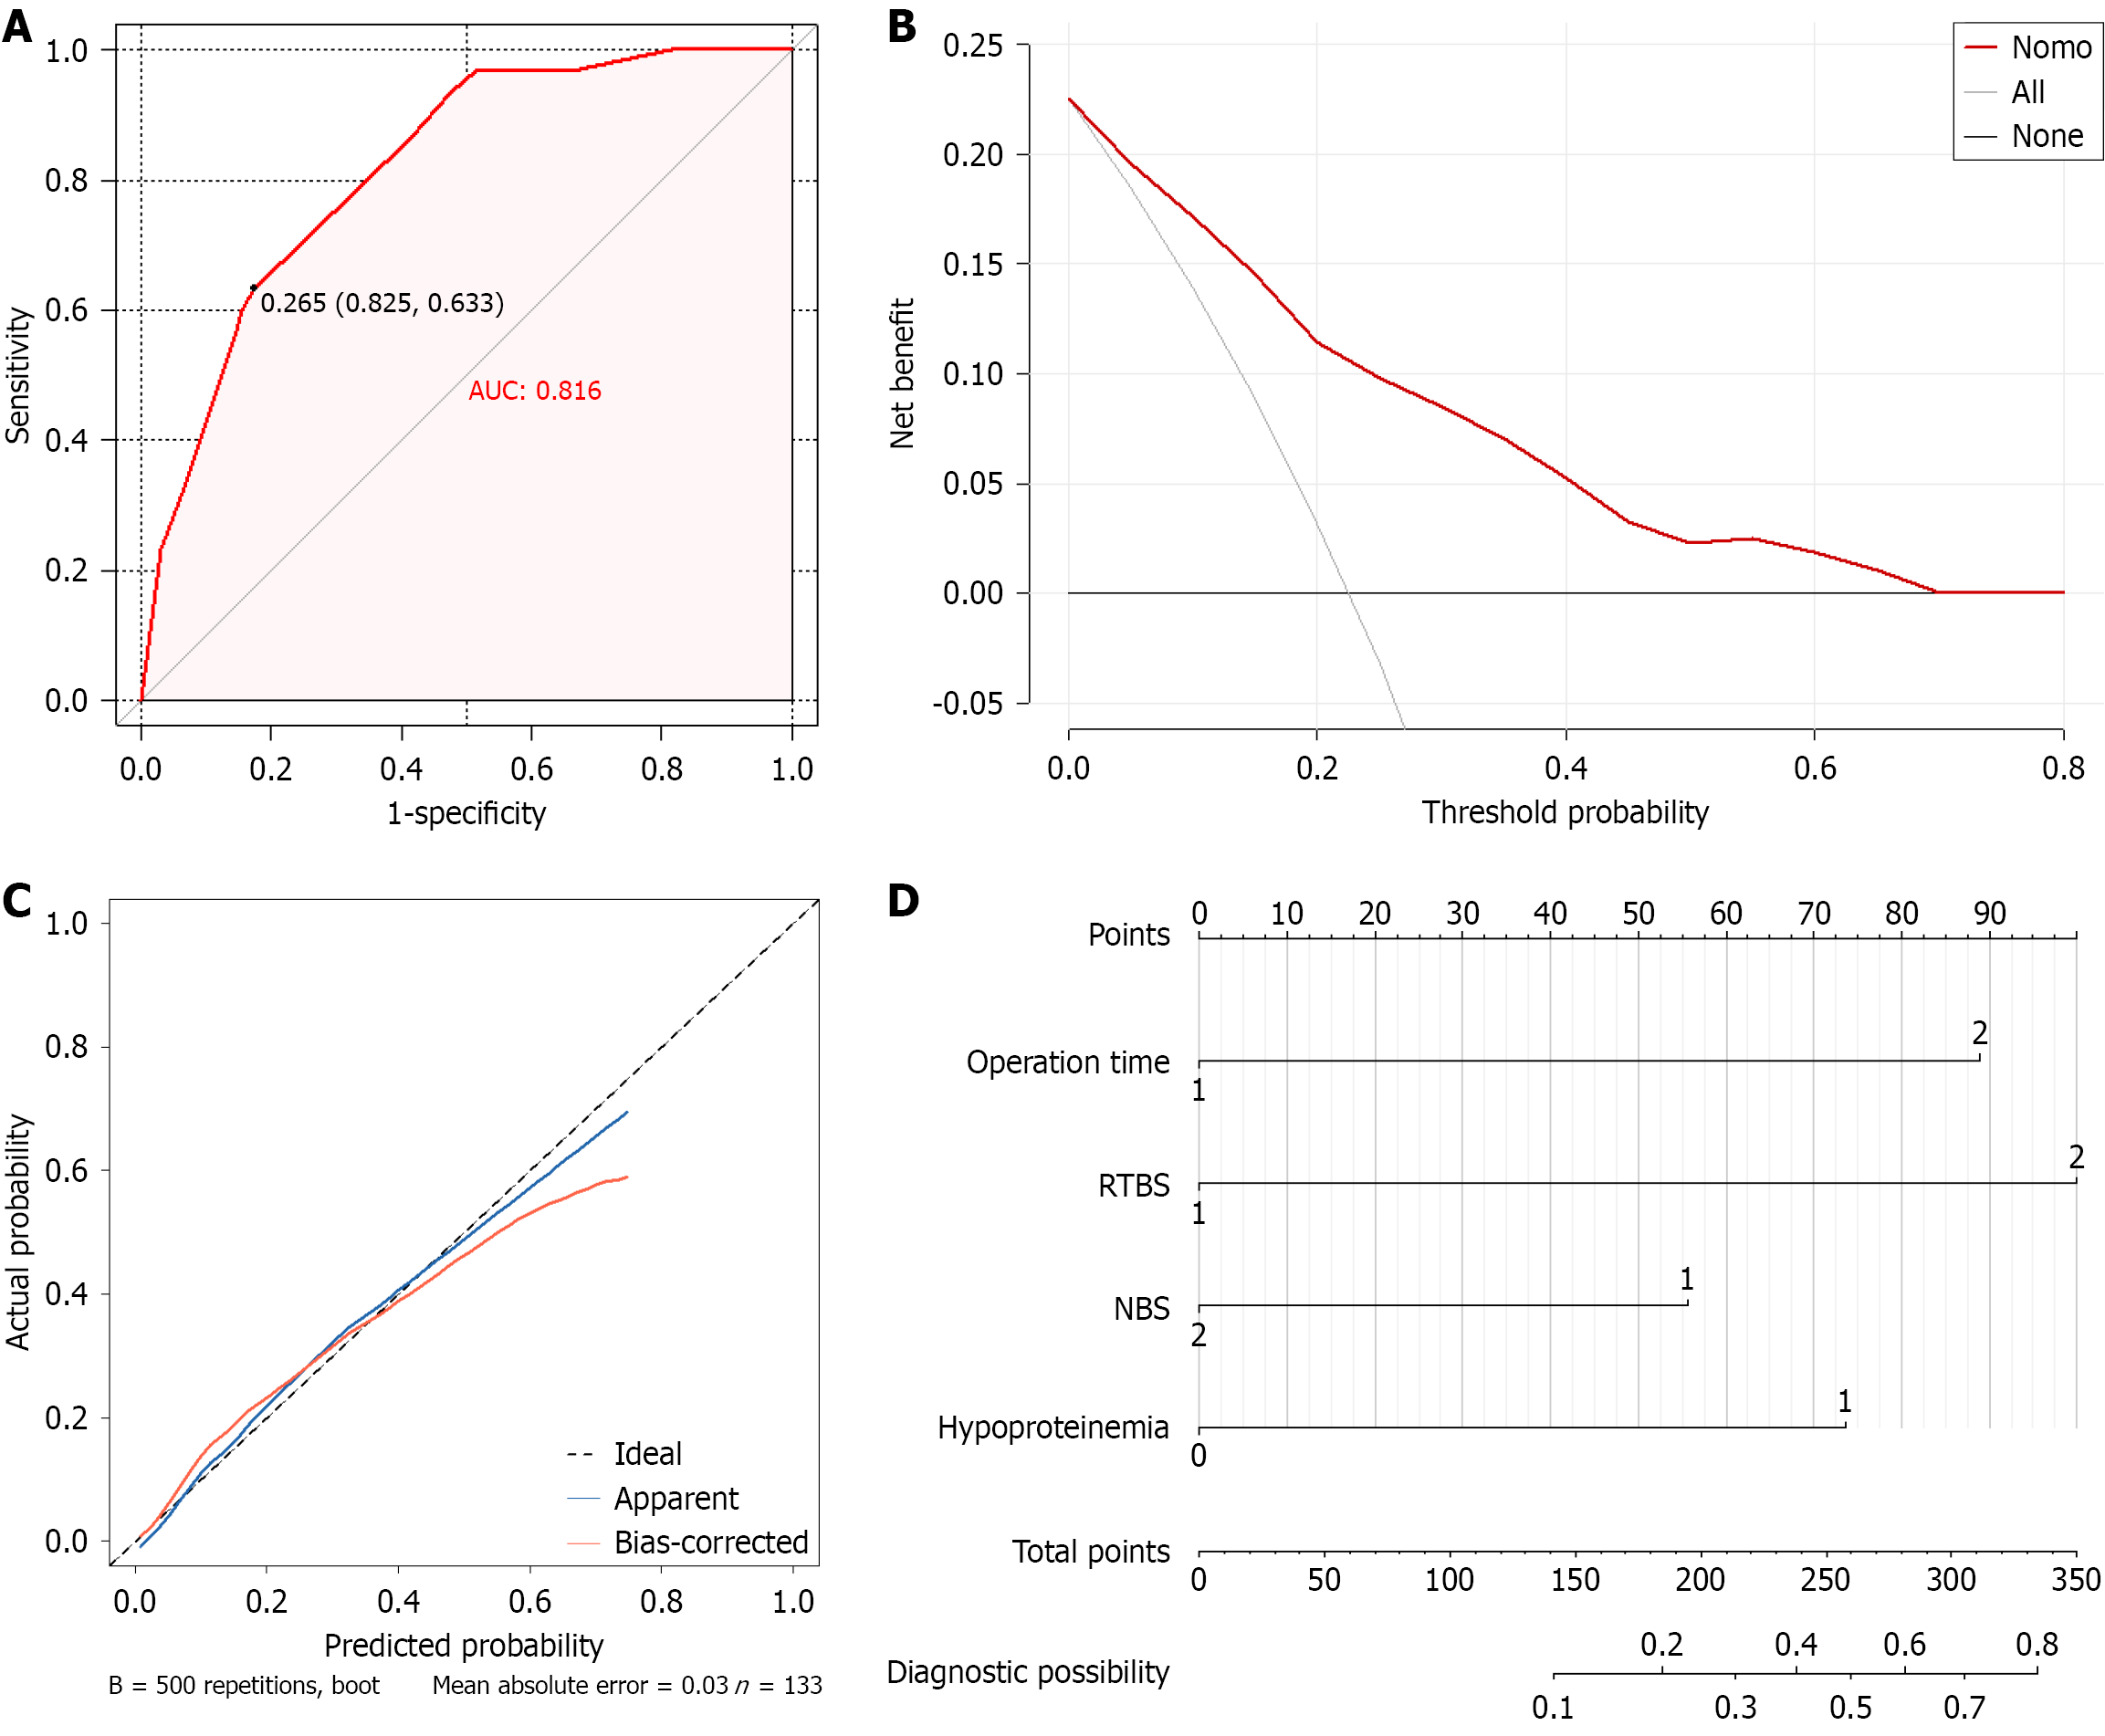
Figure 8 Performance evaluation graph of predictive model.
A: The receiver operating characteristic curve assesses the predictive model for postoperative prolonged postoperative ileus in colorectal cancer, area under the curve = 0.816; B: Decision curve analysis is used to assess the predictive model, indicating it has a good clinical net benefit; C: Calibration curve reflects how closely the predicted risk matches the actual risk; D: The nomogram highlights how different factors influence disease diagnosis. AUC: Area under the curve; RTBS: Recovery time of bowel sounds; NBS: Number of bowel sounds.
- Citation: Shi S, Wang C, Zhao CS, Chen Z, Yan L, Liang Y, Yue X, Duan XL, Wang ZZ. Clinical study predicting prolonged postoperative ileus after laparoscopic colorectal cancer surgery with intelligent bowel sound auscultation system. World J Gastrointest Oncol 2026; 18(7): 120582
- URL: https://www.wjgnet.com/1948-5204/full/v18/i7/120582.htm
- DOI: https://dx.doi.org/10.4251/wjgo.120582