
















Copyright: ©Author(s) 2026.
World J Gastrointest Oncol. Jul 15, 2026; 18(7): 120564
Published online Jul 15, 2026. doi: 10.4251/wjgo.120564
Published online Jul 15, 2026. doi: 10.4251/wjgo.120564
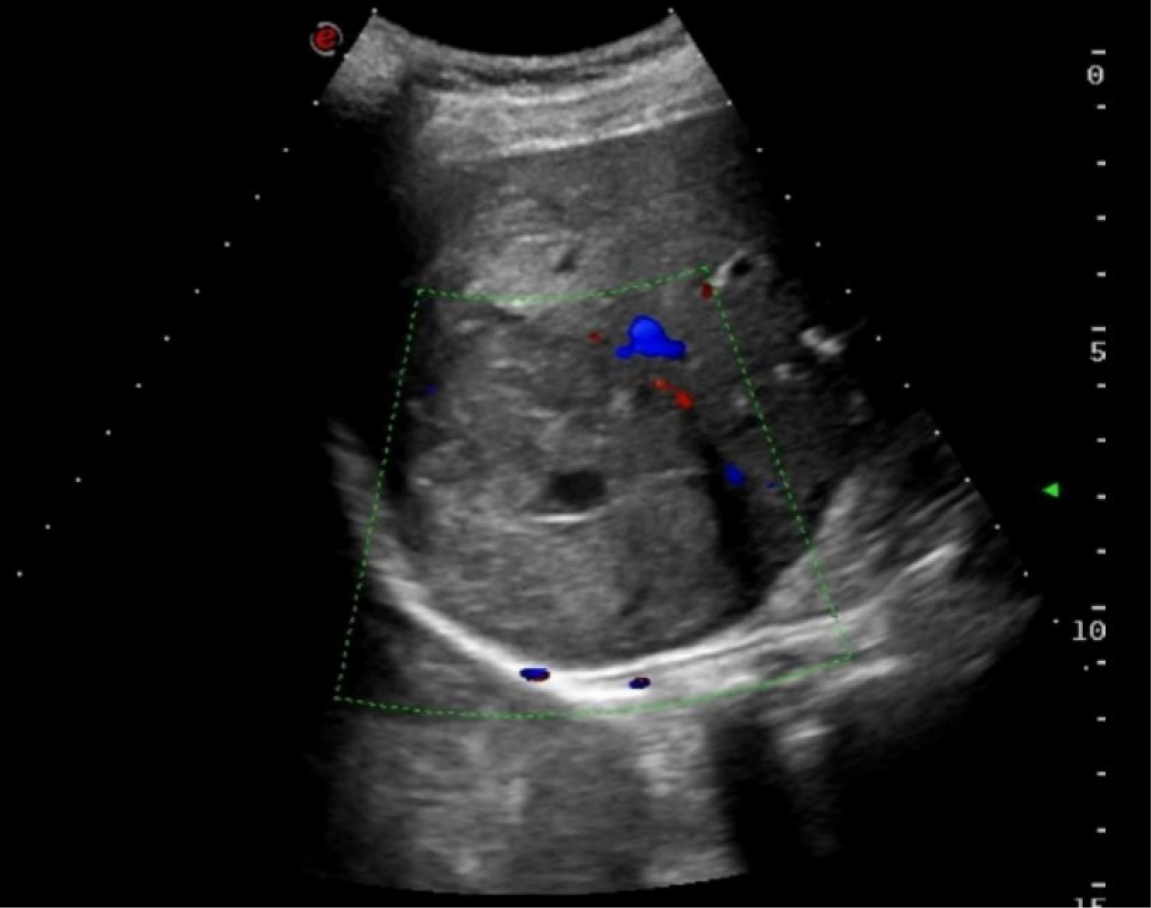
Figure 1 Ultrasound revealed a cystic-solid mass measuring approximately 68 mm × 59 mm in the right lobe of the liver.
A central fluid-dark area with poor internal sound transmission (indicative of necrosis) and peripheral blood flow signals were observed. These features are non-specific and may mimic benign lesions such as a liver abscess.
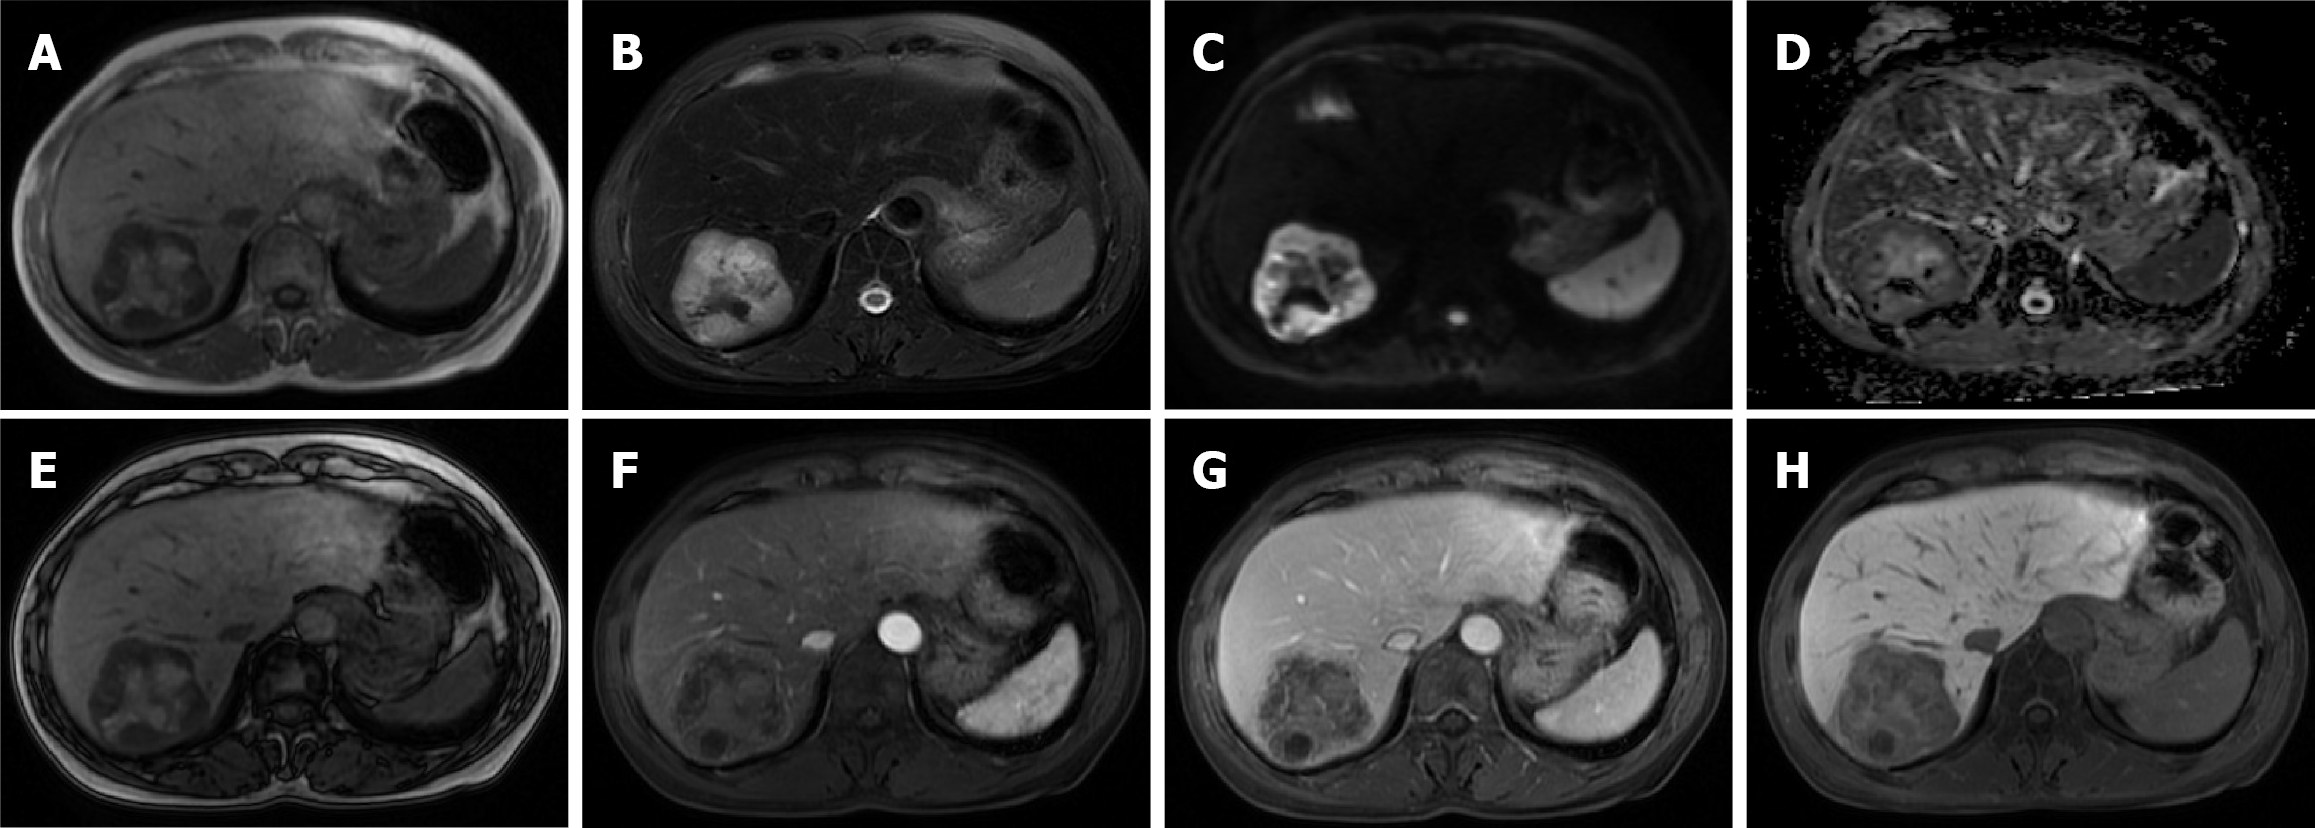
Figure 2 Magnetic resonance imaging revealed a heterogeneous signal mass in segment VII of the liver, measuring approximately 64 mm × 62 mm.
A: T1-weighted image shows predominant hypointensity with internal iso- to hyperintense foci; B: T2-weighted image shows predominant hyperintensity with internal hypointense areas; C and D: Diffusion-weighted imaging (C) and apparent diffusion coefficient (D) demonstrate peripheral restricted diffusion, indicating high cellularity at the viable tumor rim; E: Opposed-phase imaging shows no significant signal loss, arguing against microscopic fat; F and G: Contrast-enhanced imaging reveals patchy, heterogeneous enhancement; H: Hepatobiliary phase shows distinct hypointensity relative to background liver, indicating a lack of functioning hepatocytes.
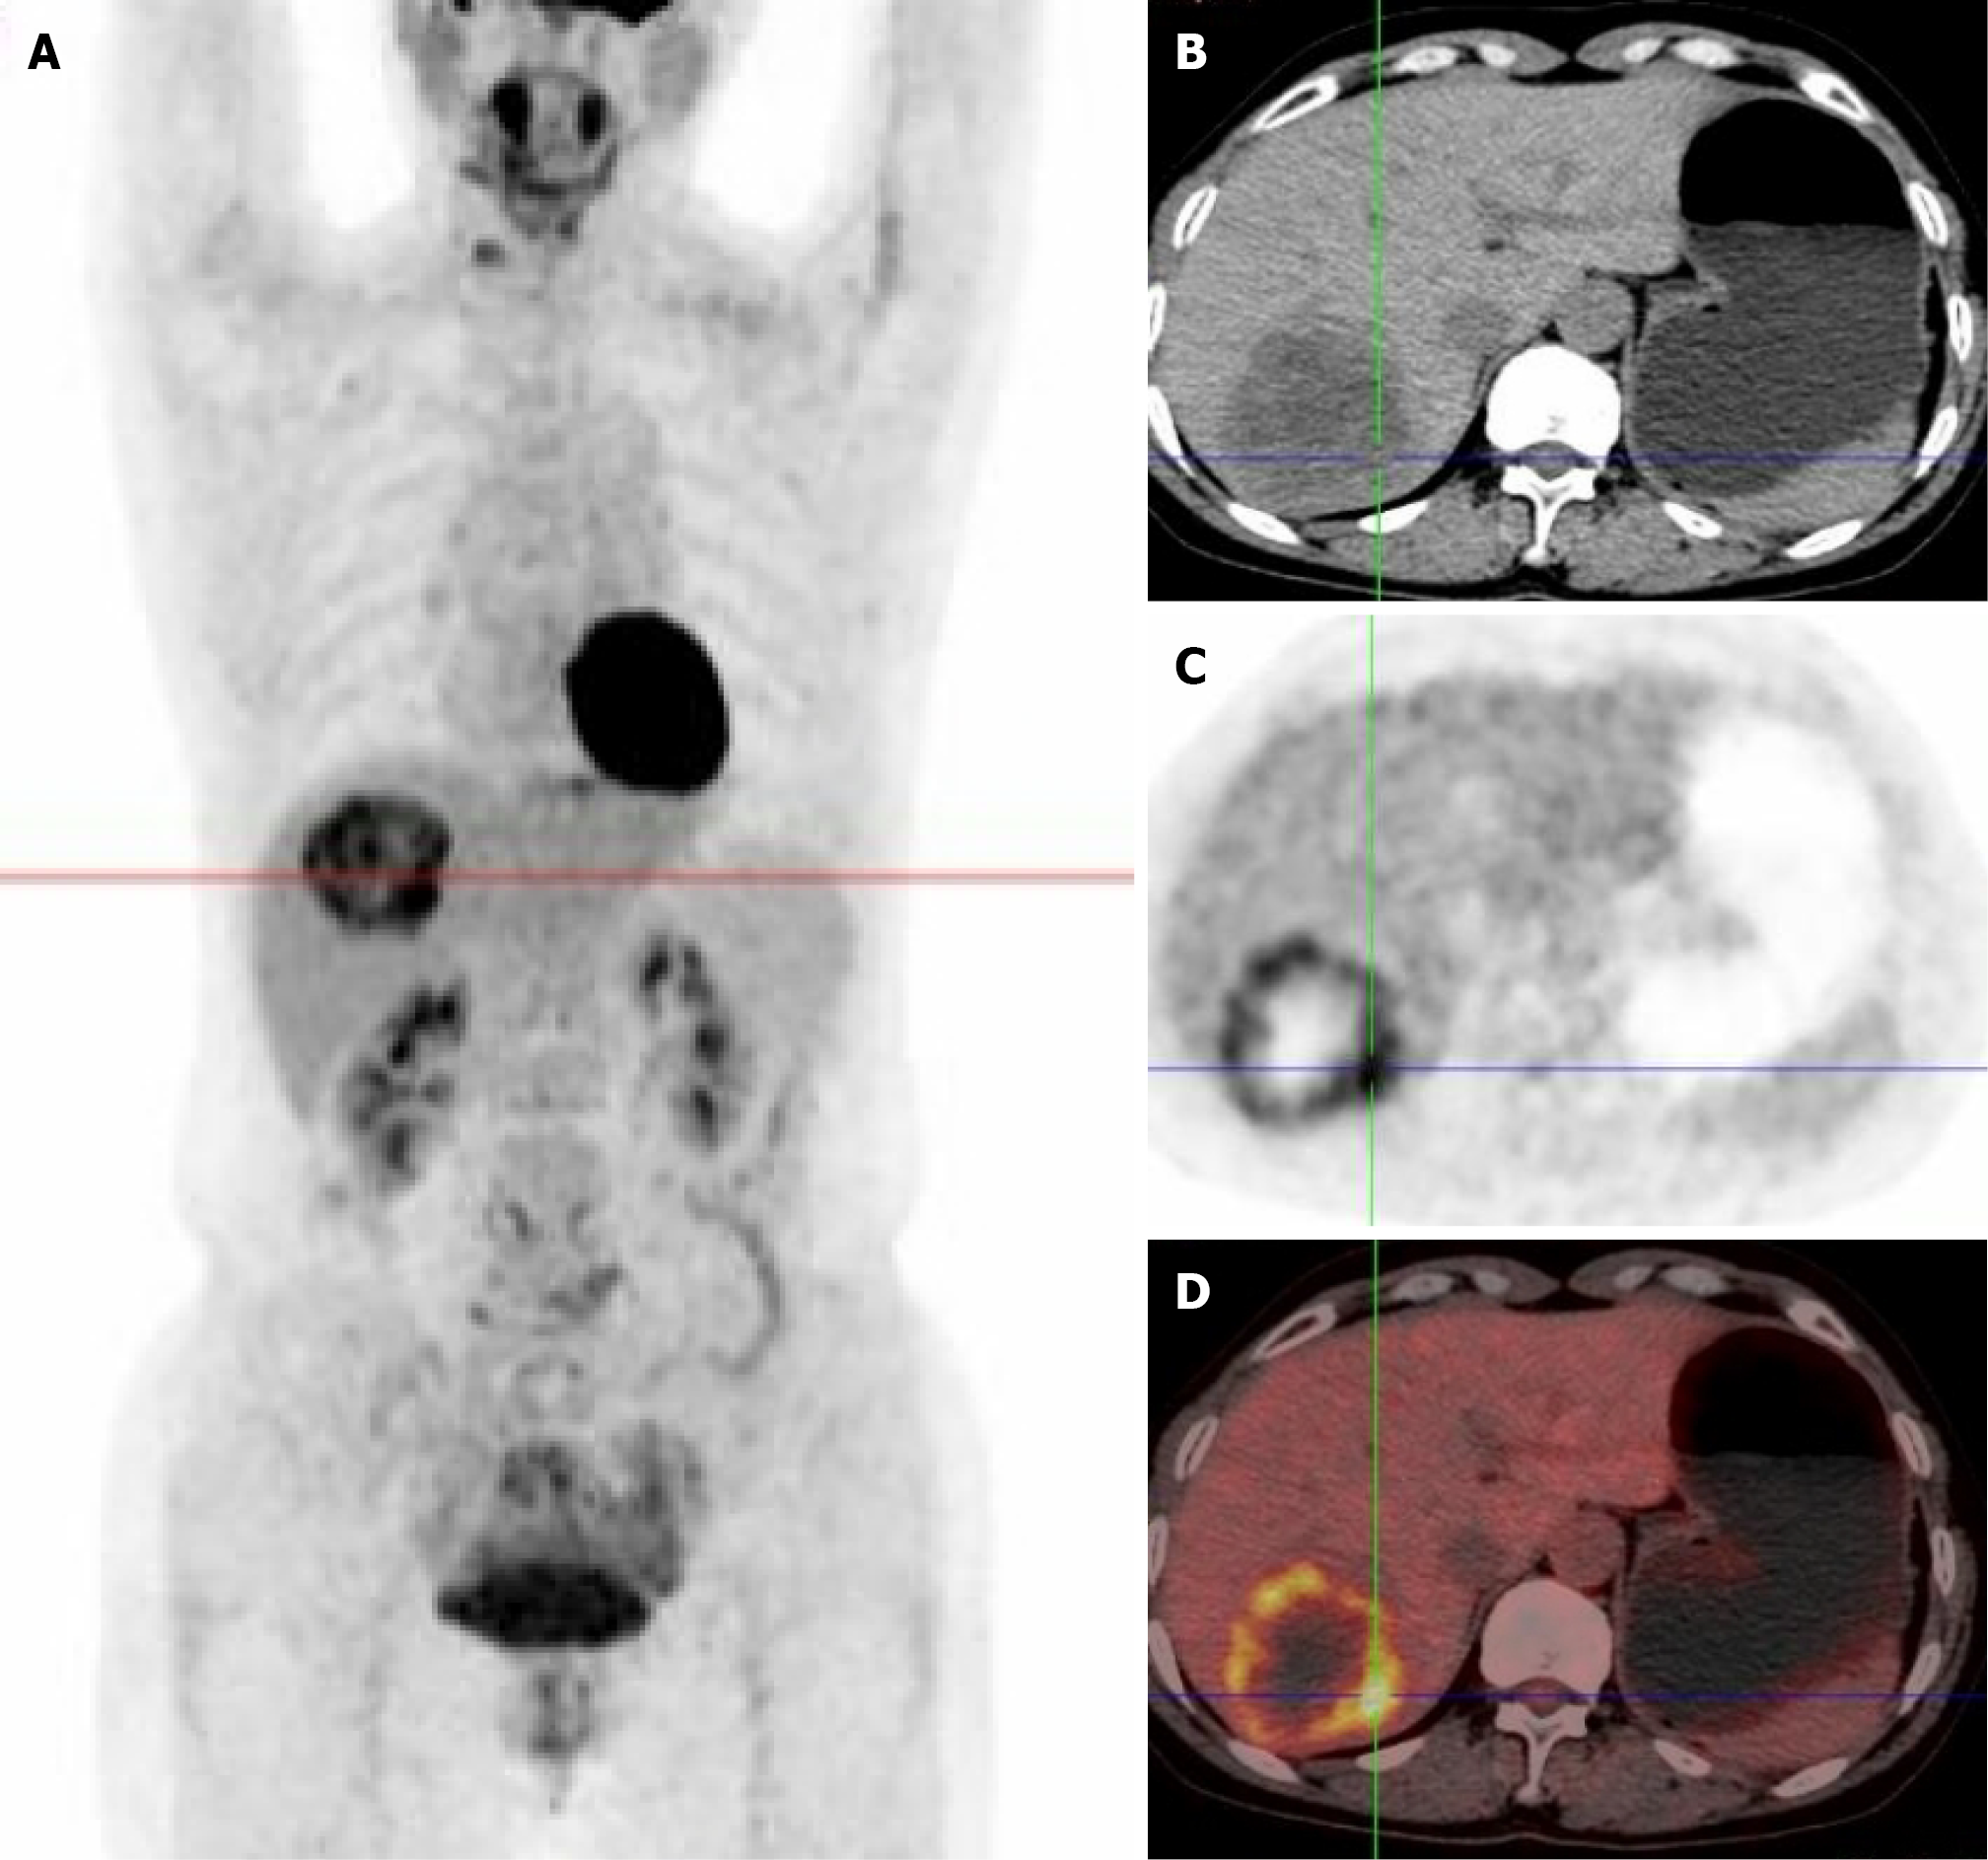
Figure 3 18F-Fluorodeoxyglucose positron emission tomography/computed tomography imaging revealed a heterogeneous density mass in segment VII of the liver, measuring approximately 63 mm × 61 mm.
A: The maximum intensity projection of 18F-Fluorodeoxyglucose positron emission tomography (18F-FDG PET) shows the lesion with no evidence of extrahepatic primary tumors; B: Computed tomography cross-sectional image demonstrates the mass is hypodense; C: 18F-FDG PET image shows uneven annular hypermetabolism; D: Fused 18F-FDG PET/computed tomography image demonstrates annular fluorodeoxyglucose uptake (maximum standardized uptake value 7.43) corresponding to the viable tumor rim.
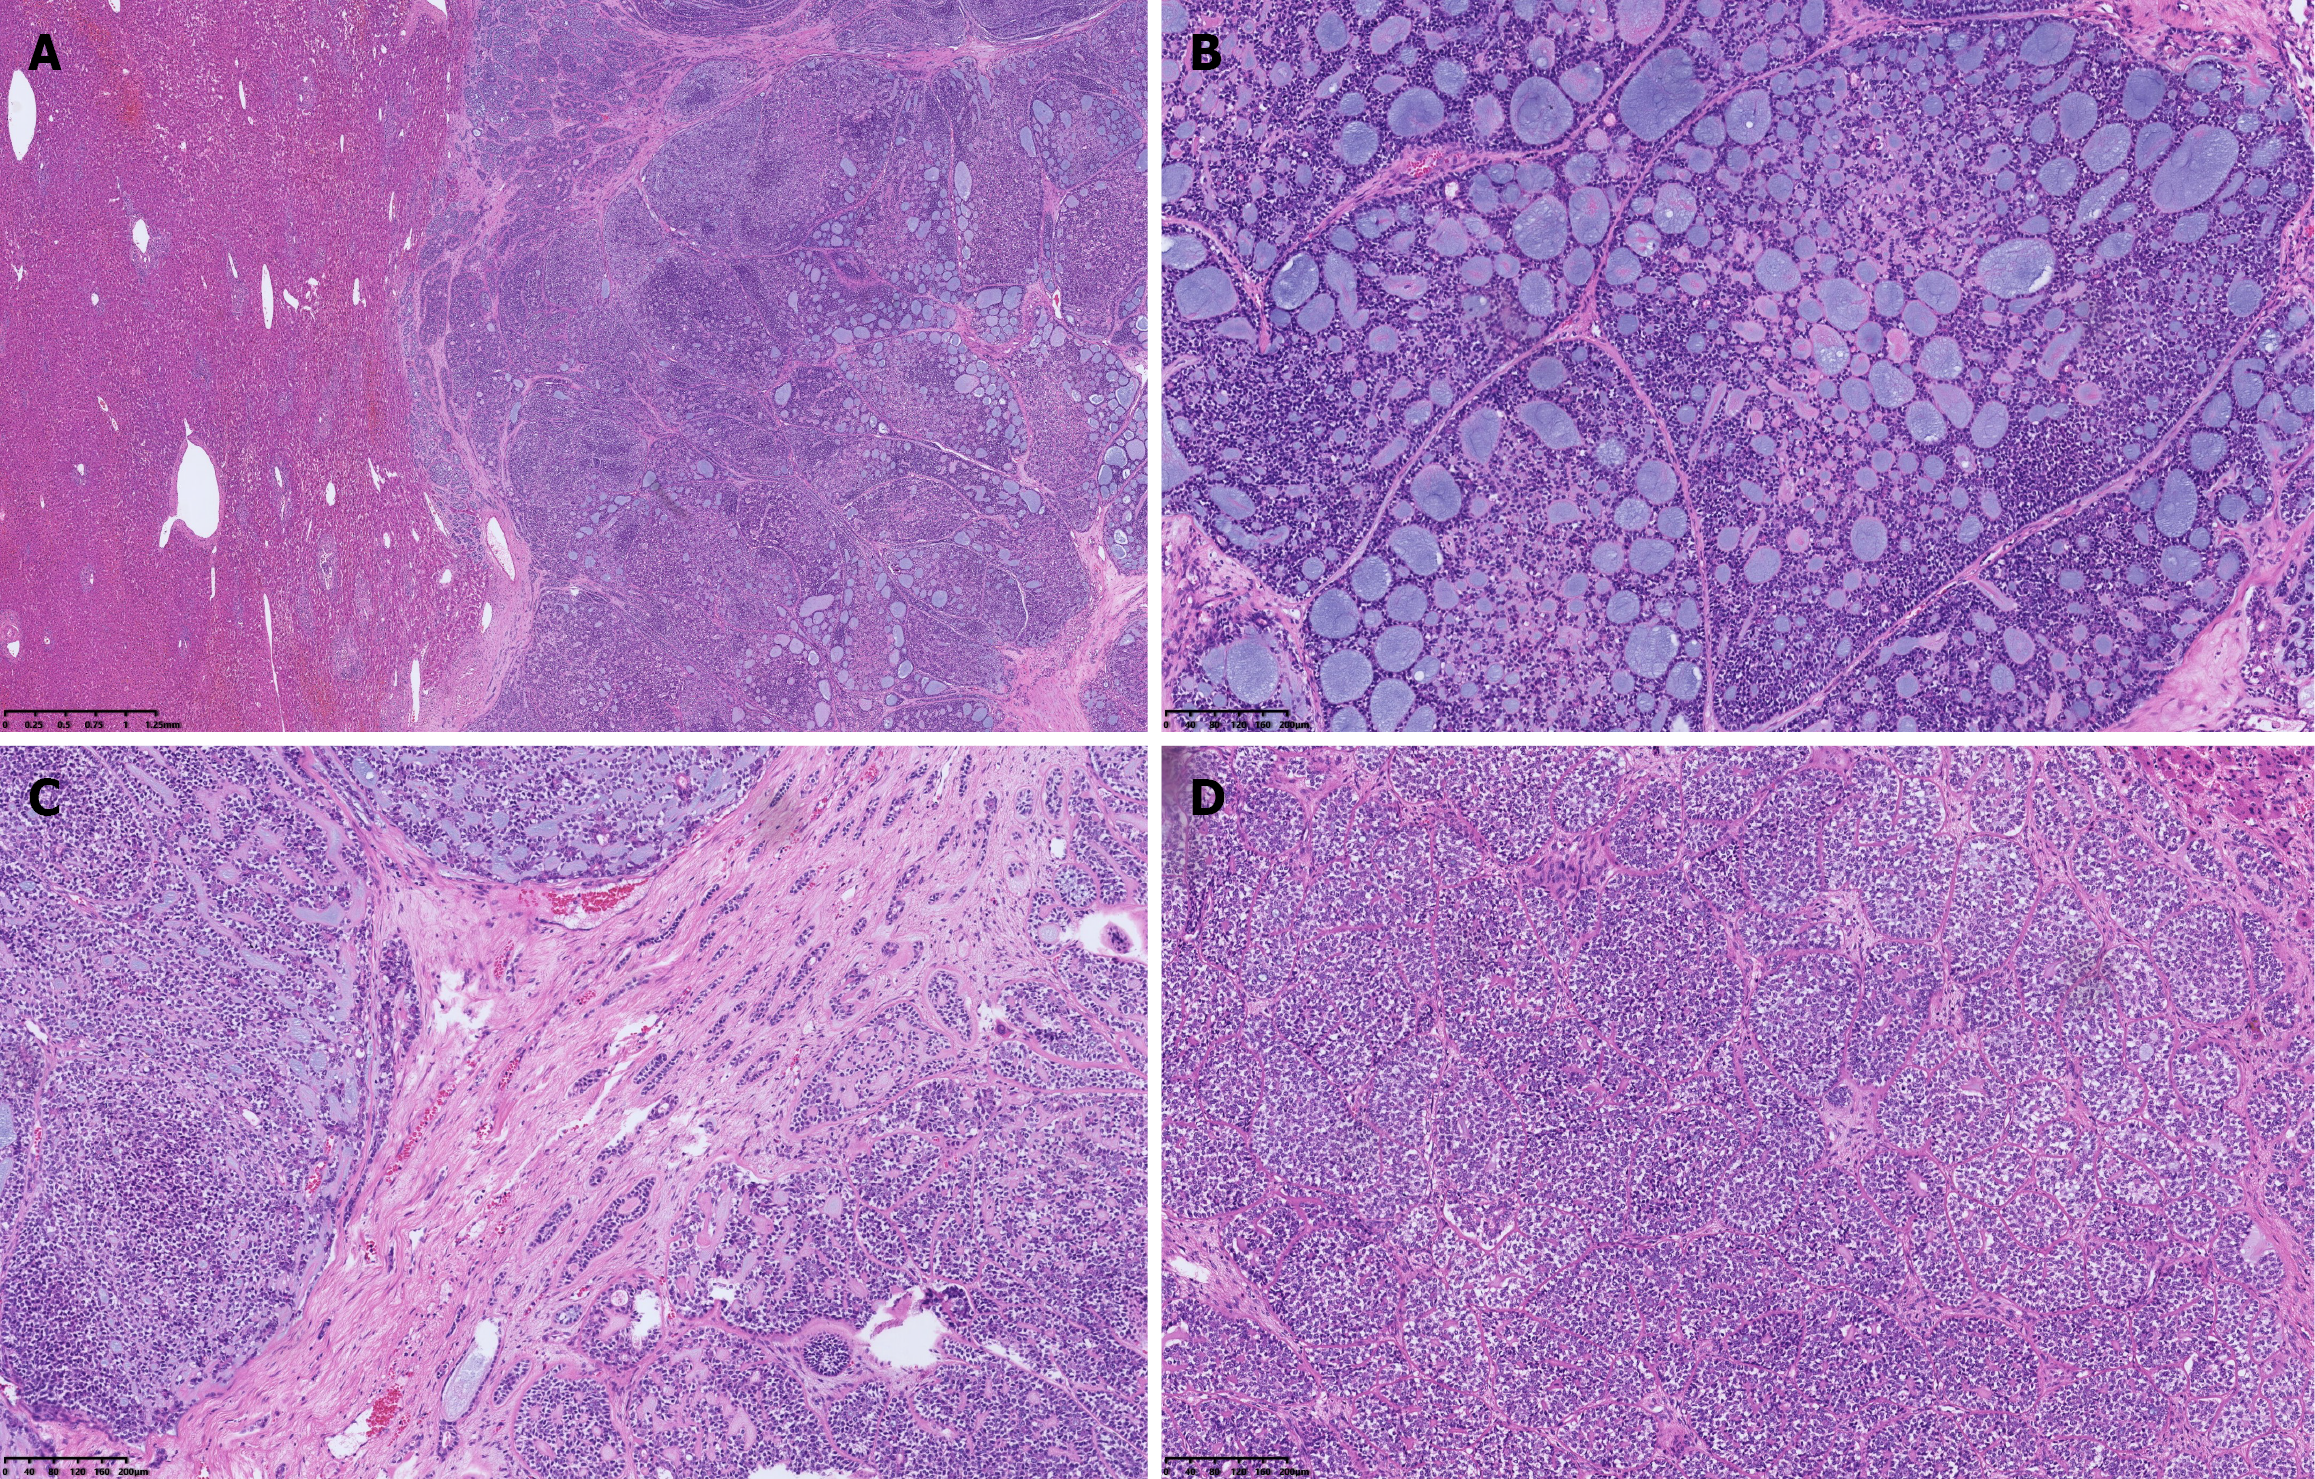
Figure 4 Microscopic characteristics.
A: The tumor was poorly demarcated from the adjacent liver parenchyma, × 20; B: The tumor predominantly exhibited a cribriform growth pattern, × 100; C: Focal areas showing tubular structures were present, × 100; D: Focal areas of solid growth pattern were observed, × 100. The presence of multiple architectural patterns is consistent with the diagnosis of adenoid cystic carcinoma.
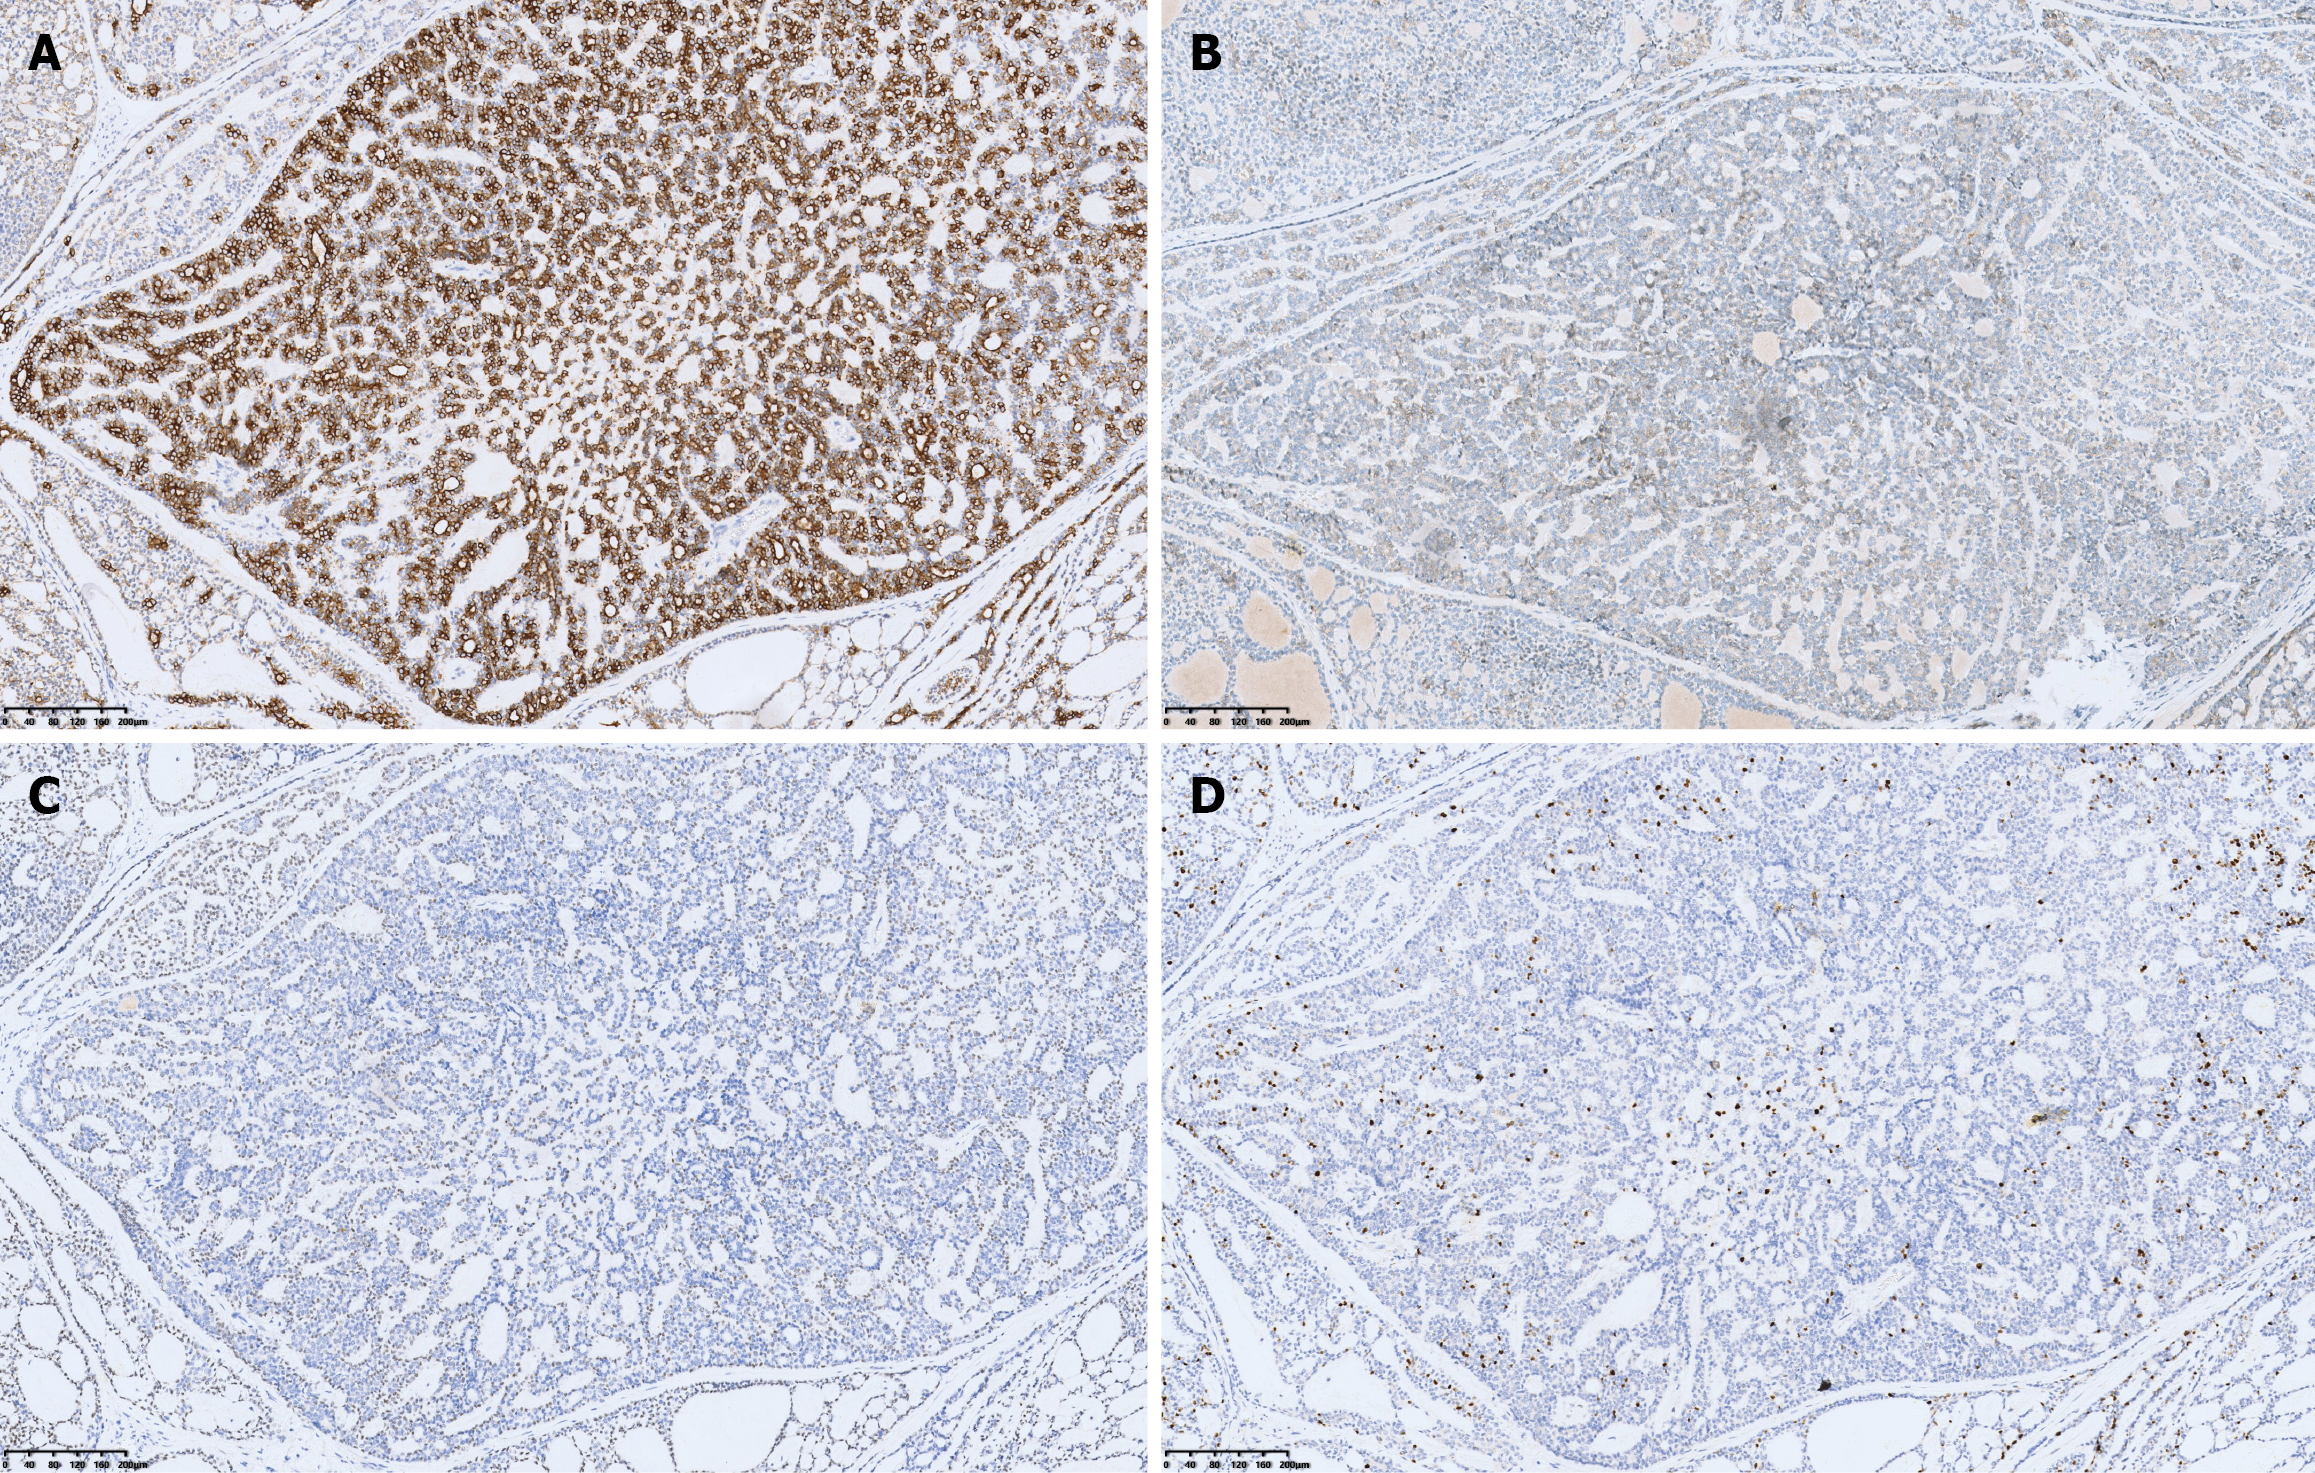
Figure 5 Immunohistochemical findings.
A: Cytokeratin 7 showed diffuse membranous positivity, supporting a glandular epithelial origin, × 100; B: Cluster of differentiation 117 demonstrated cytoplasmic and membranous positivity, a characteristic immunophenotype of adenoid cystic carcinoma, × 100; C: P63 exhibited nuclear positivity, indicating the presence of myoepithelial cells, × 100; D: The Ki-67 proliferation index was approximately 20% in the tumor cells, suggesting moderate proliferative activity, × 100. The immunohistochemical profile (cytokeratin 7+, cluster of differentiation 117+, p63+) is consistent with the diagnosis of adenoid cystic carcinoma.
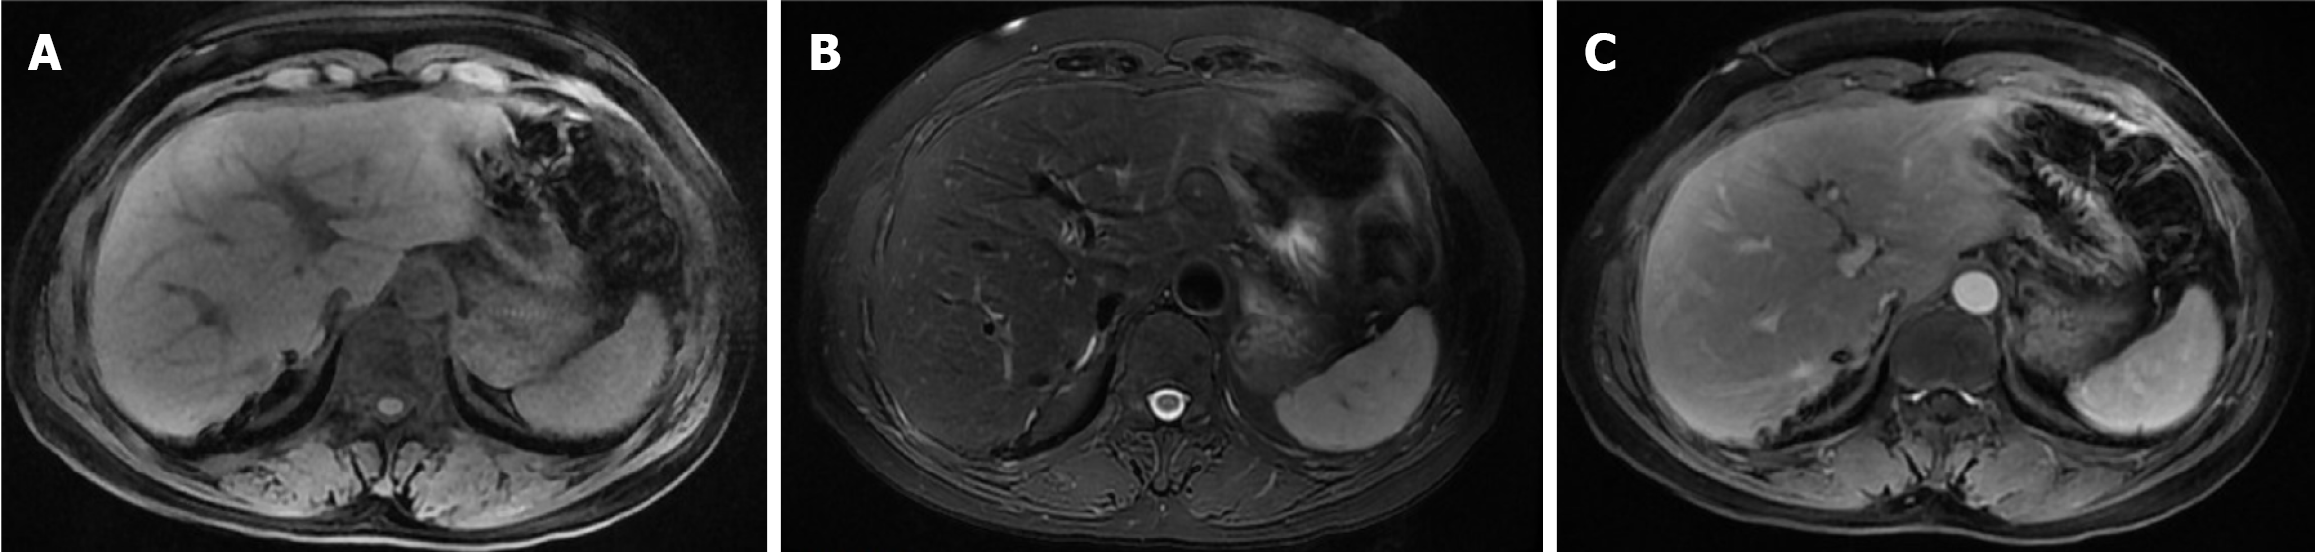
Figure 6 Postoperative follow-up magnetic resonance imaging at 7 months, no evidence of local recurrence or metastasis was observed.
A: T1-weighted image; B: T2-weighted image; C: Contrast-enhanced image.
- Citation: Xing HQ, Mo TM, He J. Primary hepatic adenoid cystic carcinoma: A case report and review of literature. World J Gastrointest Oncol 2026; 18(7): 120564
- URL: https://www.wjgnet.com/1948-5204/full/v18/i7/120564.htm
- DOI: https://dx.doi.org/10.4251/wjgo.120564