
















Copyright: ©Author(s) 2026.
World J Gastrointest Oncol. Jul 15, 2026; 18(7): 120437
Published online Jul 15, 2026. doi: 10.4251/wjgo.120437
Published online Jul 15, 2026. doi: 10.4251/wjgo.120437
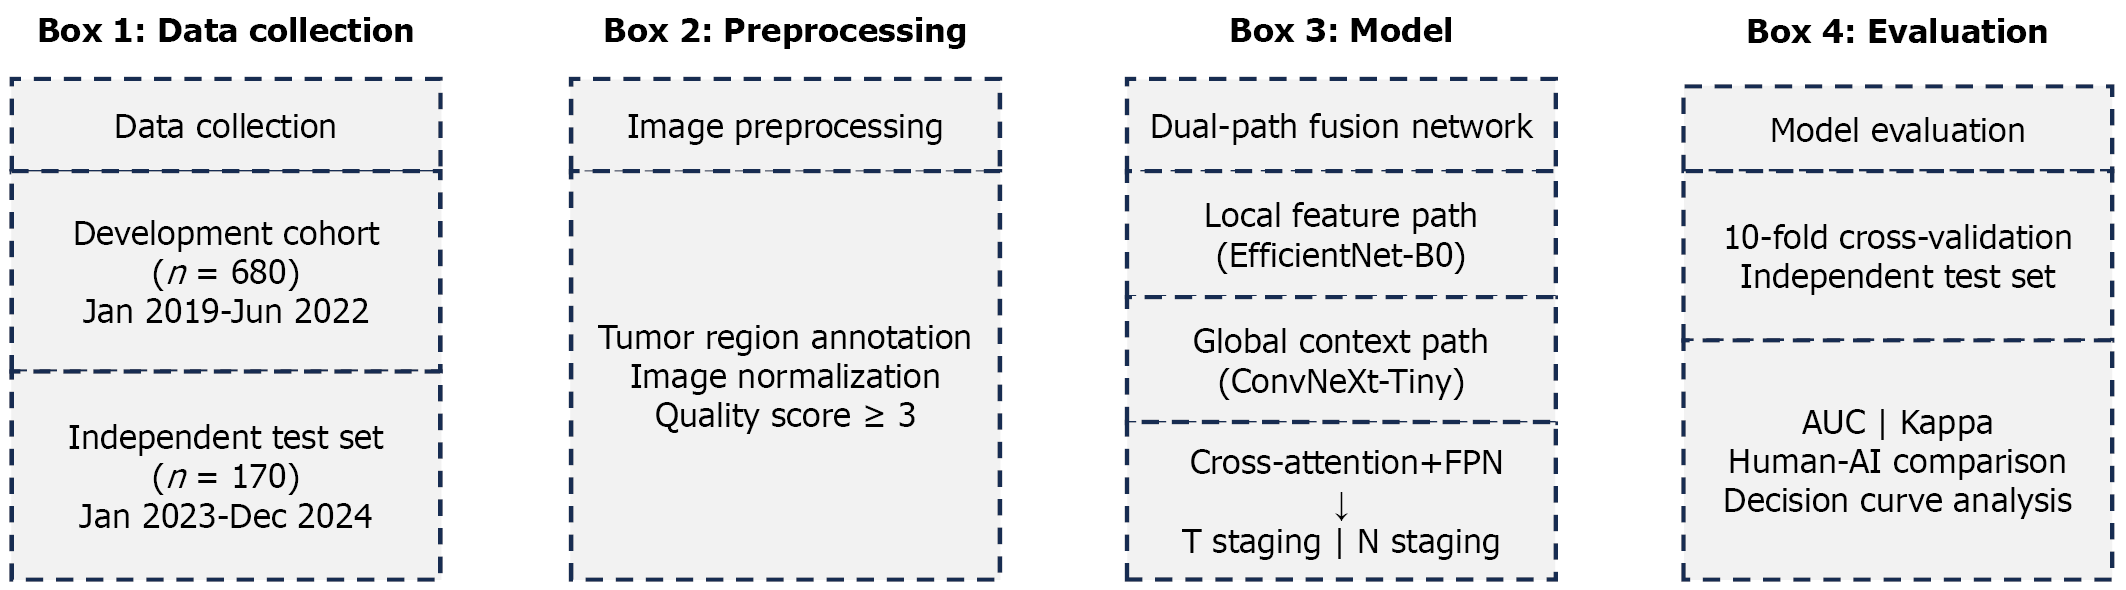
Figure 1 Overall study design.
The study consisted of four phases: (1) Data collection from development cohort (n = 680) and independent test cohort (n = 170); (2) Image preprocessing including tumor annotation and quality assessment; (3) Construction of the dual-path context-aware fusion network for T and N staging; and (4) Model evaluation using cross-validation and independent test set. FPN: Feature pyramid networks; AUC: Area under the curve; AI: Artificial intelligence.
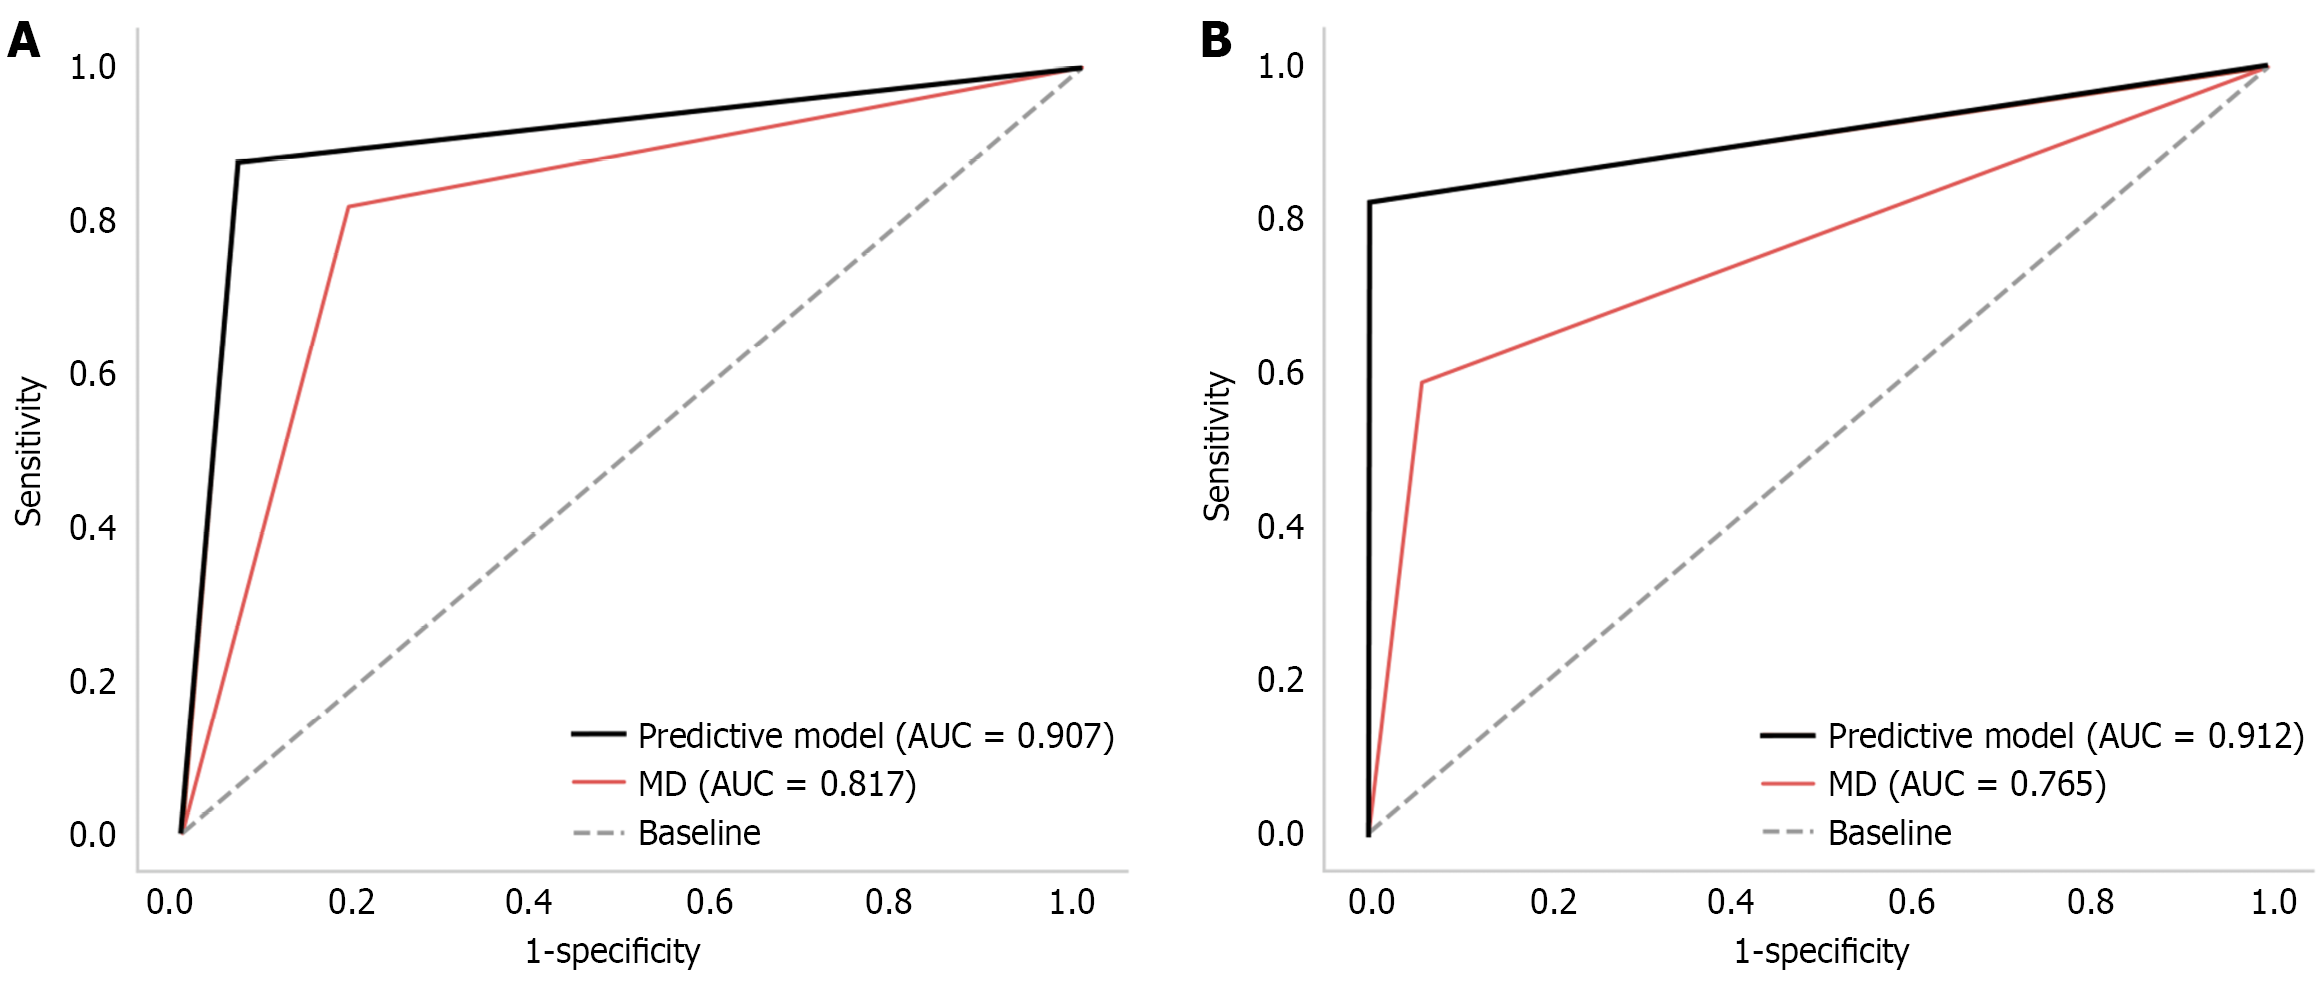
Figure 2 Receiver operating characteristic curves of the independent test set.
A: T-staging receiver operating characteristic curve; B: N-staging receiver operating characteristic curve. AUC: Area under the curve.
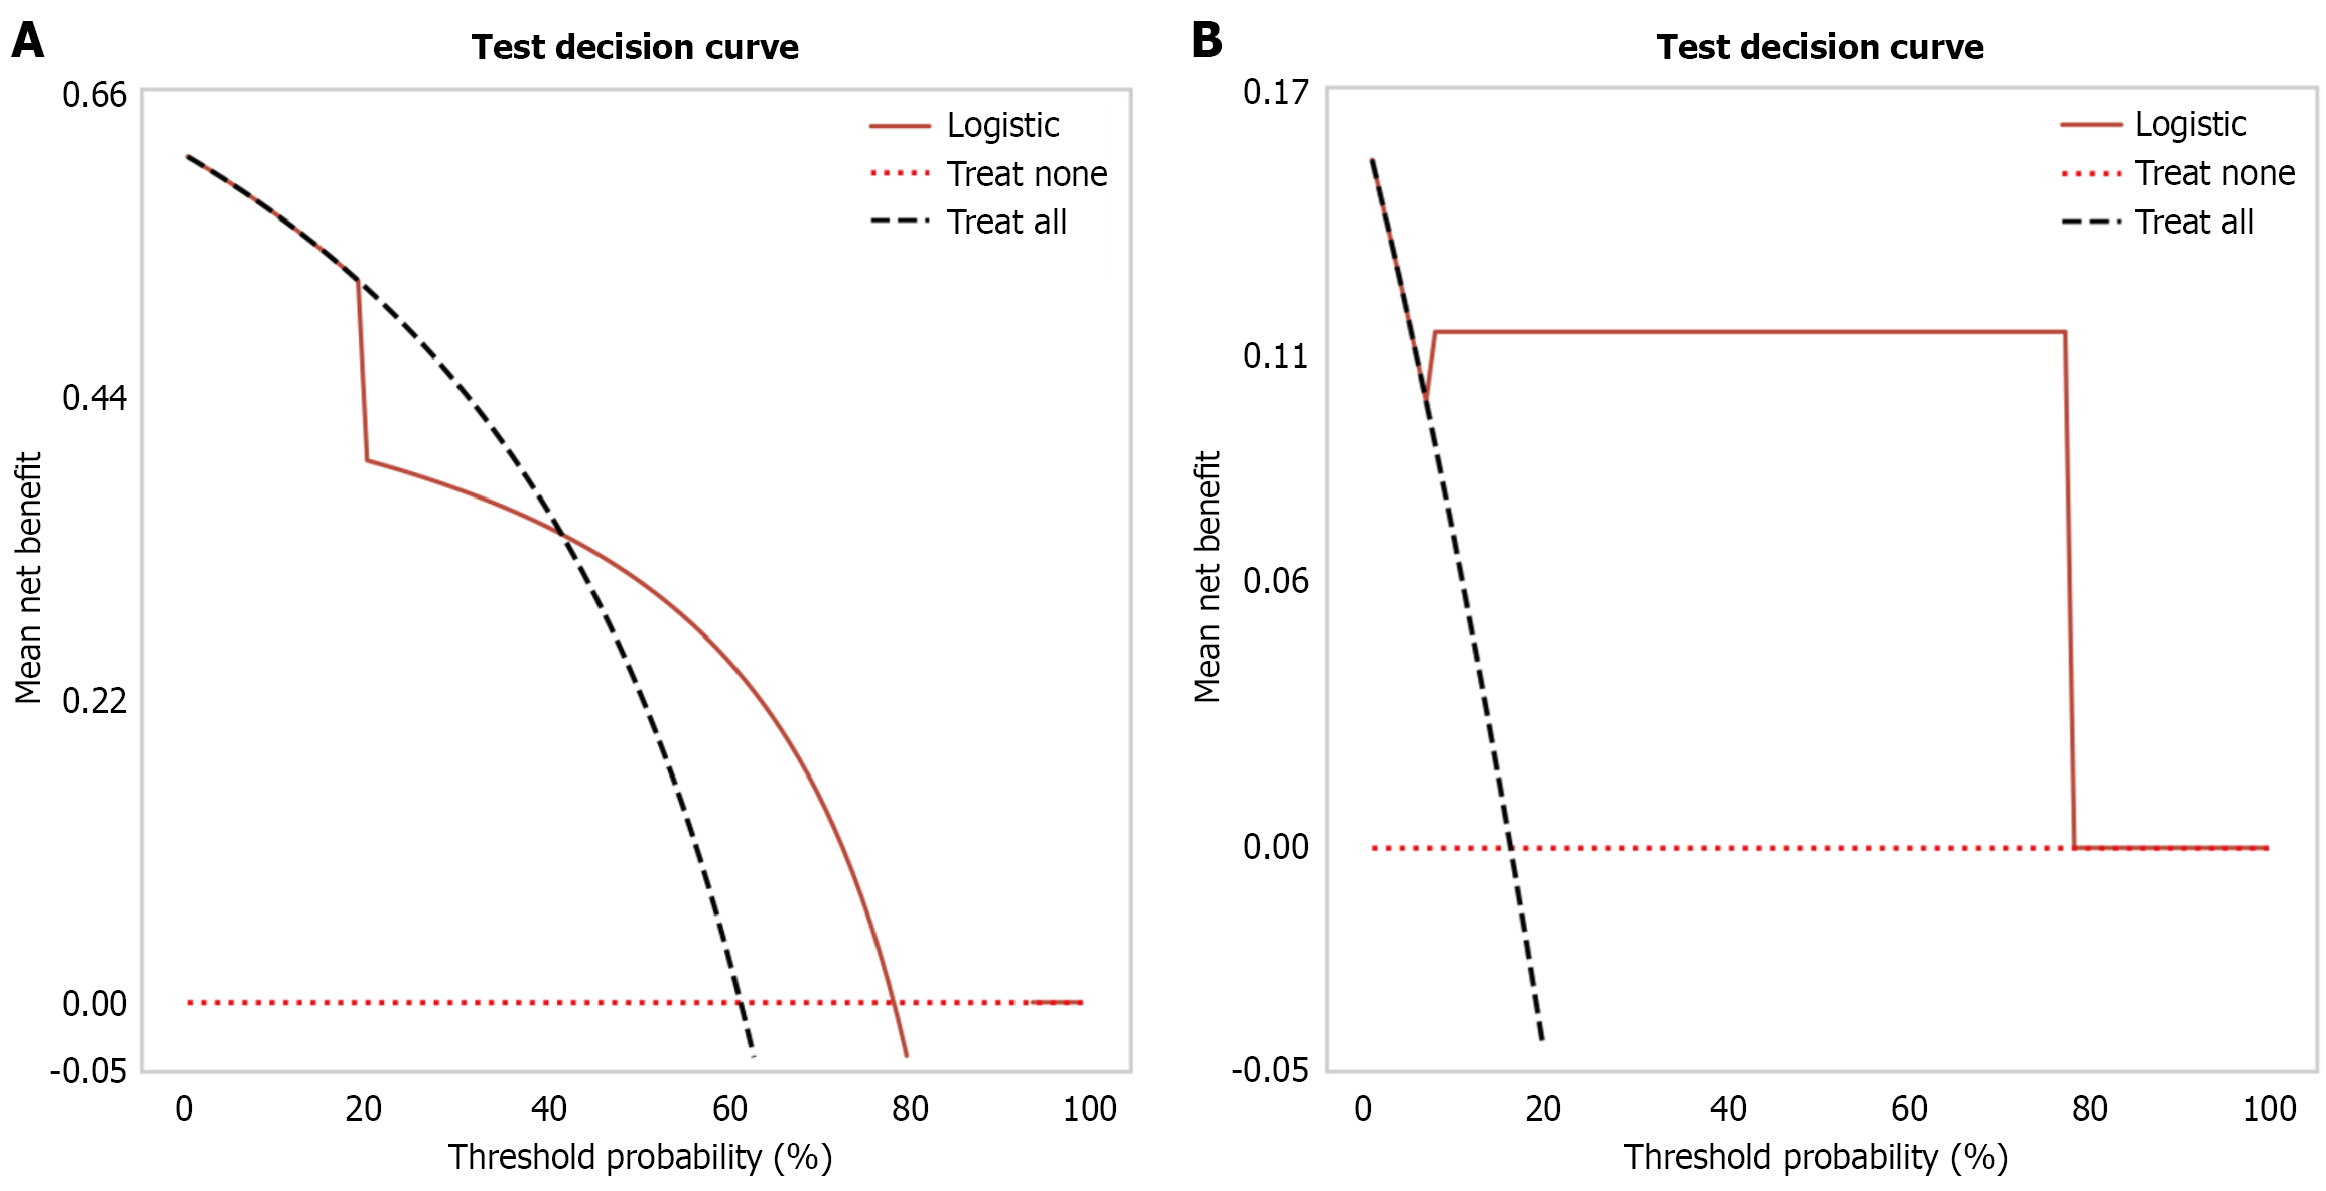
Figure 3 Decision curve analysis graphs.
A: T-staging decision curve analysis graph; B: N-staging decision curve analysis graph.
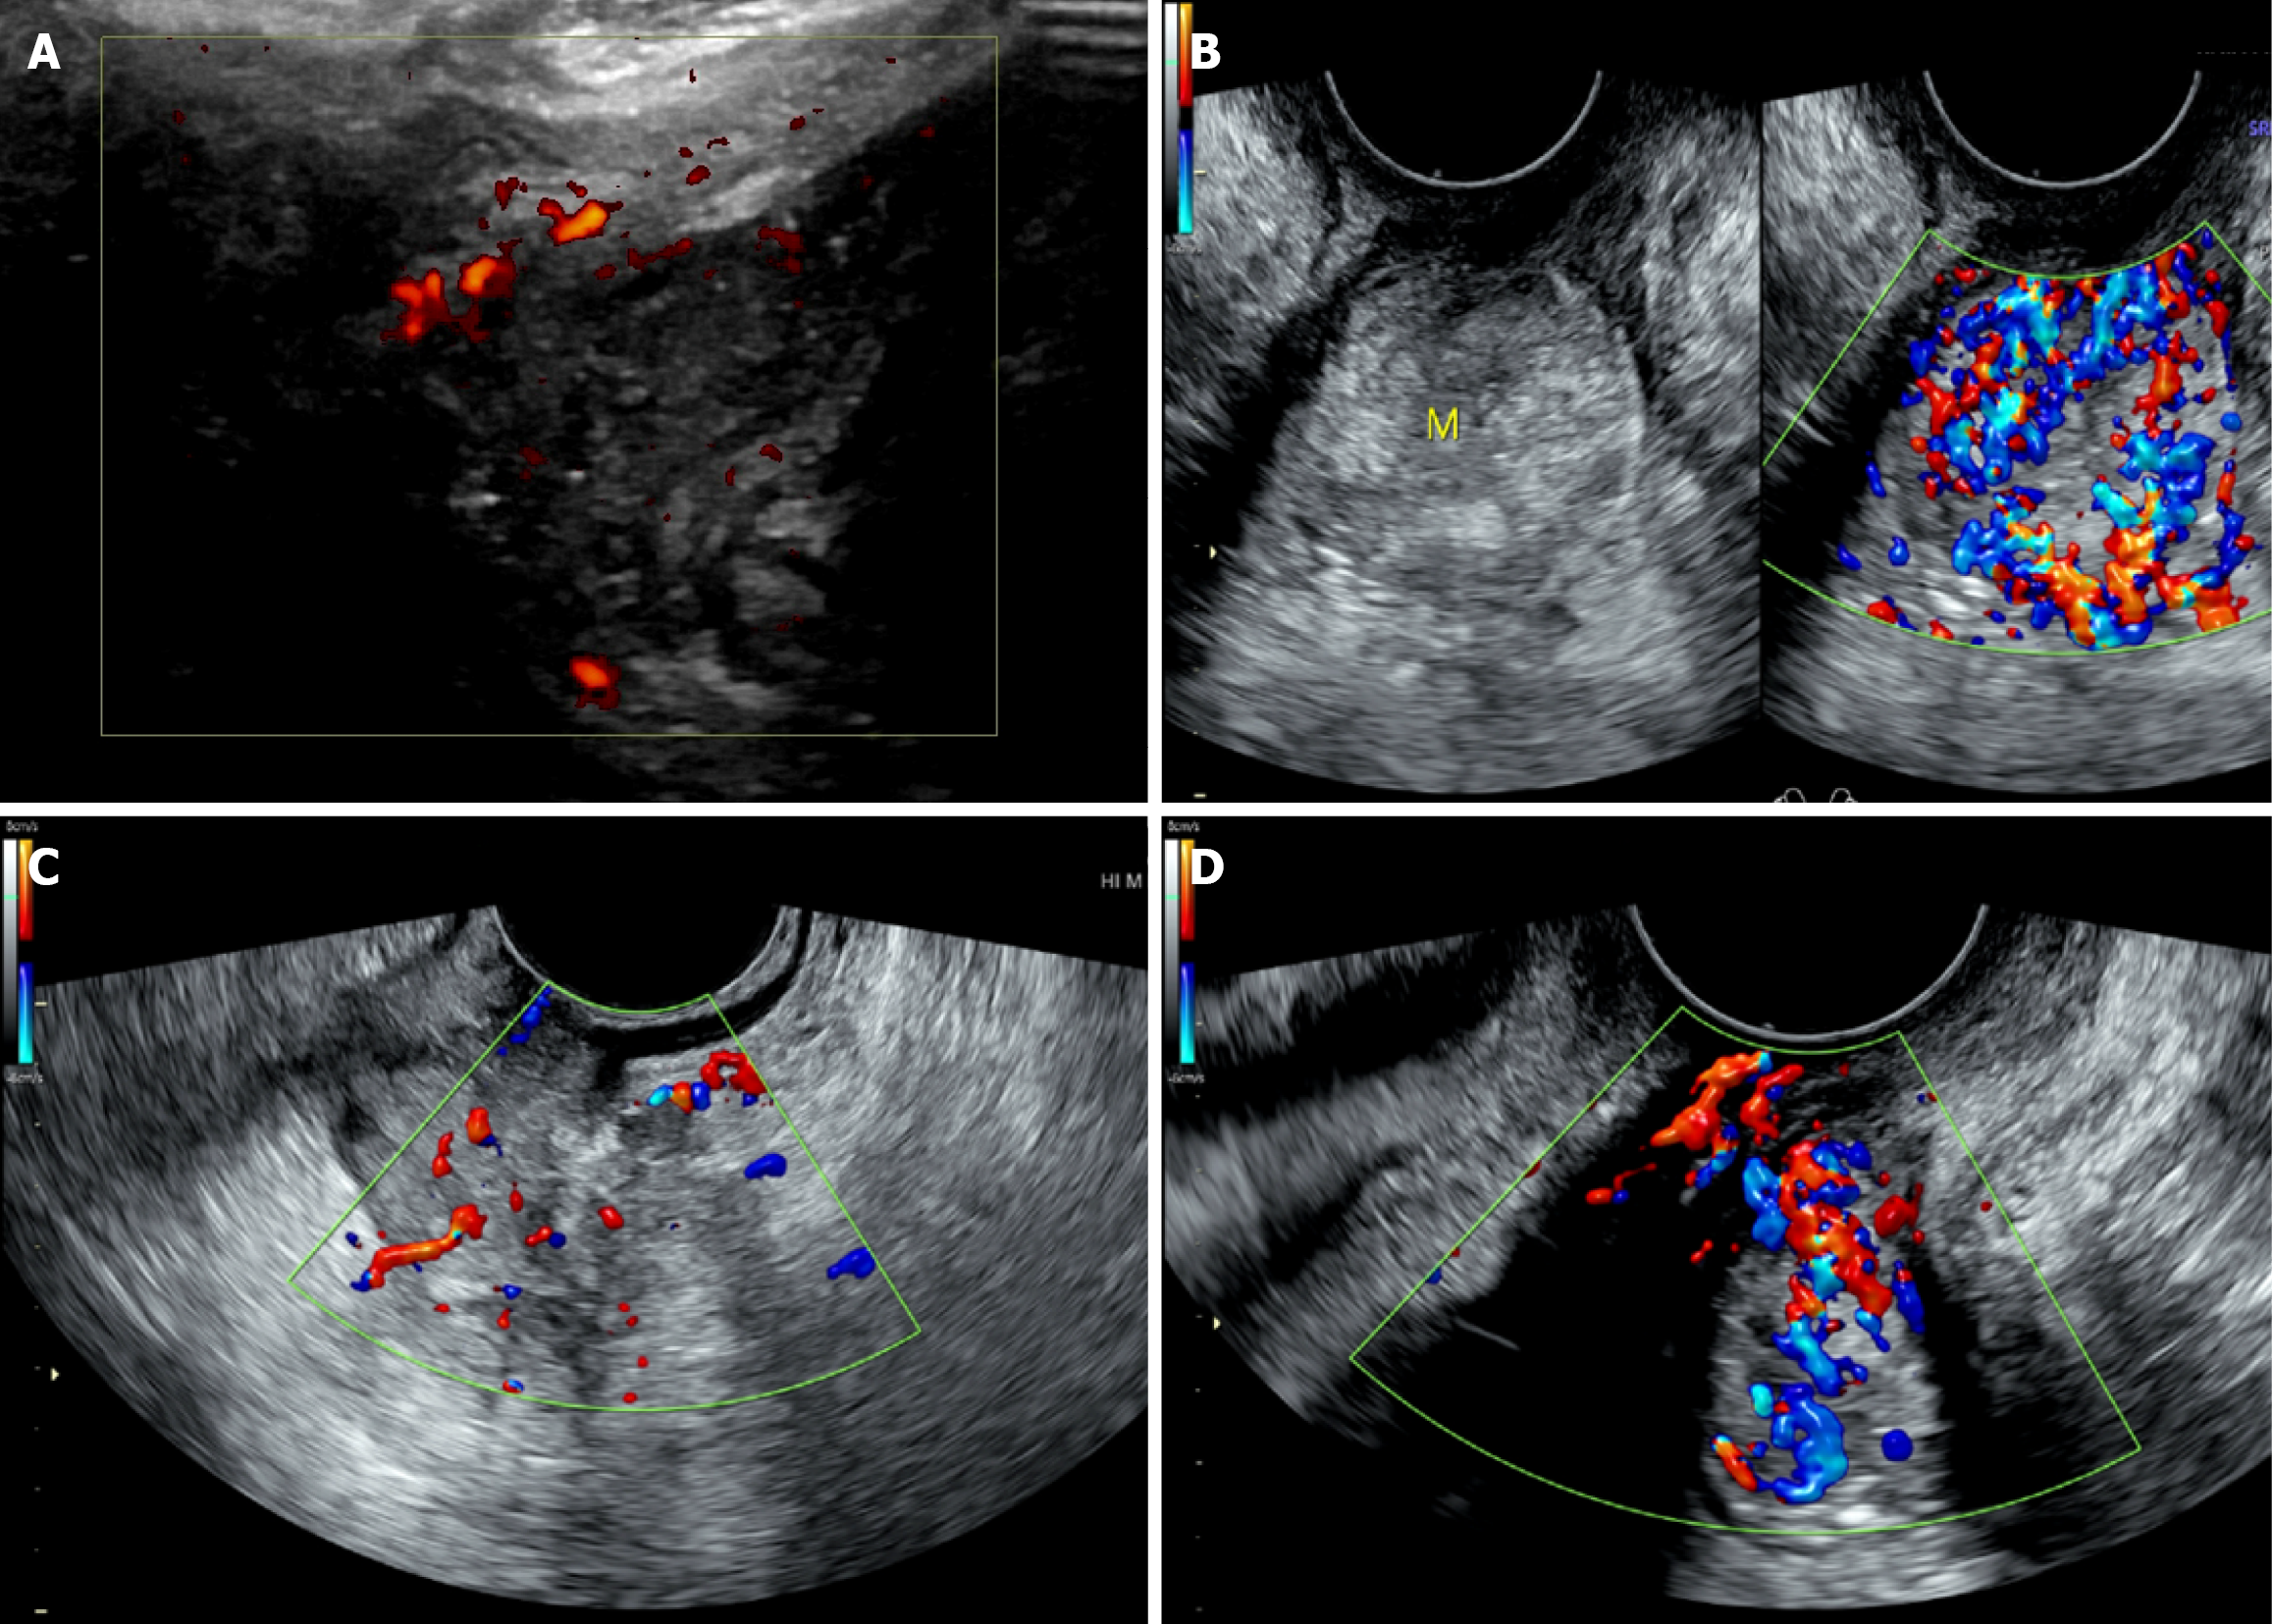
Figure 4 Image feature analysis of typical cases.
A: A correctly classified T1 tumor; B: A correctly classified T2 tumor; C: A misclassified case (T3 by pathology vs T2 by the model); D: A misclassified case (N2 by pathology vs N0 by the model).
- Citation: Zhao J, Du LJ, Liu Y, Zhu DD, Wang HQ, Shen MK, Wang LY, Wang HY. Development and clinical application of an ultrasound-based deep learning model for preoperative staging of colorectal cancer. World J Gastrointest Oncol 2026; 18(7): 120437
- URL: https://www.wjgnet.com/1948-5204/full/v18/i7/120437.htm
- DOI: https://dx.doi.org/10.4251/wjgo.120437