
















Copyright: ©Author(s) 2026.
World J Gastrointest Oncol. Jul 15, 2026; 18(7): 119847
Published online Jul 15, 2026. doi: 10.4251/wjgo.v18.i7.119847
Published online Jul 15, 2026. doi: 10.4251/wjgo.v18.i7.119847
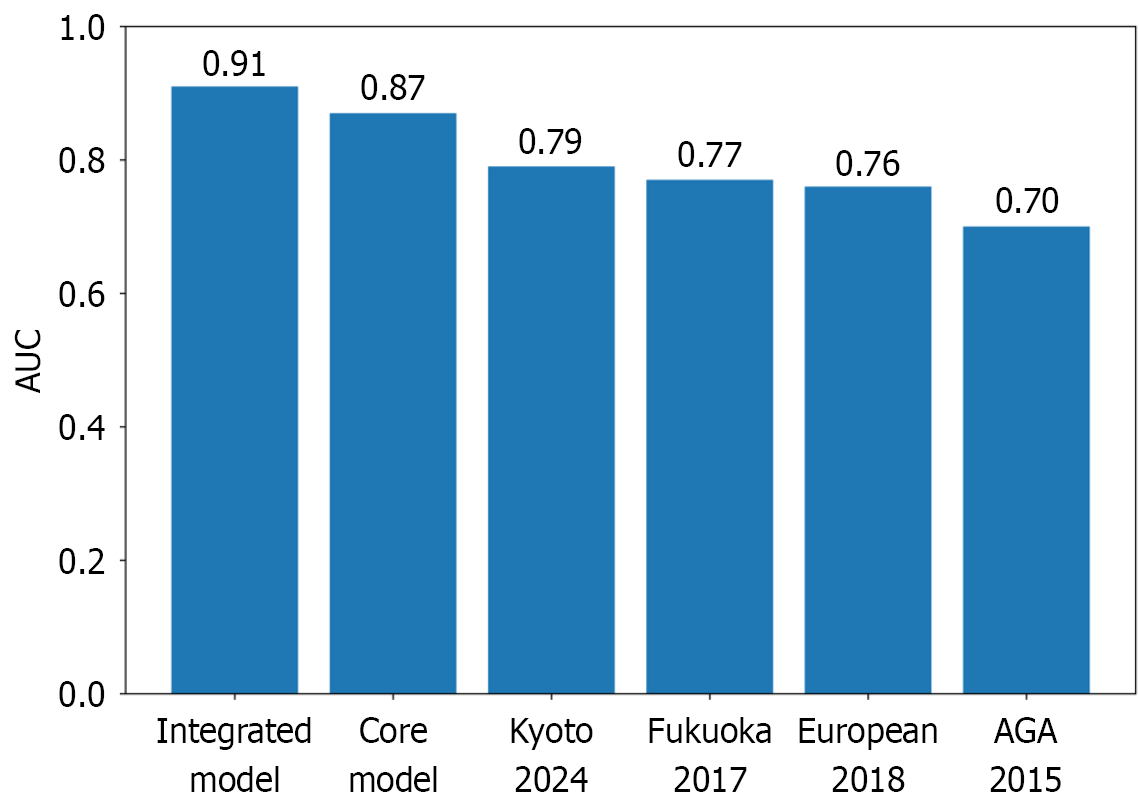
Figure 1 Area under the curve comparison of prediction models and guideline-based criteria.
Bar plot illustrating the discriminative performance of the integrated multimodal model and the core clinical-endoscopic ultrasound model in the validation cohort (n = 56; 17 advanced neoplasia, 39 non-advanced), alongside the area under the curve (AUC) values of international guideline-based criteria (American Gastroenterological Association 2015, Fukuoka 2017, European 2018, Kyoto 2024). The integrated multimodal model demonstrated the highest AUC (0.91), followed by the core model (0.87). Guideline-based criteria showed lower discriminative performance (AUC range: 0.70-0.79). The Kyoto 2024 AUC reflects evaluation within the intraductal papillary mucinous neoplasm subset (n = 161), consistent with its intended scope. AGA: American Gastroenterological Association; AUC: Area under the curve.
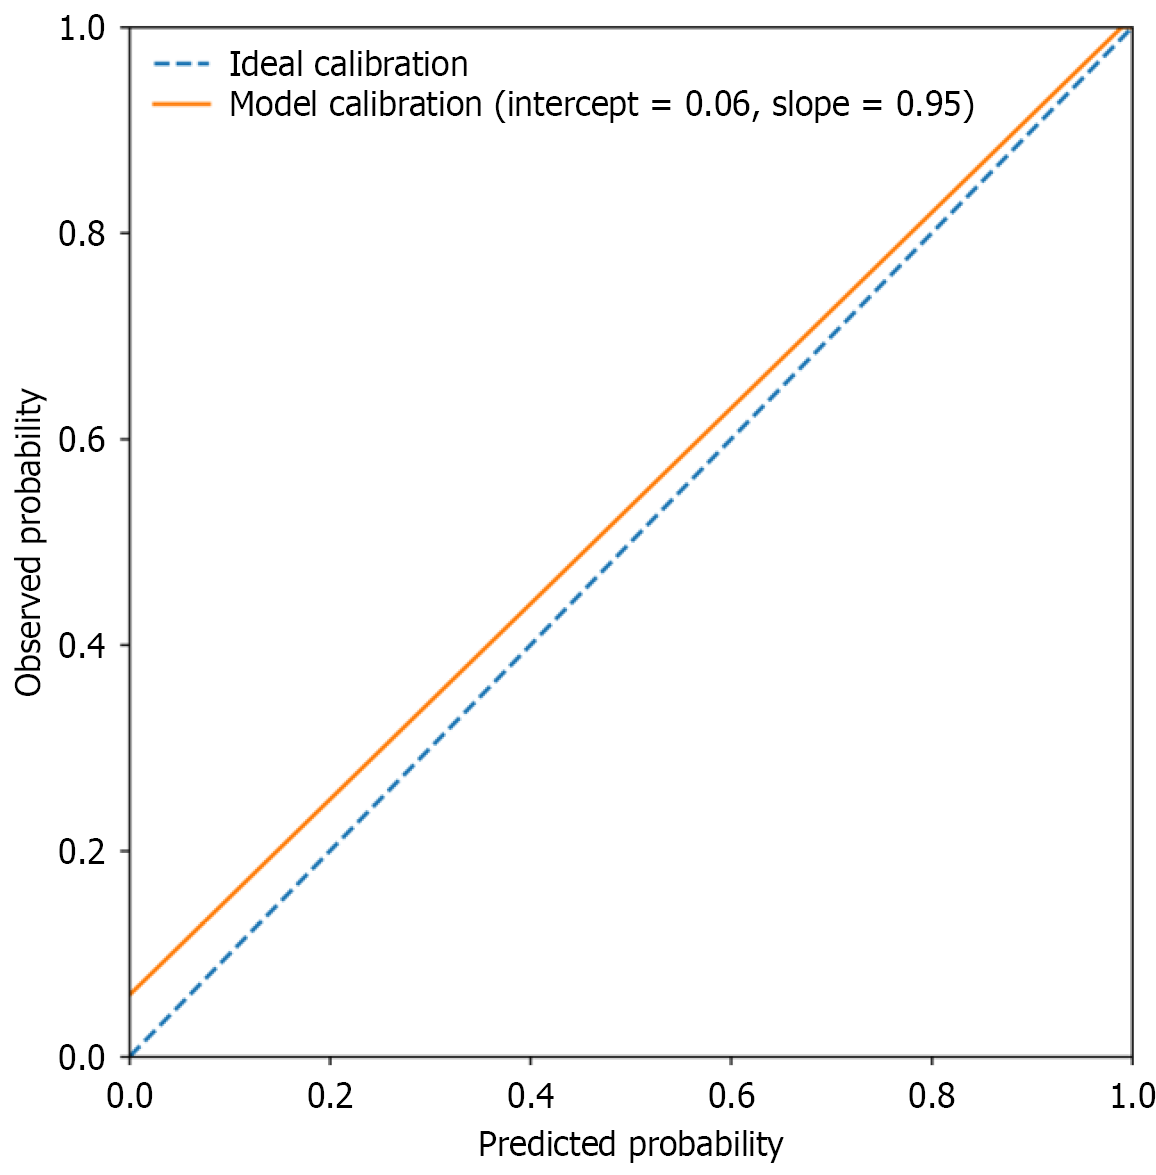
Figure 2 Calibration plot of the integrated multimodal model in the validation cohort (n = 56).
Calibration plot comparing predicted vs observed probabilities of advanced neoplasia across deciles of risk. The diagonal line represents perfect calibration. The model demonstrated good agreement between predicted and observed risk (calibration intercept 0.06; slope 0.95; Brier score 0.11), indicating stable probability estimation in internal validation.
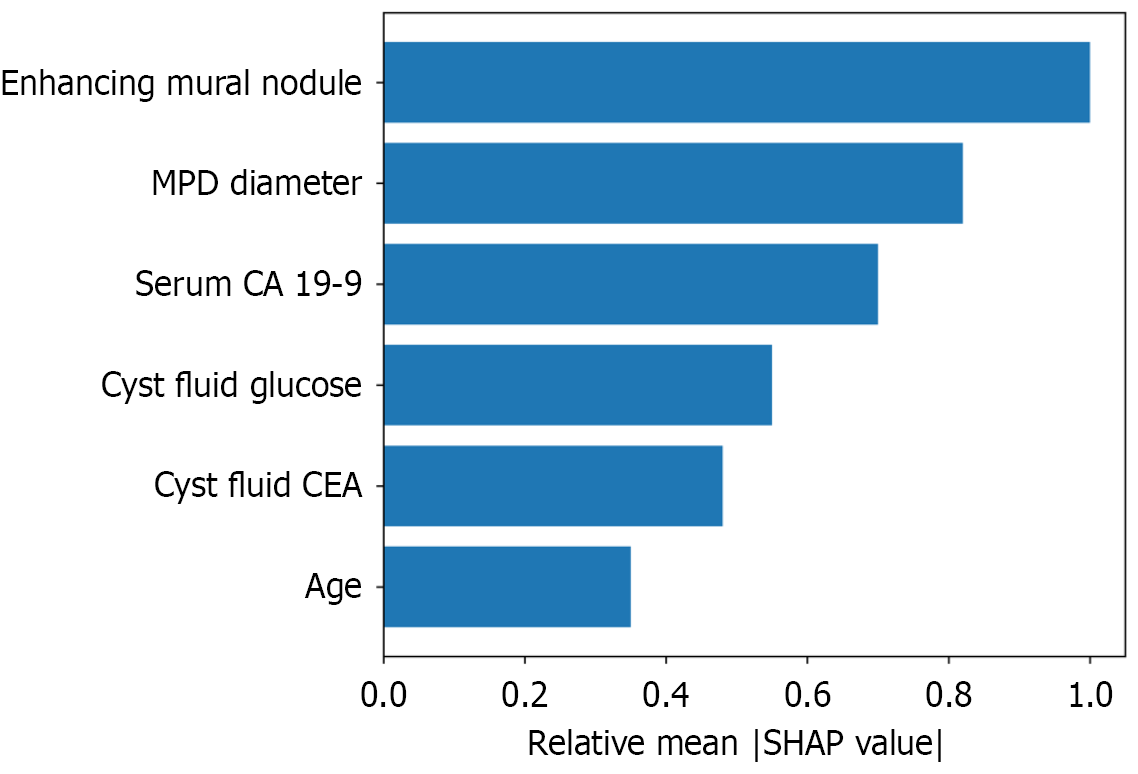
Figure 3 Relative SHapley Additive exPlanations feature importance for the integrated multimodal model.
The bar plot illustrates the relative mean absolute SHapley Additive exPlanations (SHAP) values of predictors in the integrated multimodal model. Enhancing mural nodules demonstrated the greatest contribution to predicted risk of advanced neoplasia, followed by main pancreatic duct diameter, serum carbohydrate antigen 19-9, cyst fluid glucose, cyst fluid carcinoembryonic antigen, and age. Feature contributions are presented as relative mean absolute SHAP values, reflecting overall predictor importance in the model. MPD: Main pancreatic duct; CEA: Carcinoembryonic antigen; CA 19-9: Carbohydrate antigen 19-9; SHAP: SHapley Additive exPlanations.
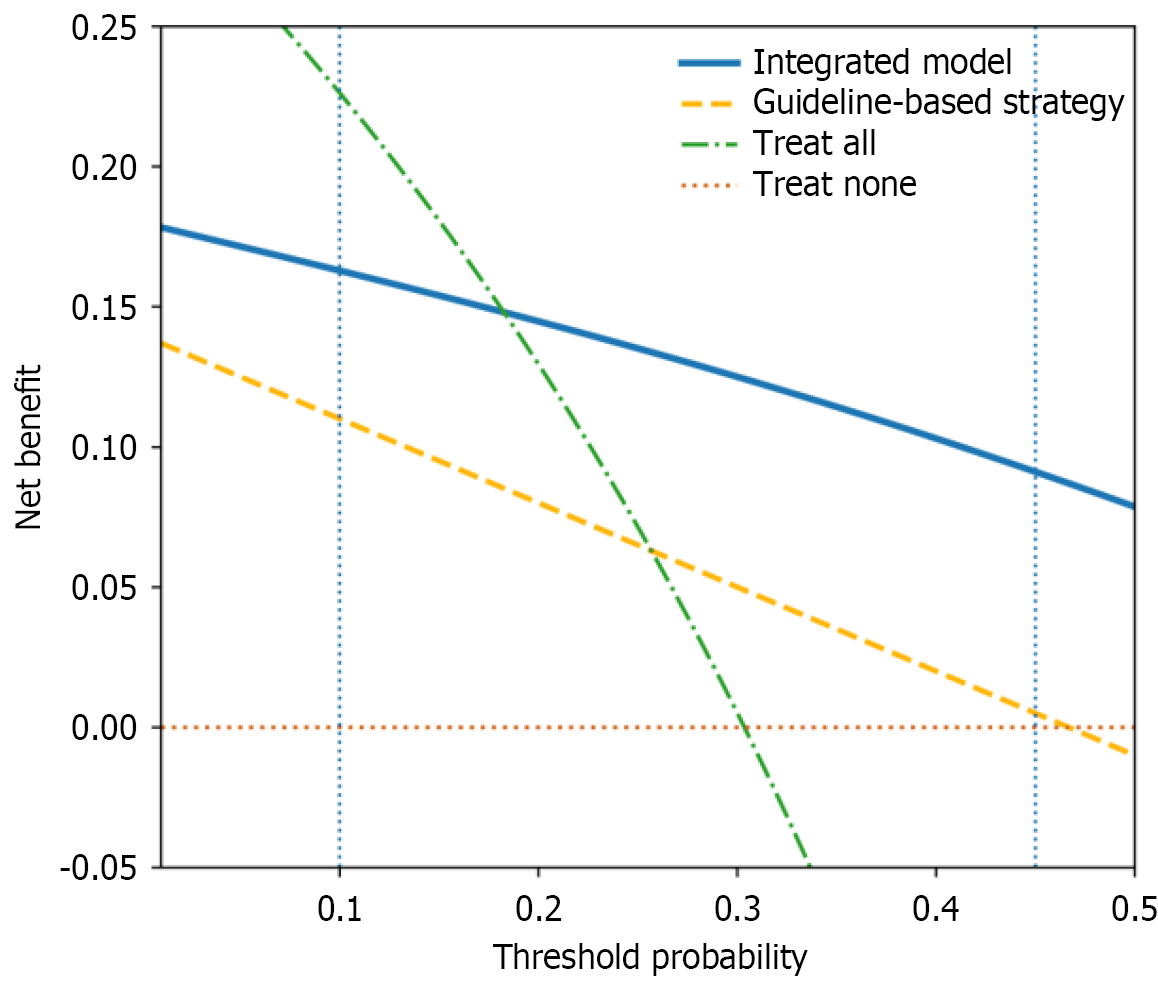
Figure 4 Decision curve analysis comparing net clinical benefit of the integrated model and guideline-based strategies.
Decision curve analysis illustrating net benefit across threshold probabilities between 5% and 50% for recommending surgical resection. The integrated multimodal model demonstrates superior net benefit across clinically relevant thresholds compared with guideline-based criteria. Horizontal lines represent “treat all” and “treat none” strategies. Because all patients in the cohort underwent resection, net benefit estimates reflect counterfactual model-based scenarios.
- Citation: Özden Y, Yüzügülen Ö, Omurca F. Interpretable multimodal artificial intelligence model for predicting advanced neoplasia in pancreatic cystic lesions. World J Gastrointest Oncol 2026; 18(7): 119847
- URL: https://www.wjgnet.com/1948-5204/full/v18/i7/119847.htm
- DOI: https://dx.doi.org/10.4251/wjgo.v18.i7.119847