
















Copyright: ©Author(s) 2026.
World J Gastrointest Oncol. Jul 15, 2026; 18(7): 119040
Published online Jul 15, 2026. doi: 10.4251/wjgo.v18.i7.119040
Published online Jul 15, 2026. doi: 10.4251/wjgo.v18.i7.119040
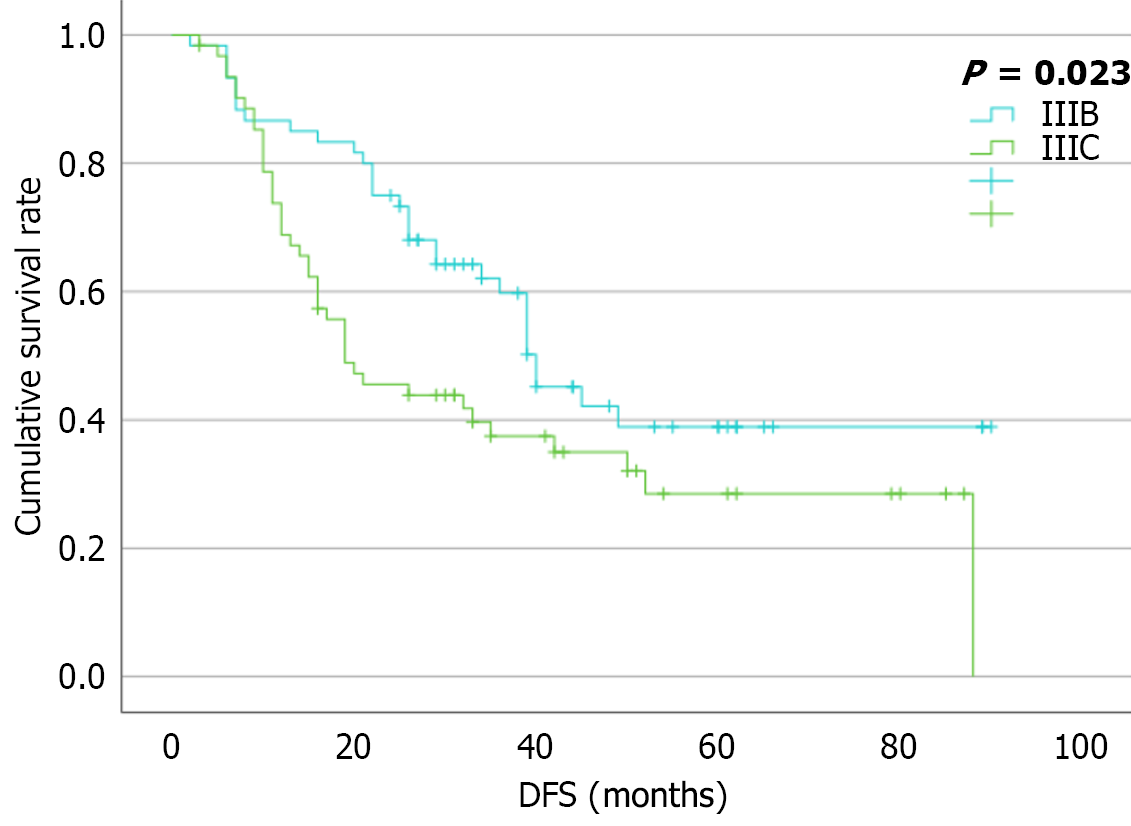
Figure 1 Kaplan-Meier survival curves comparing cumulative survival rates after radical gastrectomy between stage IIIB and stage IIIC gastric cancer.
DFS: Disease-free survival.
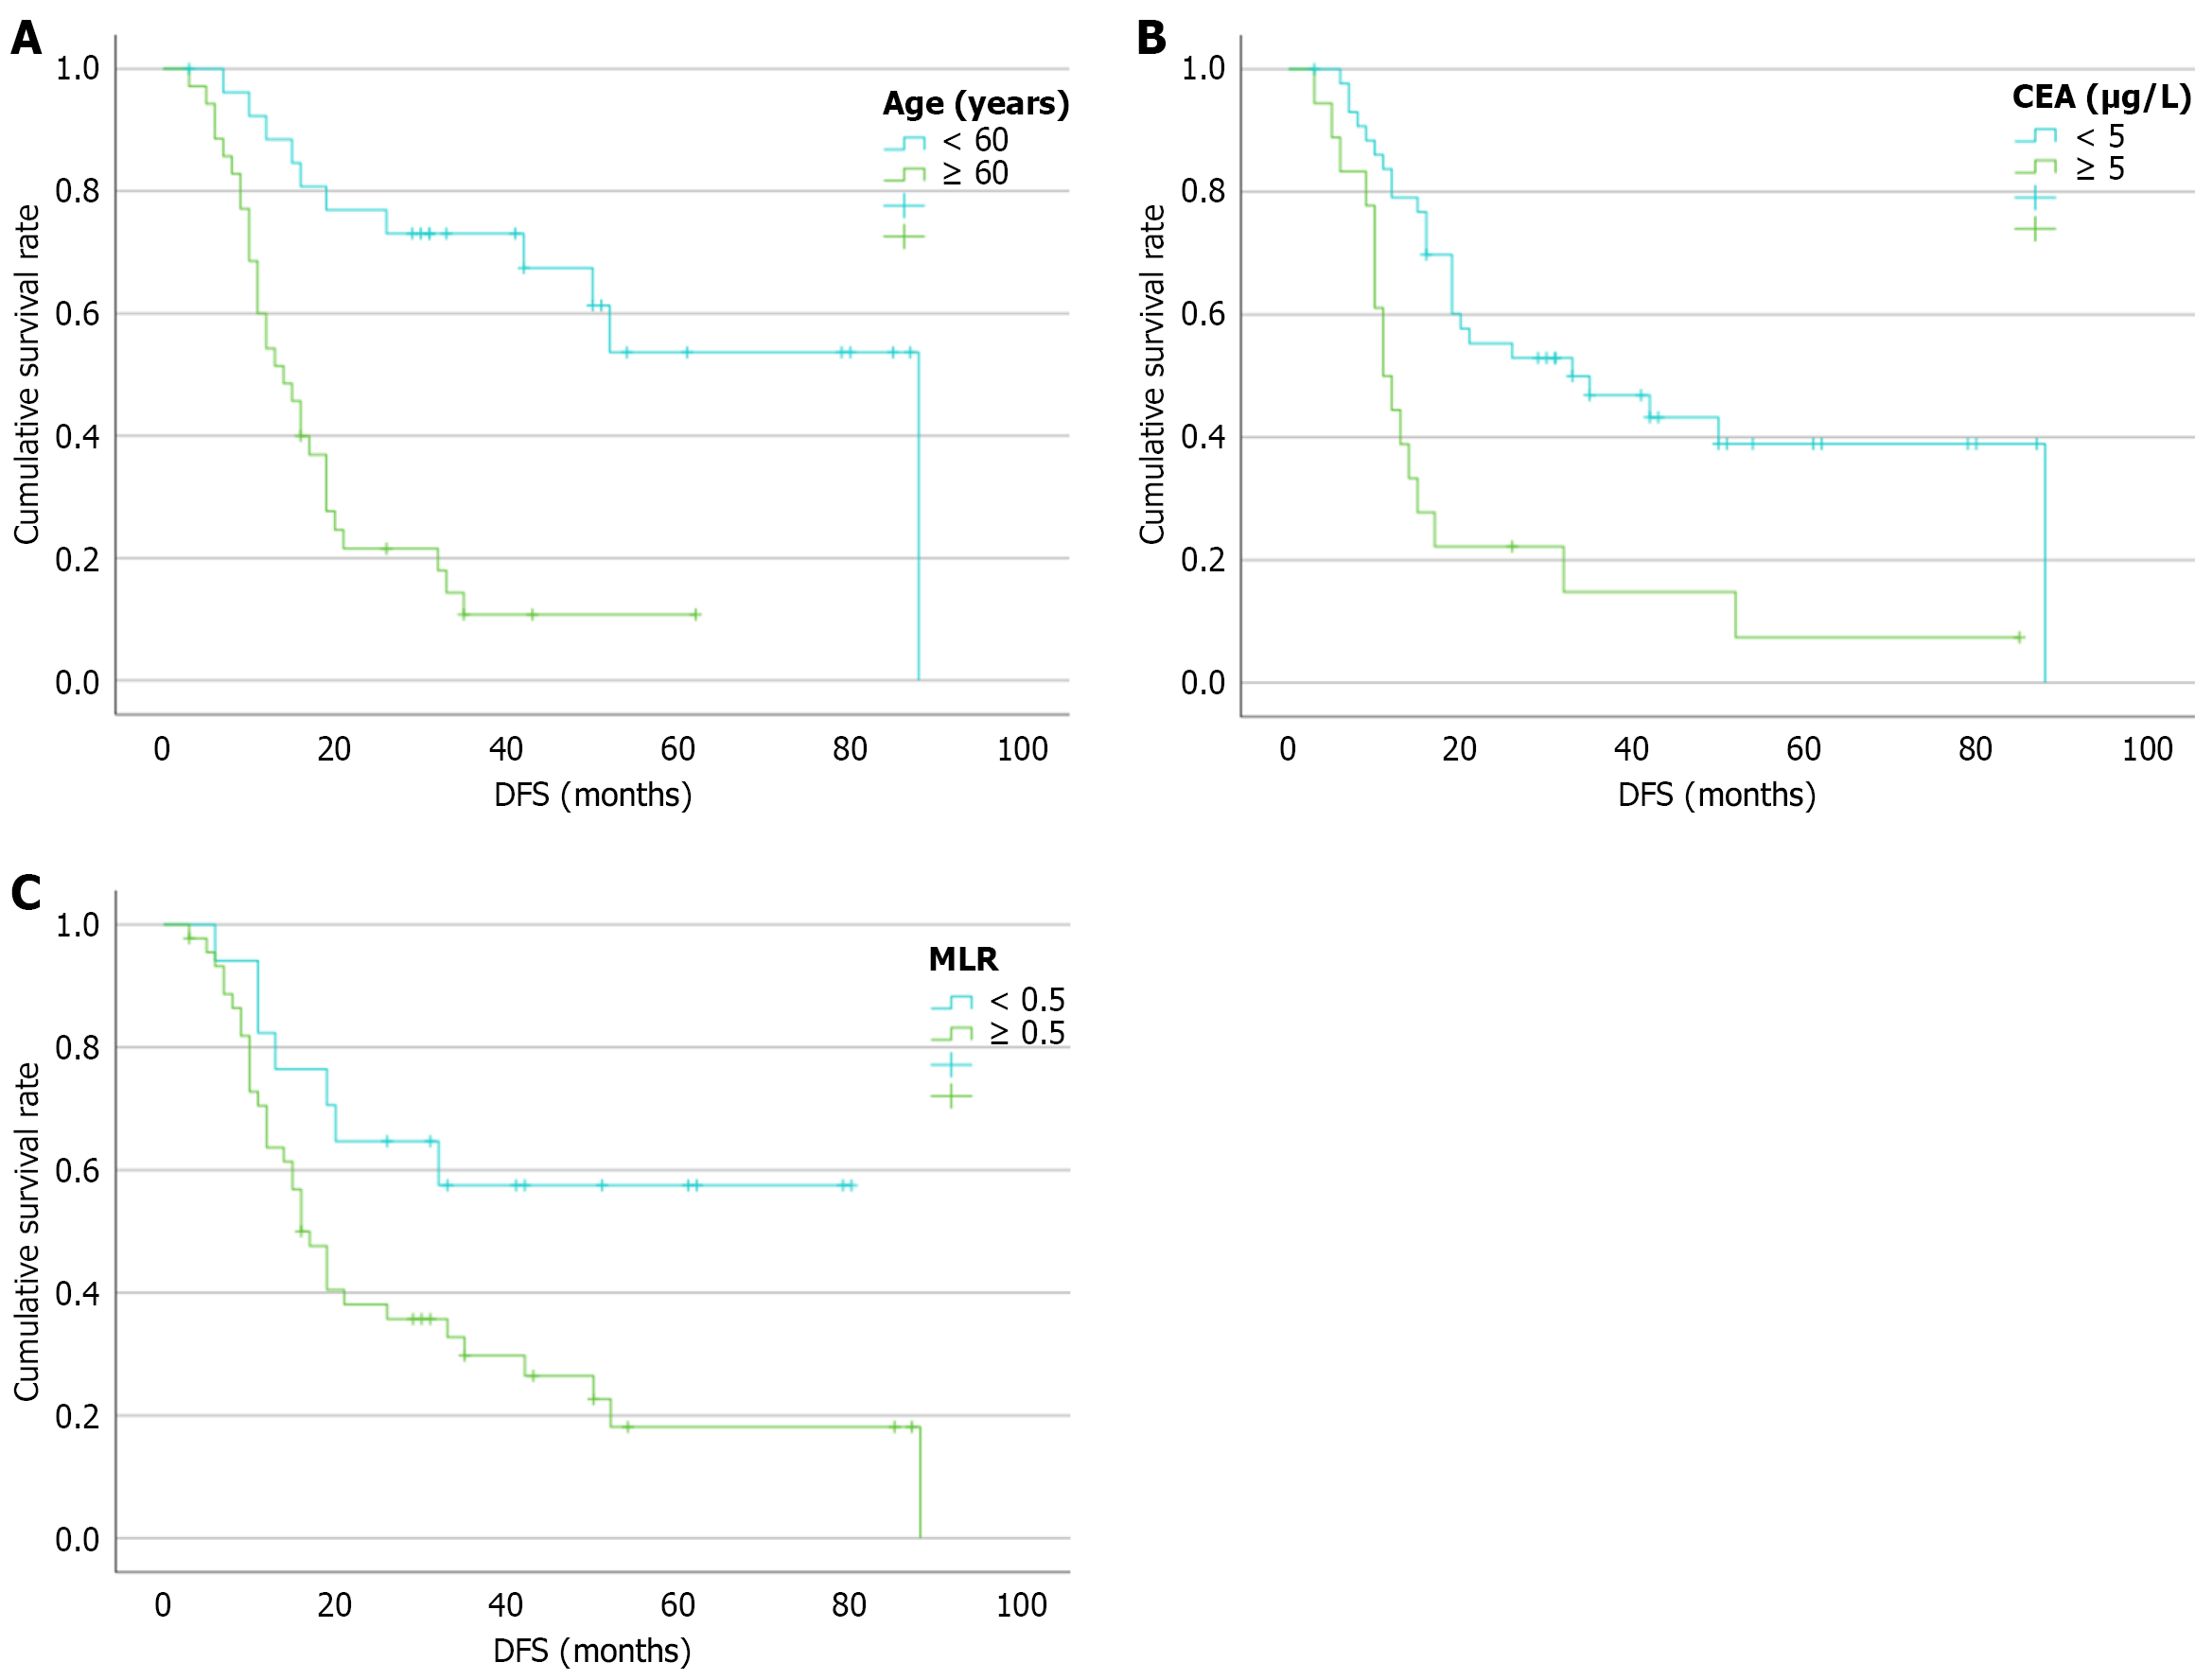
Figure 2 Kaplan-Meier survival curves of prognostic factors following radical gastrectomy in stage IIIC gastric cancer.
A: Age ≥ 60 vs age < 60 years, P < 0.001; B: Carcinoembryonic antigen ≥ 5.0 μg/L vs carcinoembryonic antigen < 5.0 μg/L, P < 0.001; C: Metastatic lymph node ratio ≥ 0.5 vs metastatic lymph node ratio < 0.5 P = 0.007. CEA: Carcinoembryonic antigen; MLR: Metastatic lymph node ratio; DFS: Disease-free survival.
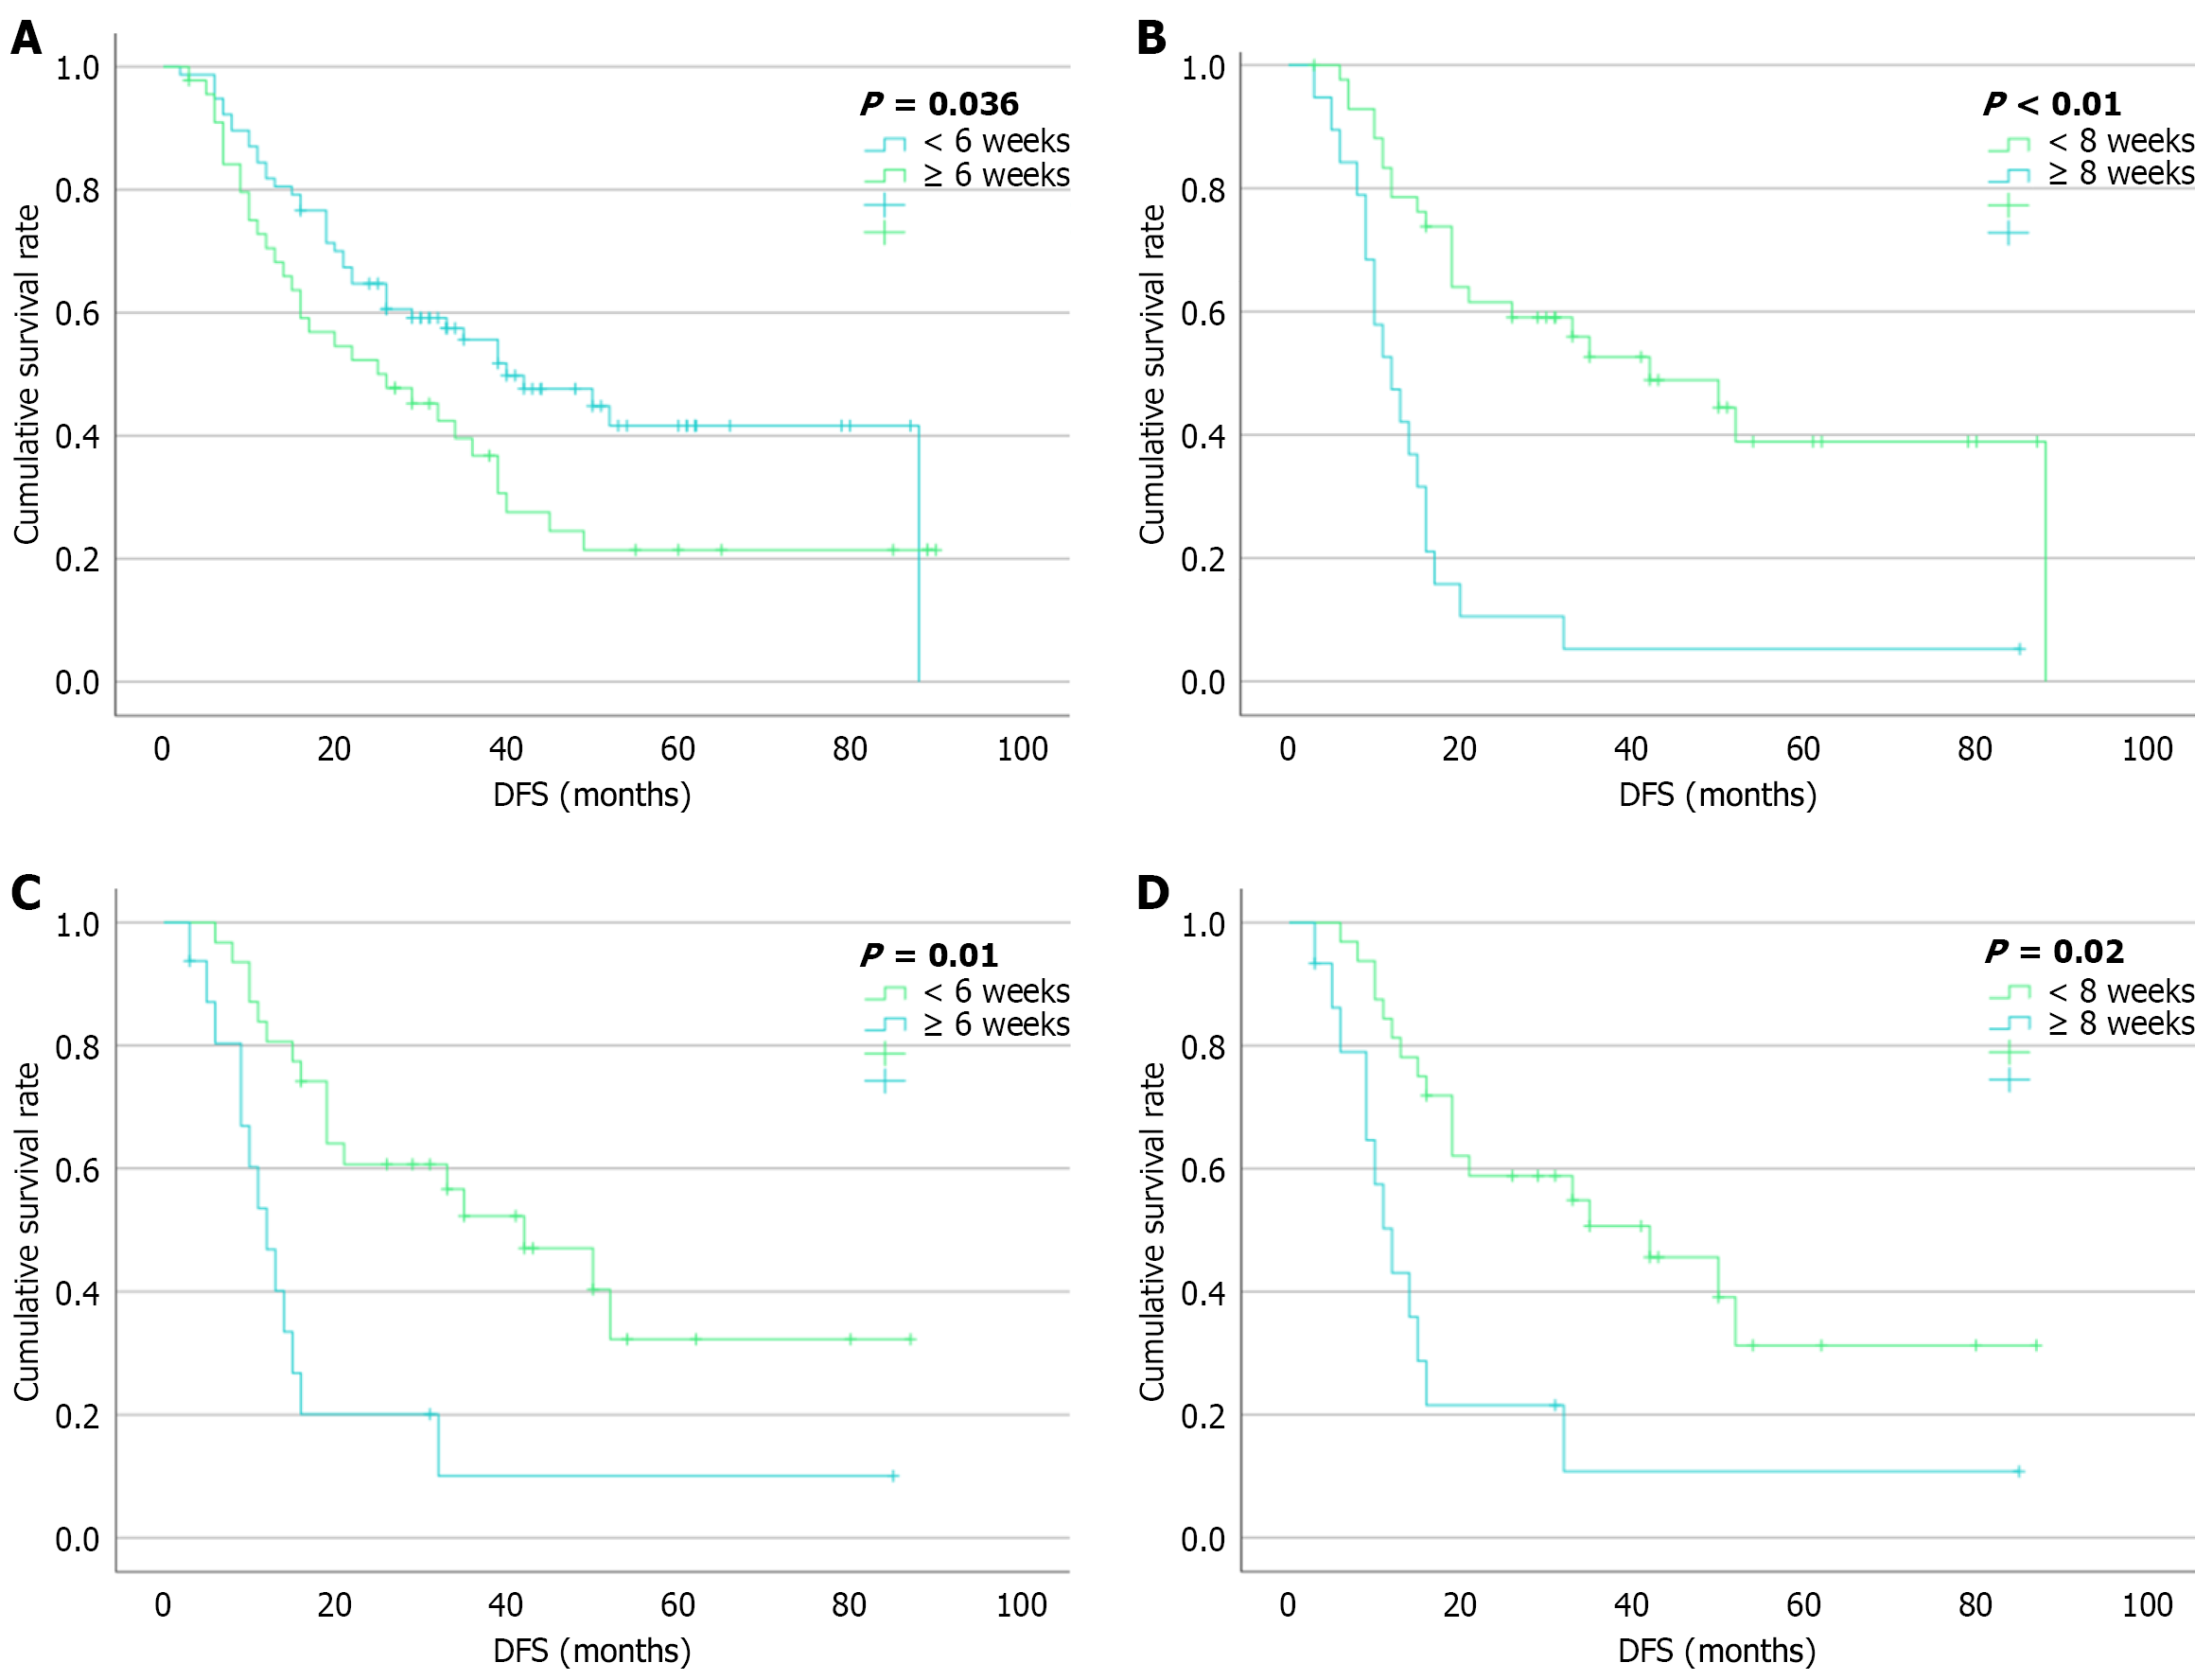
Figure 3 Kaplan-Meier survival curves for stage IIIC gastric cancer stratified by adjuvant chemotherapy regimen and initiation timing.
A: All patients: < 6 weeks vs ≥ 6 weeks; B: All patients: < 8 weeks vs ≥ 8 weeks; C: S-1 plus oxaliplatin subset: < 6 weeks vs ≥ 6 weeks; D: S-1 plus oxaliplatin subset: < 8 weeks vs ≥ 8 weeks. DFS: Disease-free survival.
- Citation: Wu JW, Li F, Wang SD, Guo YK, Li BH, Zhou X, Su GQ, Lu CH. Prognostic factors and optimal timing for initiating adjuvant chemotherapy in stage IIIC gastric cancer. World J Gastrointest Oncol 2026; 18(7): 119040
- URL: https://www.wjgnet.com/1948-5204/full/v18/i7/119040.htm
- DOI: https://dx.doi.org/10.4251/wjgo.v18.i7.119040