
















Copyright: ©Author(s) 2026.
World J Gastrointest Oncol. Jul 15, 2026; 18(7): 118787
Published online Jul 15, 2026. doi: 10.4251/wjgo.118787
Published online Jul 15, 2026. doi: 10.4251/wjgo.118787
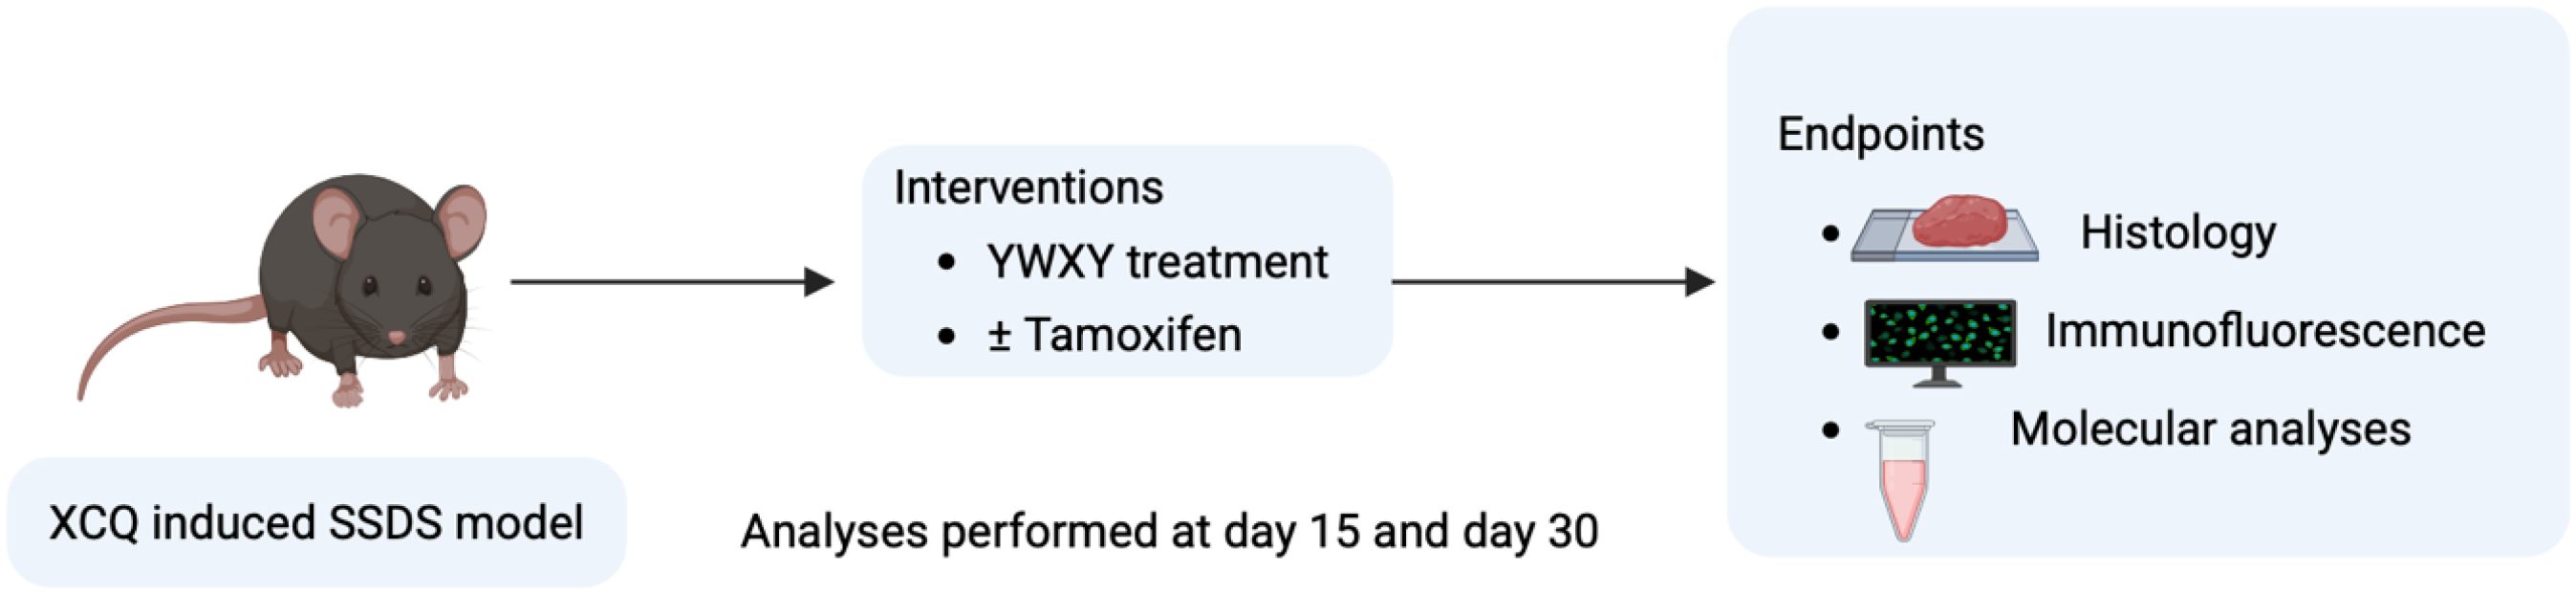
Figure 1 Simplified overview of the experimental design.
A spleen-stomach deficiency syndrome associated gastric injury model was established using Xiao Chengqi decoction. Following model induction, mice received therapeutic intervention with Yiwei Xiaoyu granules, with or without tamoxifen administration. Gastric tissues were collected at predefined time points (days 15 and 30) for histological, immunofluorescence, and molecular analyses. Detailed treatment schedules and group allocations are provided in Supplementary Figure 1. SSDS: Spleen-stomach deficiency syndrome; XCQ: Xiao Chengqi decoction; YWXY: Yiwei Xiaoyu granules. This figure was created by http://biorender.comhttps://http://biorender.com/8ozzrx8.
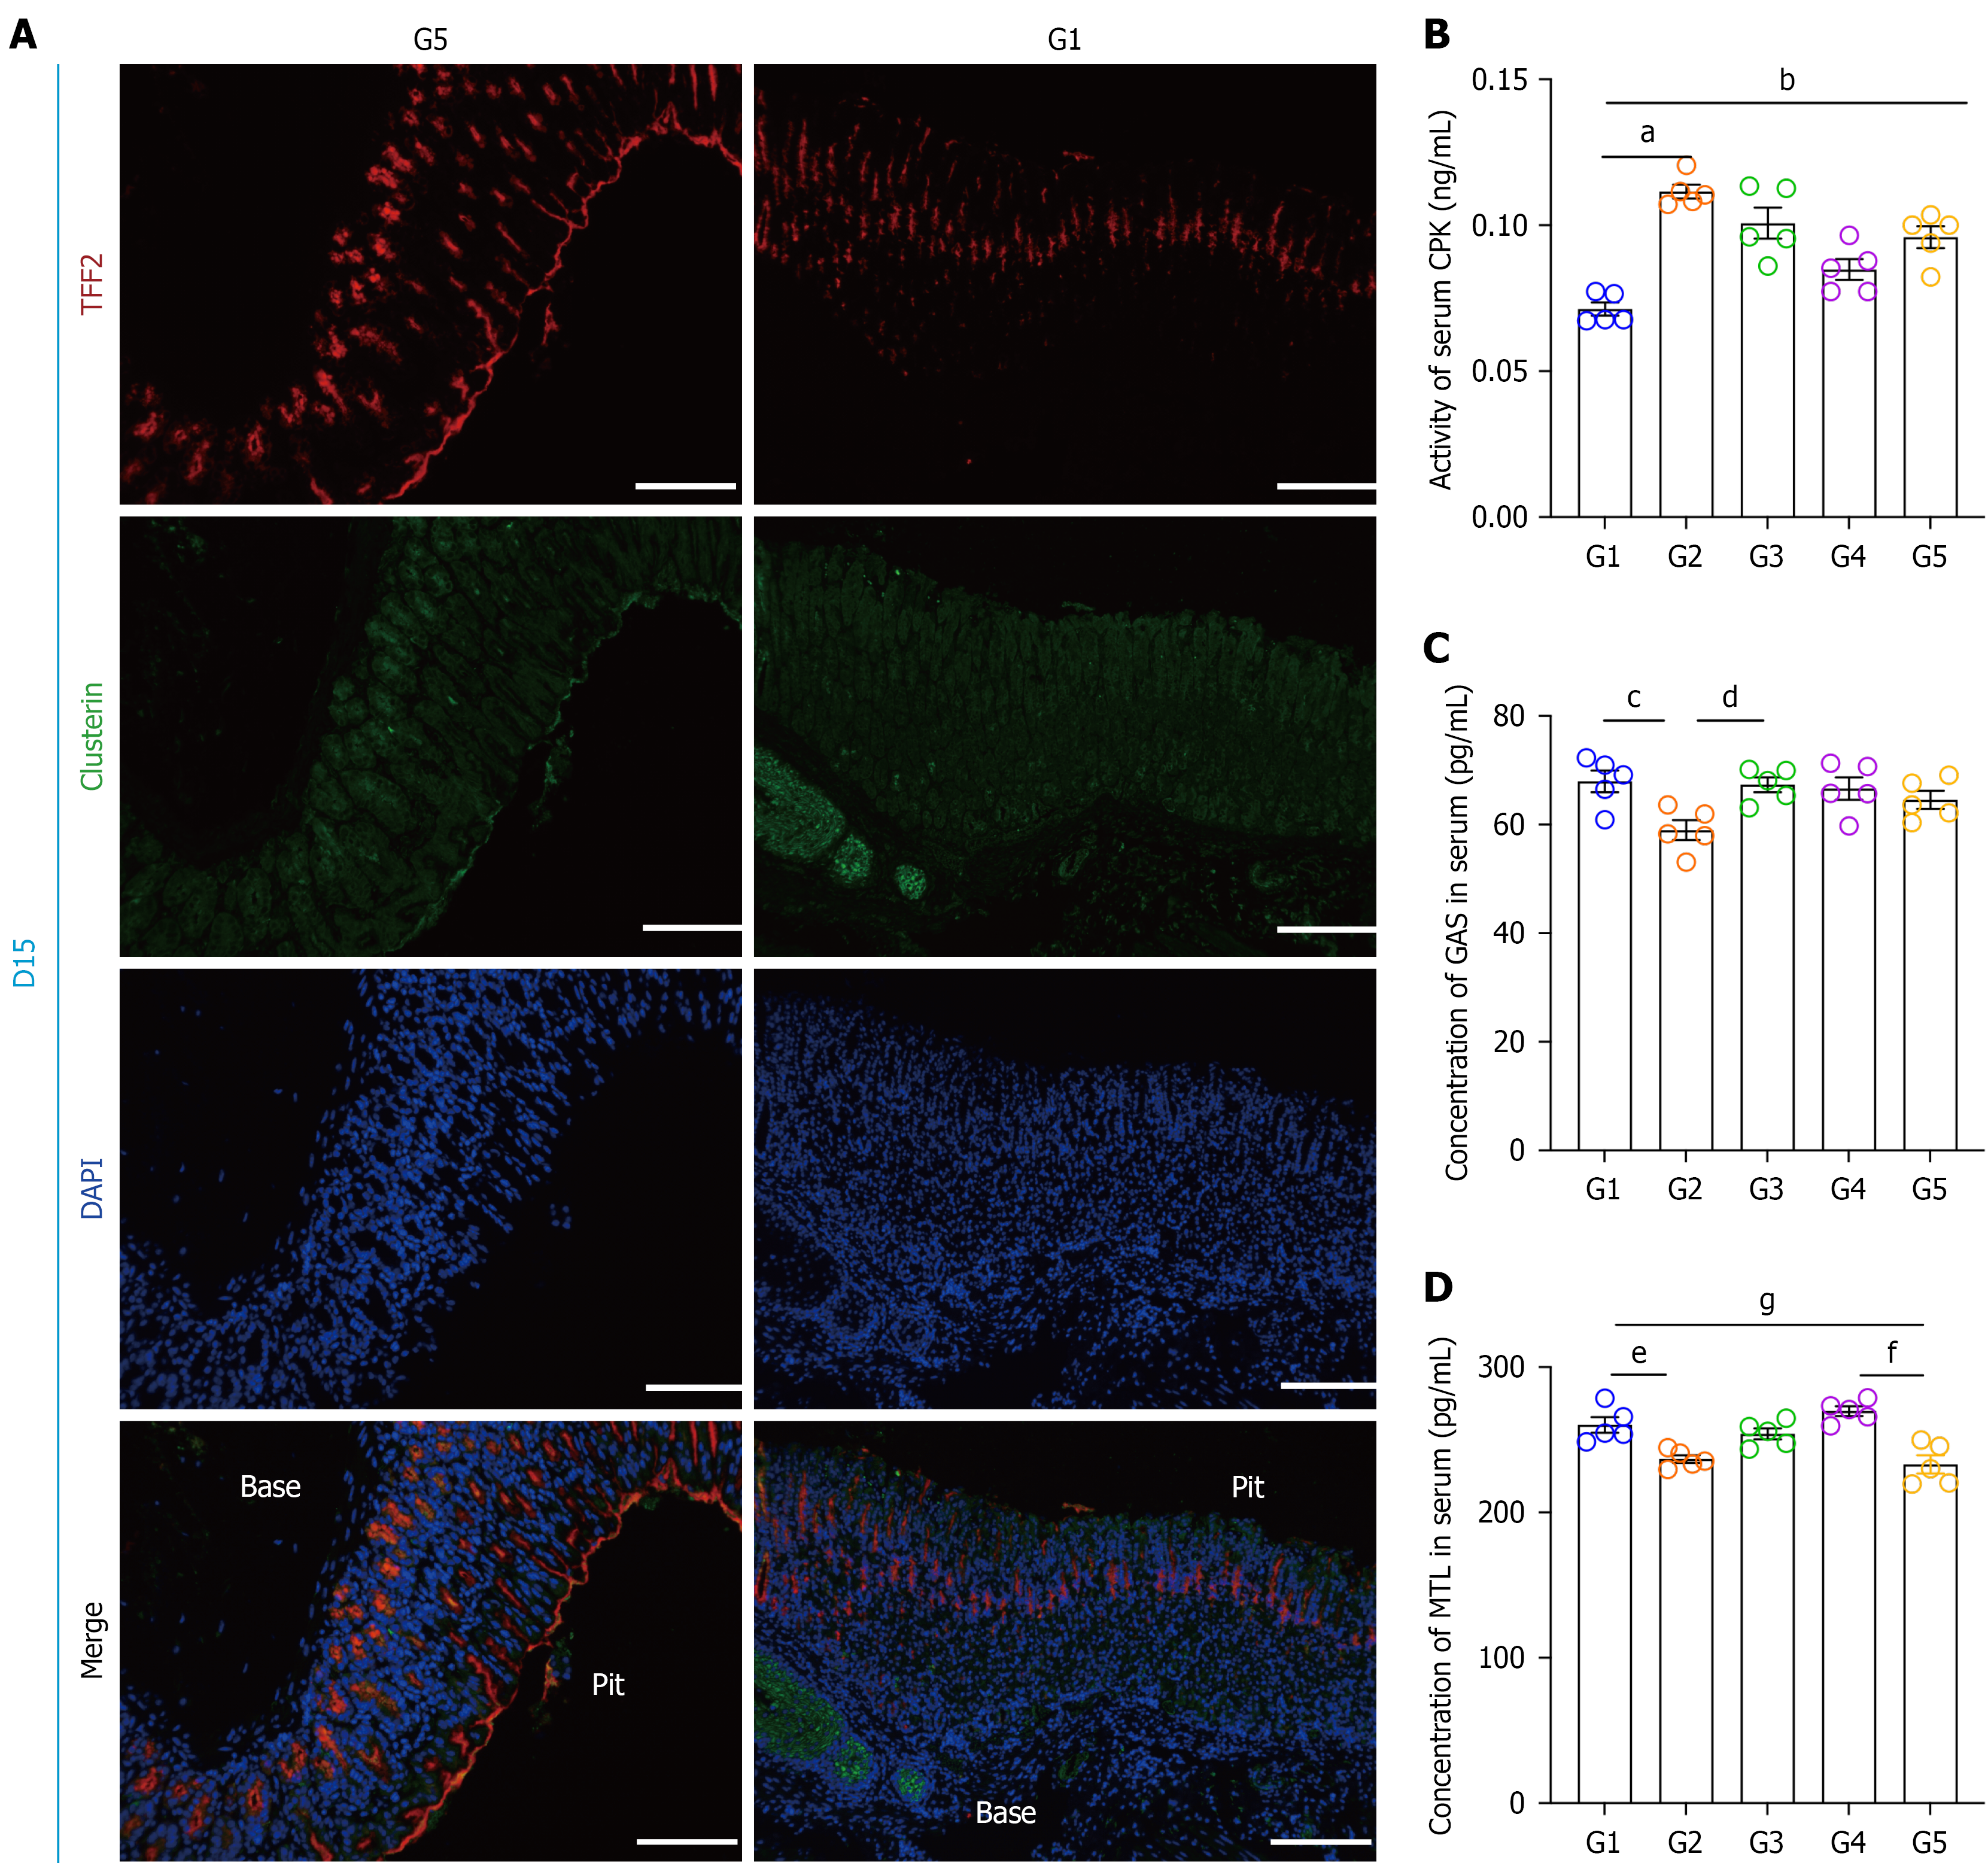
Figure 2 Validation of spasmolytic polypeptide-expressing metaplasia and spleen-stomach deficiency syndrome models through immunofluorescence and ELISA at day 15.
A: Gastric mucosal immunofluorescence showing translocation of TFF2 (red) and clusterin (green) from pit regions to glandular bases in spasmolytic polypeptide-expressing metaplasia + spleen-stomach deficiency syndrome co-induction (G5) vs normal architecture (G1). Nuclei counterstained with 4’, 6-diamidino-2-phenylindole (blue). Scale bar = 200 μm; B: Creatine phosphokinase; C: Gastrin; D: Motilin. aP < 0.0001 vs G2, bP < 0.001 vs G5, cP < 0.05 vs G2, dP < 0.05 vs G3, eP < 0.05 vs G2, fP < 0.001 vs G5, gP < 0.01 vs G5. Data are presented as mean ± SD (n = 5 per group). Statistical analysis was performed using one-way analysis of variance followed by Tukey’s multiple-comparisons test. CPK: Creatine phosphokinase; MTL: Motilin; GAS: Gastrin.
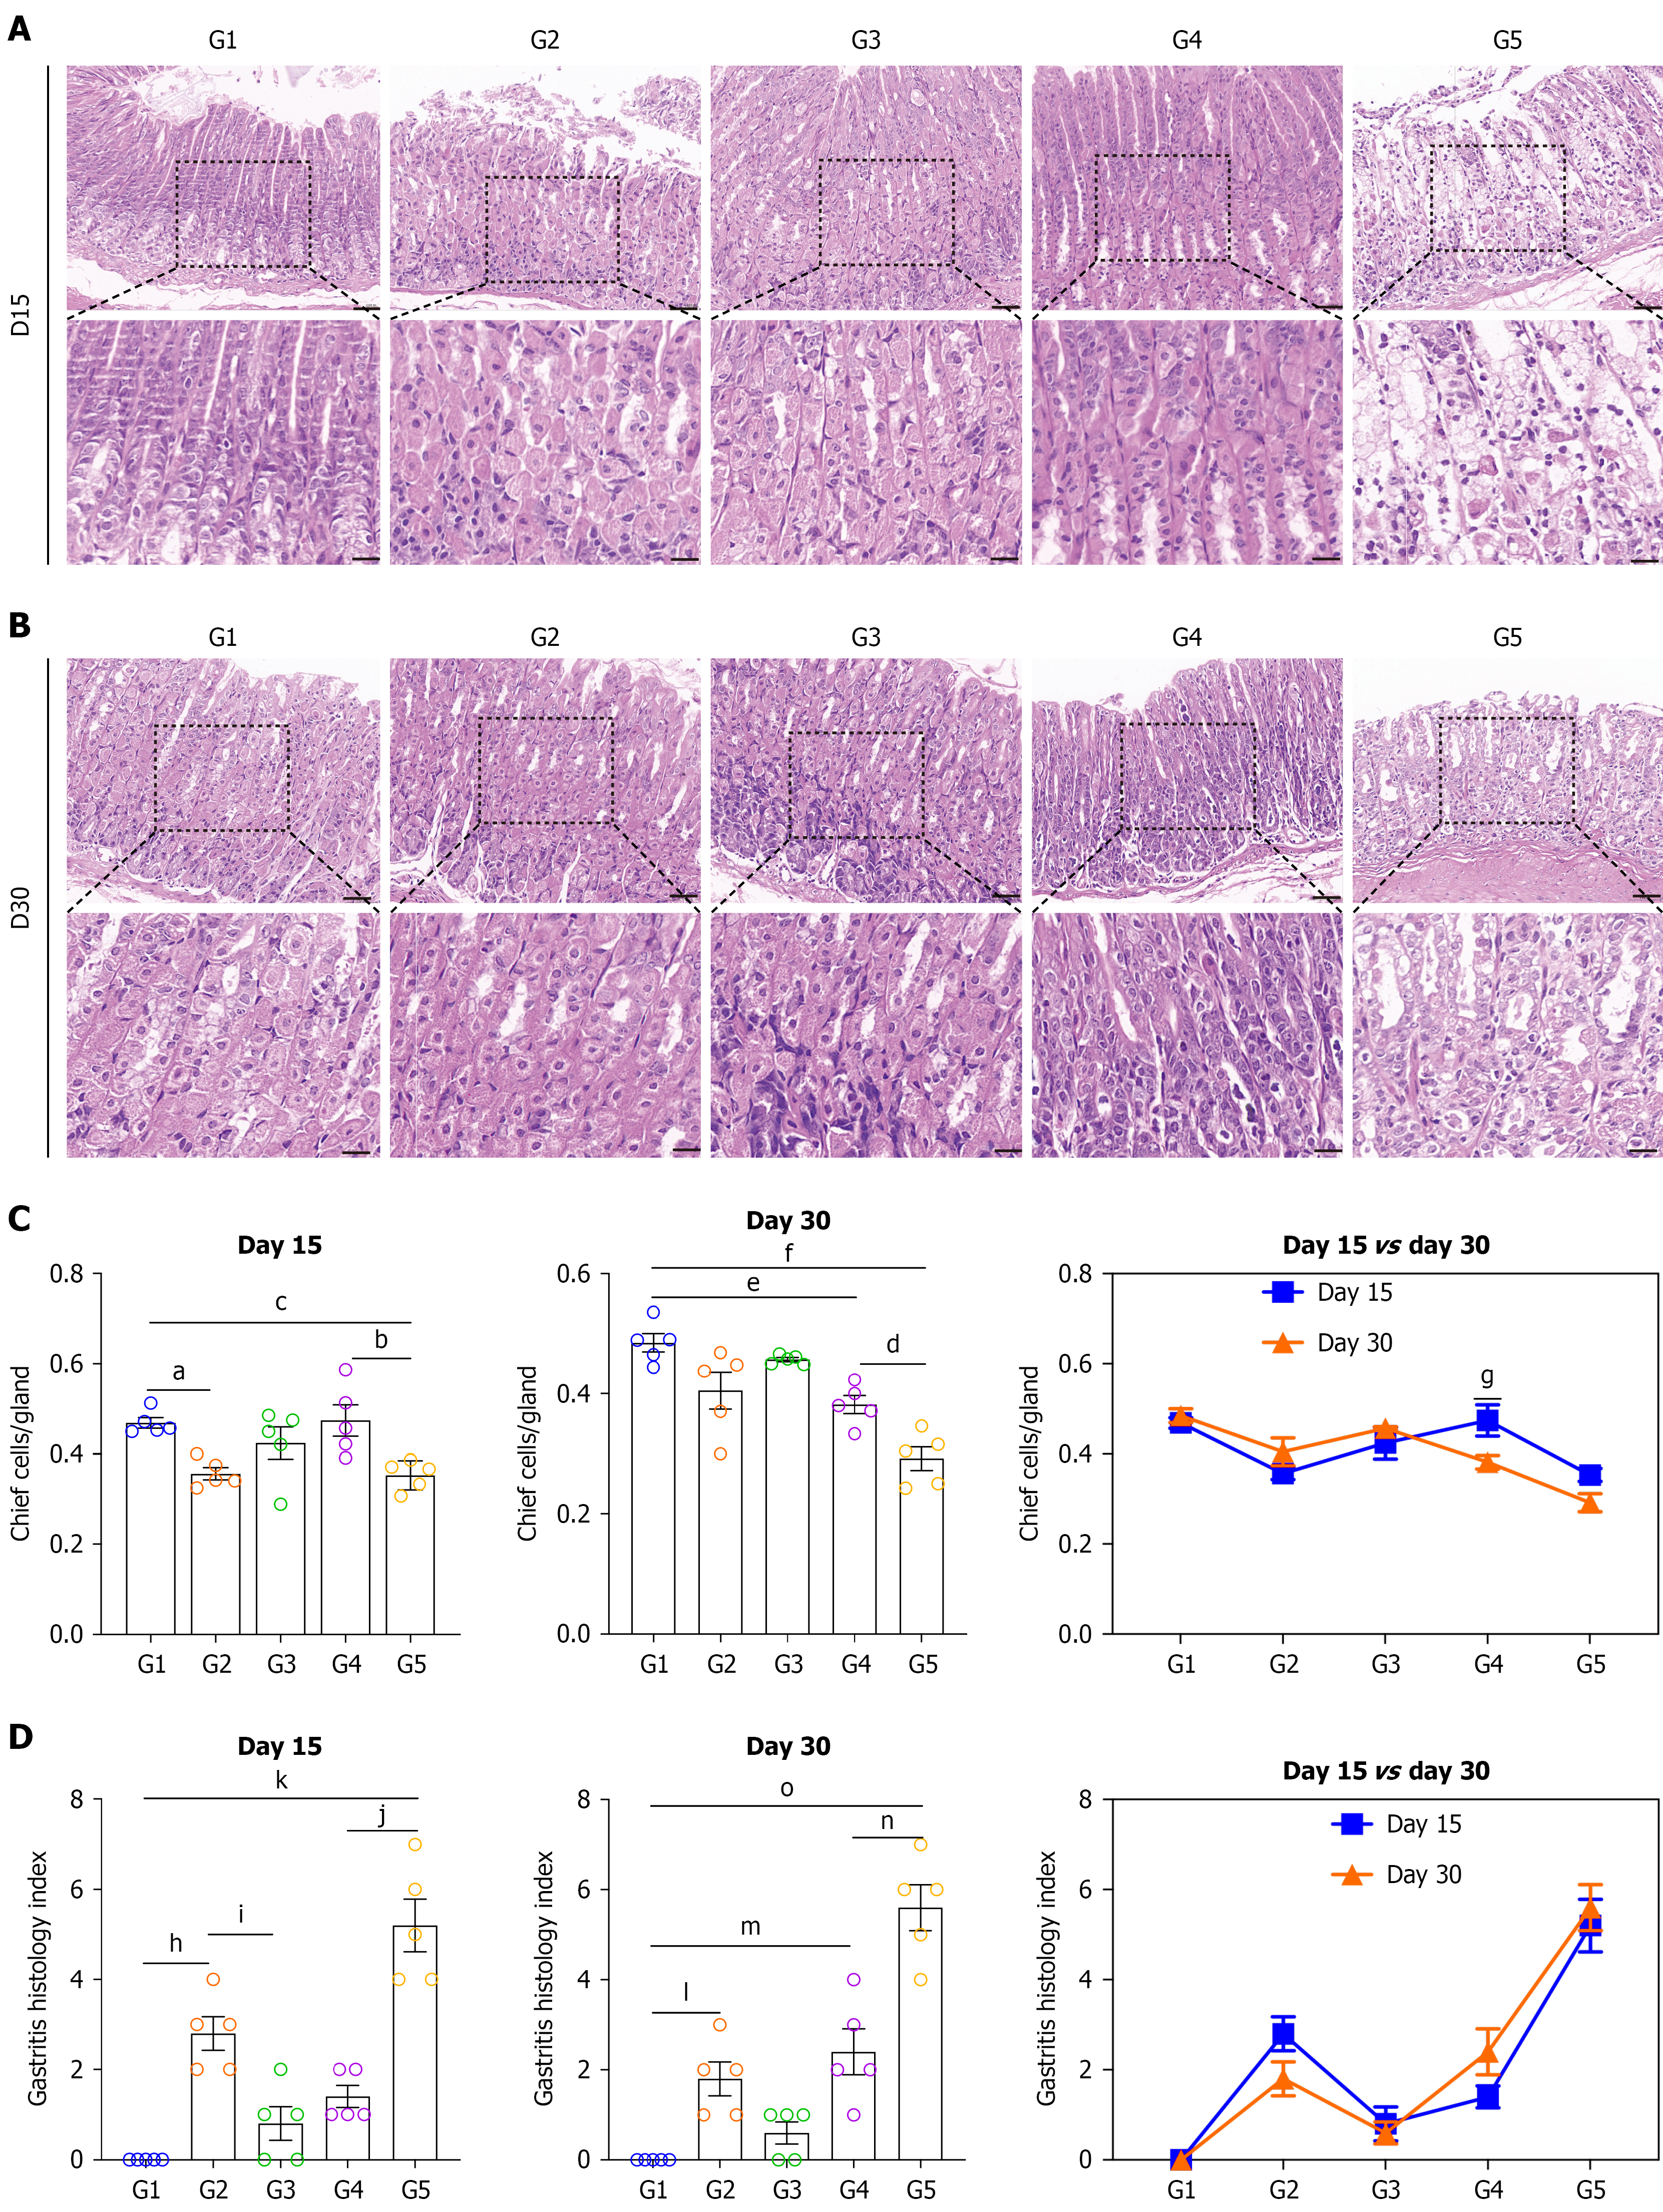
Figure 3 Histopathological restoration of gastric mucosa by Yiwei Xiaoyu granules treatment at days 15 and 30.
A: Representative hematoxylin and eosin (H&E) staining images at day 15 showing restoration of glandular architecture in spleen-stomach deficiency syndrome, spasmolytic polypeptide-expressing metaplasia, and combined models after Yiwei Xiaoyu granules (YWXY) treatment; B: Representative H&E staining images at day 30 demonstrating attenuation of glandular atrophy, inflammatory infiltration, and epithelial damage in YWXY-treated groups. Scale bar = 400 μm; C: Quantification of chief cell numbers at days 15 and 30; D: Quantification of gastritis histology index at days 15 and 30. Data are presented as mean ± SD (n = 5 per group). Statistical analysis was performed using two-way analysis of variance followed by Tukey’s multiple-comparisons test. aP < 0.05 vs G2, bP < 0.05 vs G5, cP < 0.05 vs G5, dP < 0.05 vs G5, eP < 0.01 vs G4, fP < 0.0001 vs G5, gP < 0.01 vs day 15 in G4, hP < 0.001 vs G2, iP < 0.01 vs G3, jP < 0.0001 vs G5, kP < 0.0001 vs G5, lP < 0.05 vs G2, mP < 0.01 vs G4, nP < 0.0001 vs G5, oP < 0.0001 vs G5.
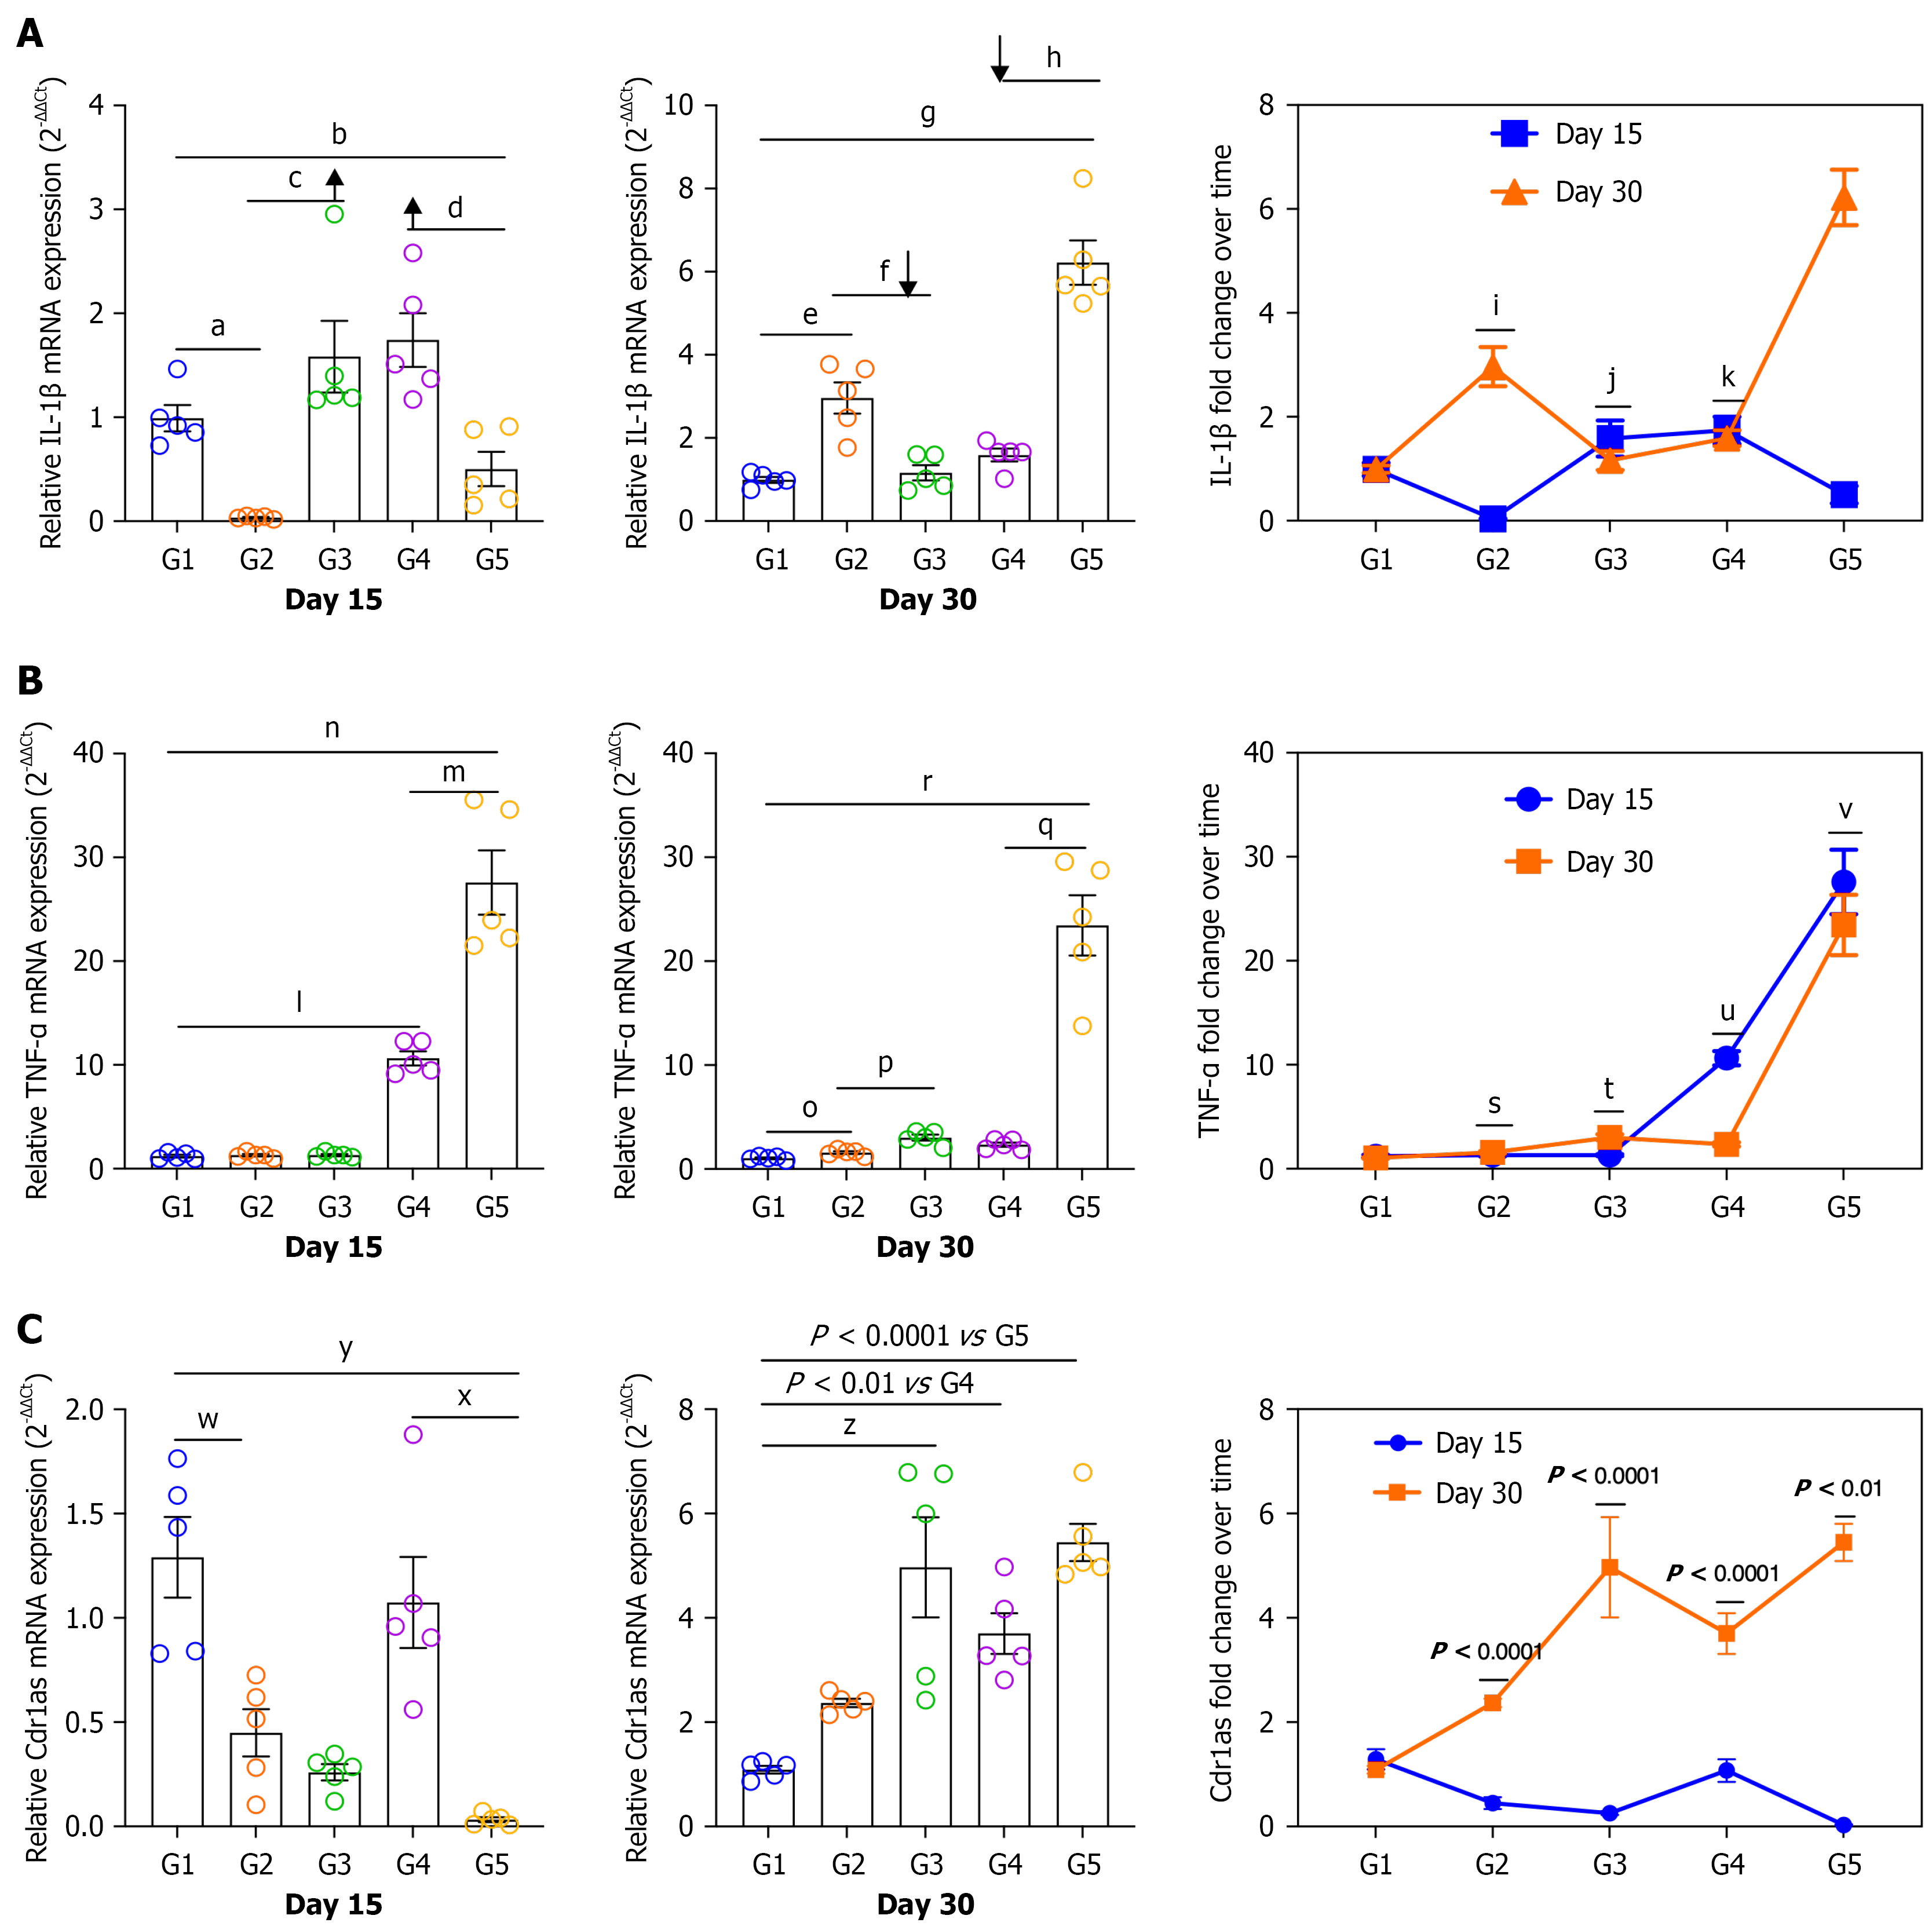
Figure 4 Yiwei Xiaoyu granules regulate inflammatory cytokines and Cdr1as expression in spleen-stomach deficiency syndrome and tamoxifen-induced spasmolytic polypeptide-expressing metaplasia models.
A: Fold-change of interleukin-1β mRNA levels on days 15 and 30. At day 15: aP < 0.0001 vs G2; bP < 0.01 vs G5; cP < 0.0001 vs G3; dP < 0.001 vs G5. At day 30: eP < 0.001 vs G2; fP < 0.01 vs G3; gP < 0.0001, hP < 0.0001 vs G5. In the right panel, iP < 0.0001, jP < 0.0001, kP < 0.0001 vs day 15 within the same group; B: Tumor necrosis factor-α mRNA expression on days 15 and 30. At day 15: iP < 0.0001 vs G4; mP < 0.0001 vs G5; nP < 0.0001 vs G5. At day 30: oP < 0.05 vs G2, pP < 0.001 vs G3, qP < 0.0001 vs G5, rP < 0.0001 vs G5. In the right panel, sP < 0.0001, tP < 0.0001, uP < 0.0001, vP < 0.0001 vs day 15 within the same group; C: Cdr1as expression across experimental groups at the indicated time points. At day 15: wP < 0.01 vs G2, xP < 0.0001 vs G5, yP < 0.0001 vs G5. At day 30: zP < 0.001 vs G3, P < 0.01 vs G4, P < 0.0001 vs G5. In the right panel, P < 0.0001, P < 0.0001 and P < 0.01 vs day 15 within the same group. Data are presented as mean ± SD (n = 5 per group). Statistical analysis was performed using two-way analysis of variance followed by Tukey’s multiple-comparisons test. IL: Interleukin; TNF-α: Tumor necrosis factor-α.
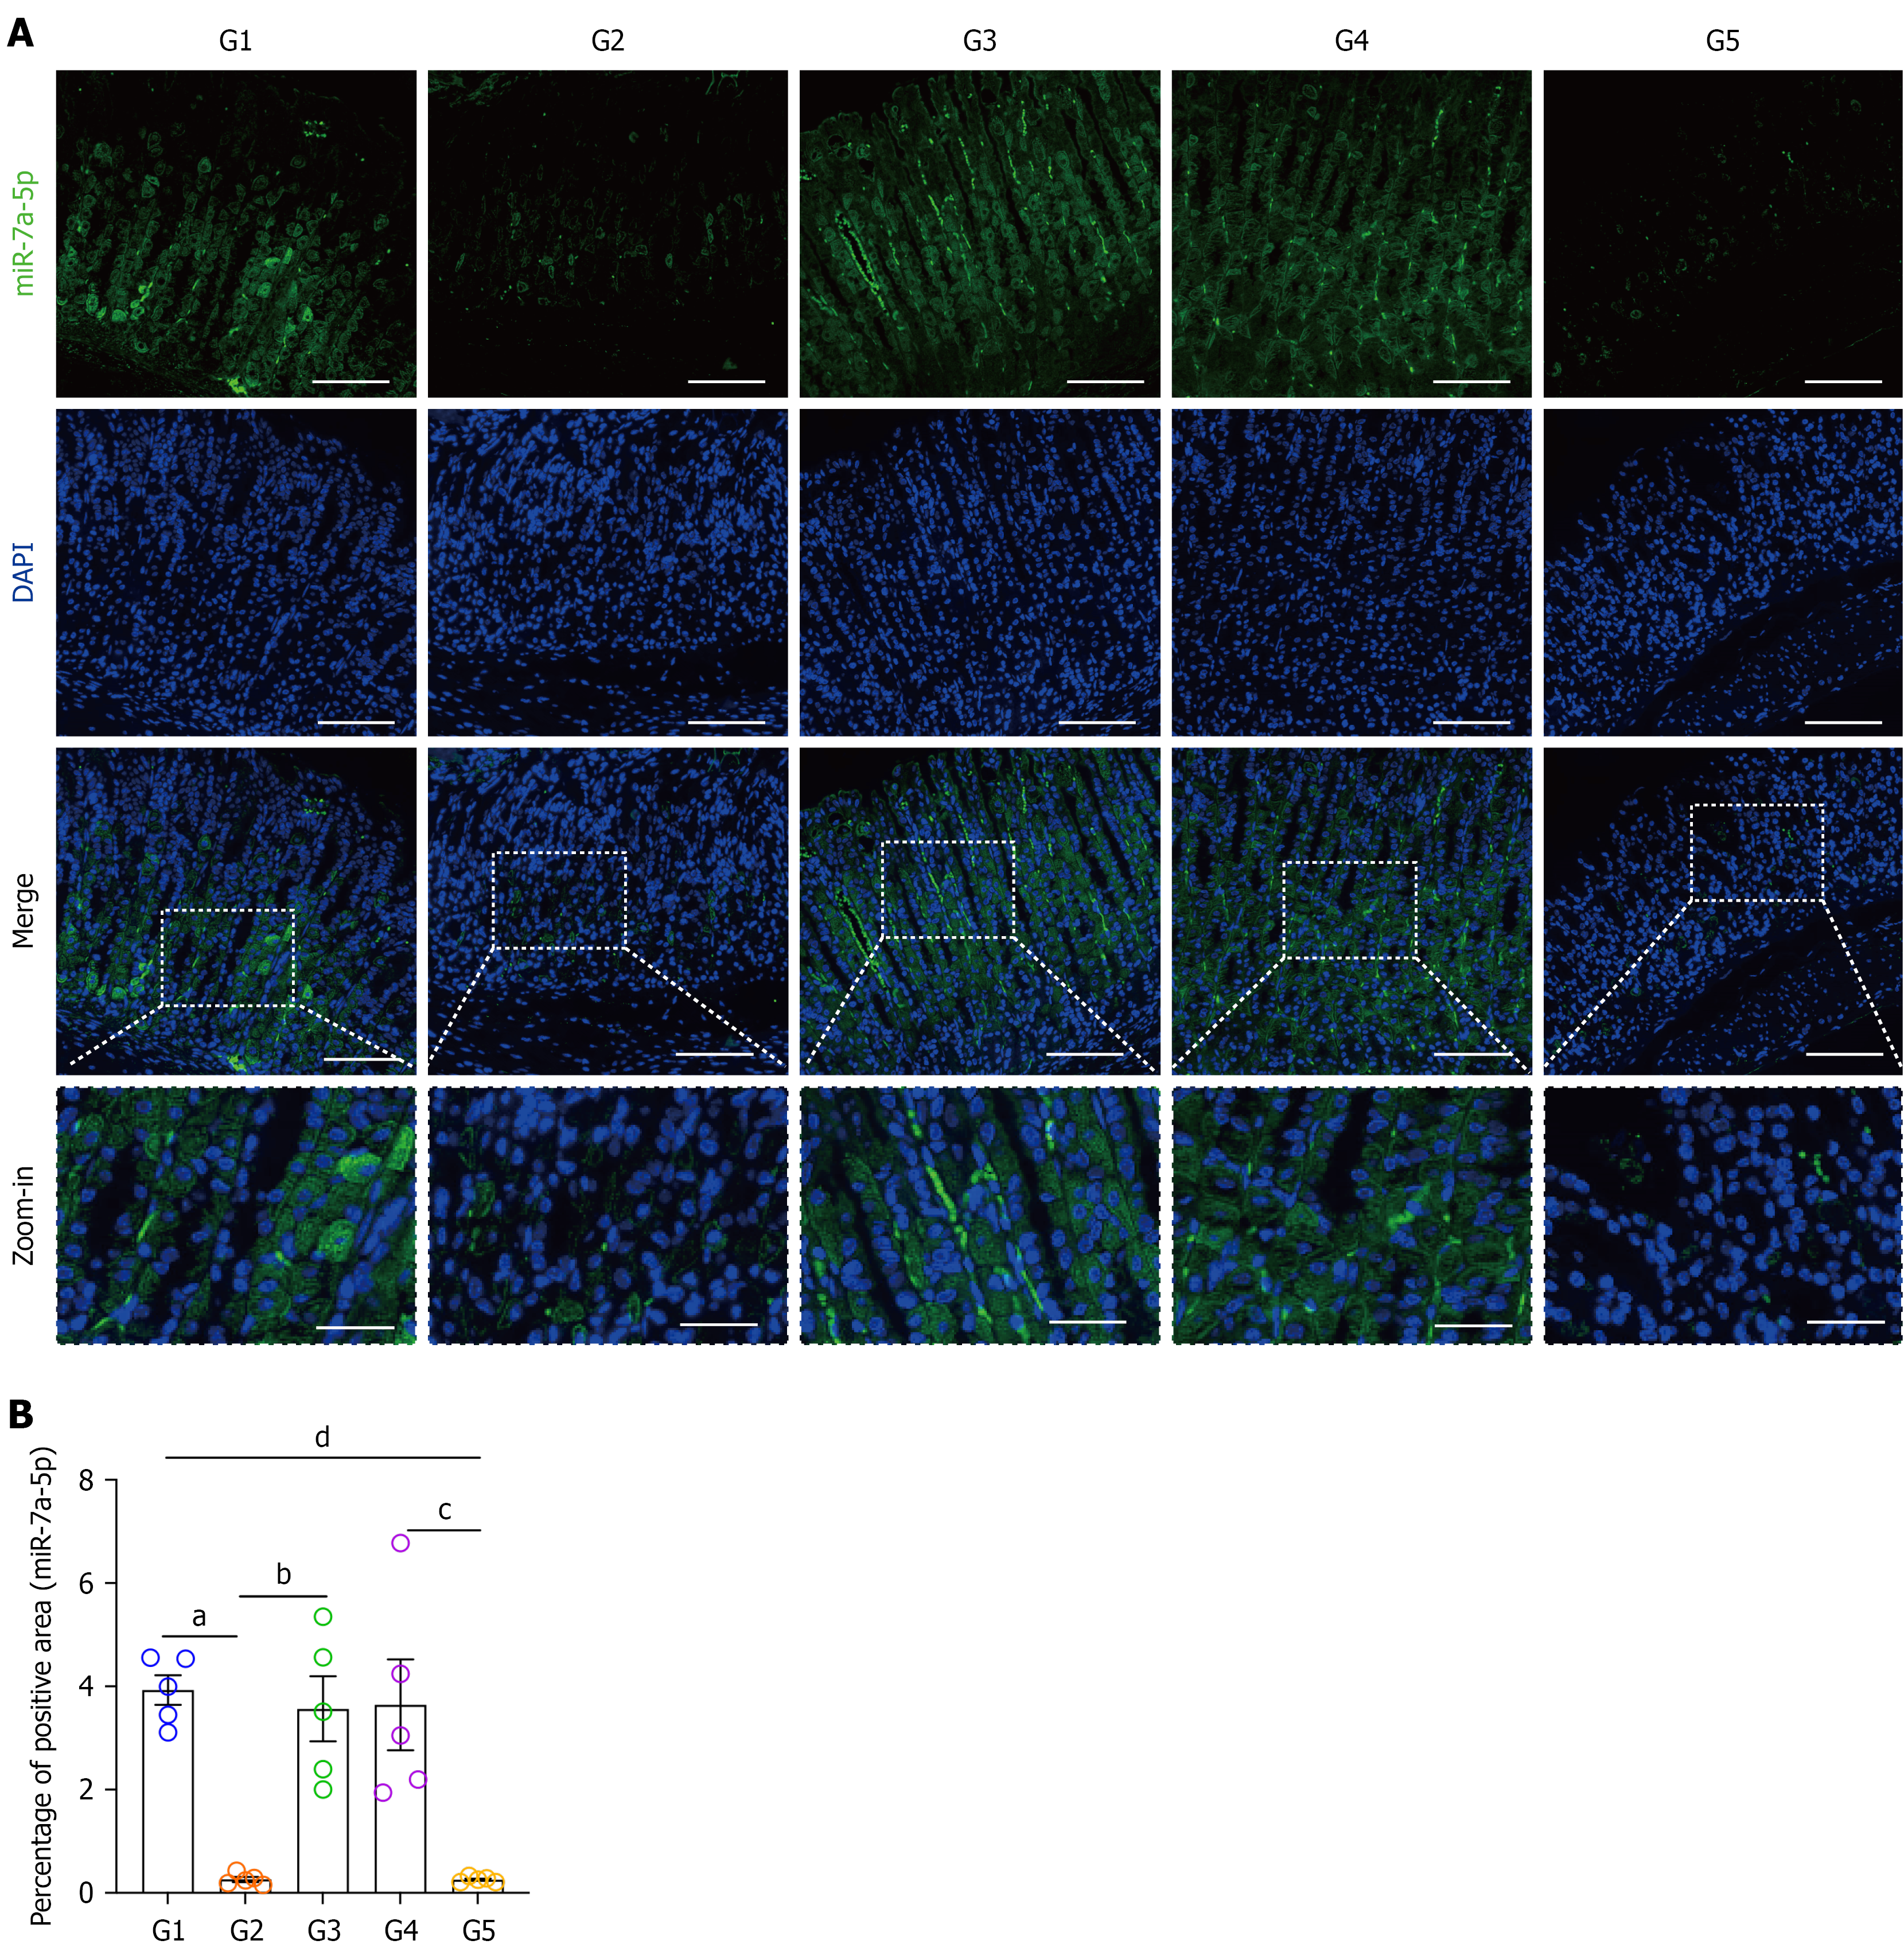
Figure 5 Yiwei Xiaoyu granules (YWXY) restore miR-7a-5p expression in gastric mucosa.
A: Representative fluorescence in situ hybridization (FISH) images showing miR-7a-5p expression in the gastric mucosa on day 30; B: Quantification of miR-7a-5p-positive area (% area). aP < 0.001 vs G2, bP < 0.01 vs G3, cP < 0.01 vs G5, dP < 0.001 vs G5. Scale bar = 100 µm. Data are shown as mean ± SD (n = 5/group).
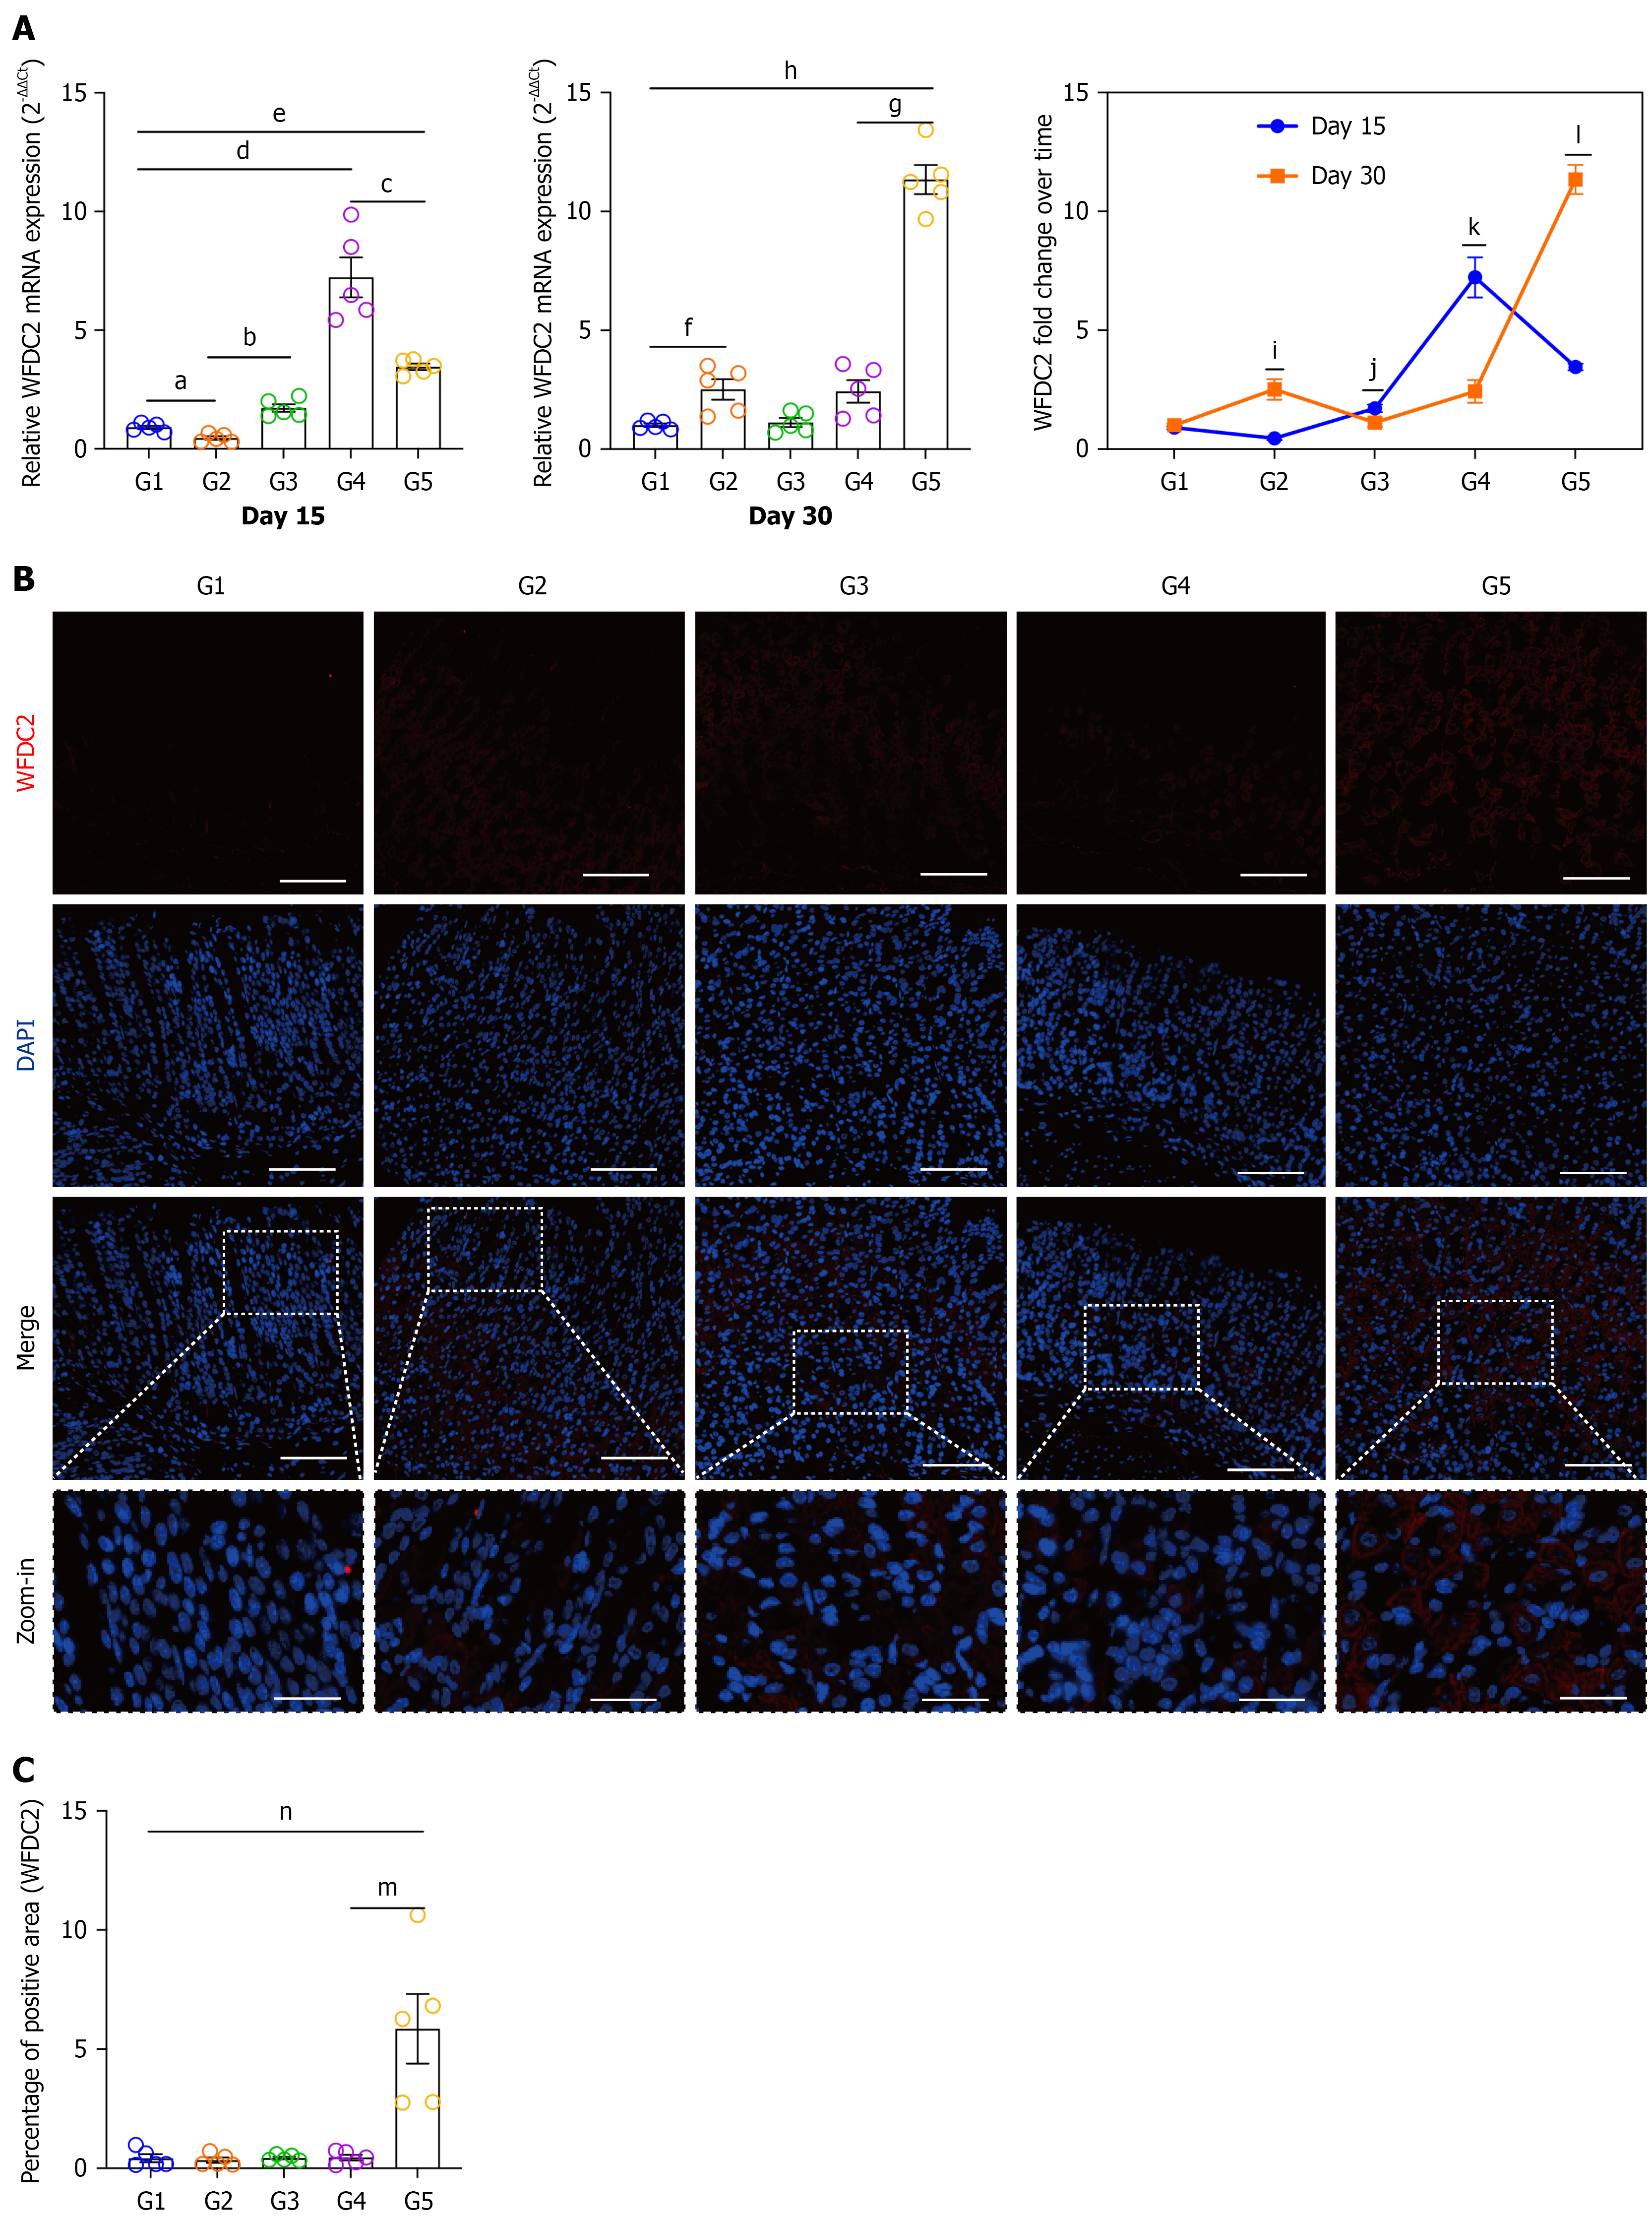
Figure 6 WFDC2 expression in gastric mucosa at days 15 and 30.
A: Relative WFDC2 mRNA expression levels at days 15 and 30 in different experimental groups. At day 15: aP < 0.01 vs G2, bP < 0.0001 vs G3, cP < 0.01 vs G5, dP < 0.0001 vs G4, eP < 0.0001 vs G5. At day 30: fP < 0.001 vs G2, gP < 0.0001 vs G5, hP < 0.0001 vs G5; B: Representative fluorescence in situ hybridization (FISH) images showing WFDC2 expression in gastric mucosa across experimental groups. Scale bar = 100 µm; C: Quantification of WFDC2-positive area (%Area) across experimental groups. mP < 0.001, nP < 0.001 vs G5. Data are presented as mean ± SD (n = 5 per group). Statistical analysis was performed using two-way analysis of variance followed by Tukey’s multiple-comparisons test.
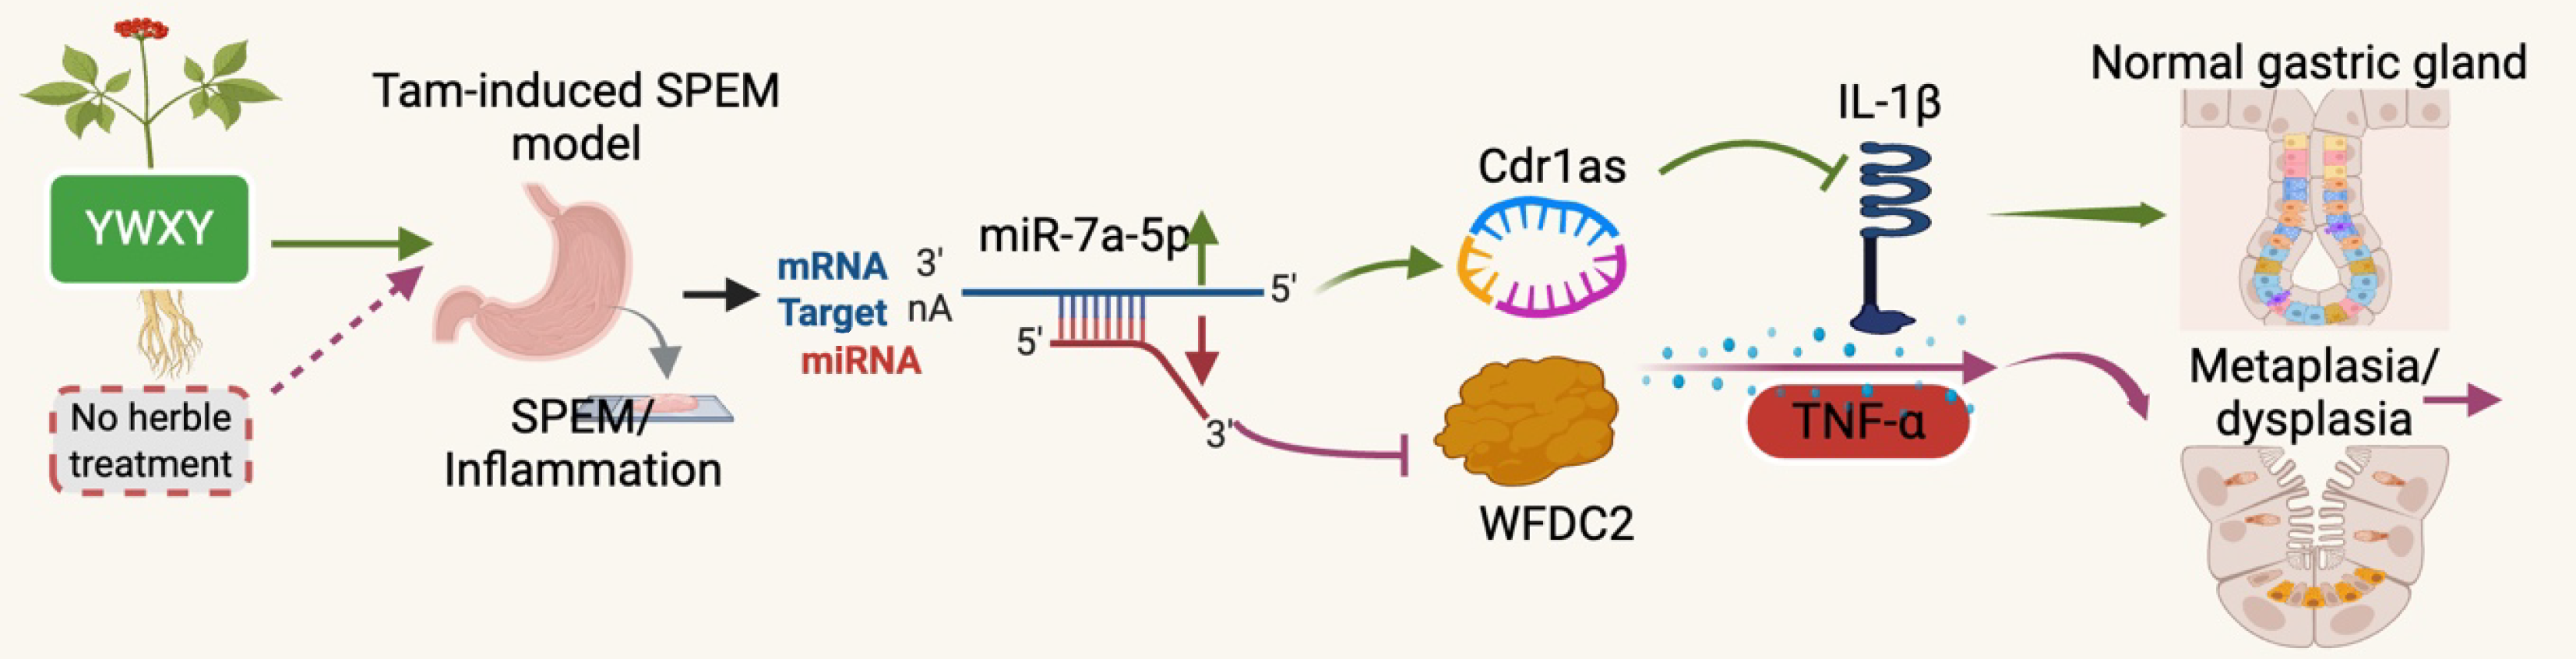
Figure 7 Proposed schematic model of Yiwei Xiaoyu granules-mediated modulation of the miR-7a-5p-Cdr1as-WFDC2-cytokine axis in gastric mucosa.
Arrow (↑): Activation or increase, blunt line (┤): Inhibition or decrease. YWXY: Yiwei Xiaoyu granules; Tam: Tamoxifen; SPEM: Spasmolytic polypeptide-expressing metaplasia. This figure was created by BioRender.com. https://BioRender.com/yezh7od.
- Citation: Chen WQ, Xu YY, Pan HL, Duan M, Ma H, Li YP, Zhang JW. Yiwei Xiaoyu granules mitigate spasmolytic polypeptide-expressing metaplasia-associated gastric mucosal damage by regulating WFDC2 and the miRNA-7/circRNA network. World J Gastrointest Oncol 2026; 18(7): 118787
- URL: https://www.wjgnet.com/1948-5204/full/v18/i7/118787.htm
- DOI: https://dx.doi.org/10.4251/wjgo.118787