
















Copyright: ©Author(s) 2026.
World J Gastrointest Oncol. Jul 15, 2026; 18(7): 117681
Published online Jul 15, 2026. doi: 10.4251/wjgo.117681
Published online Jul 15, 2026. doi: 10.4251/wjgo.117681
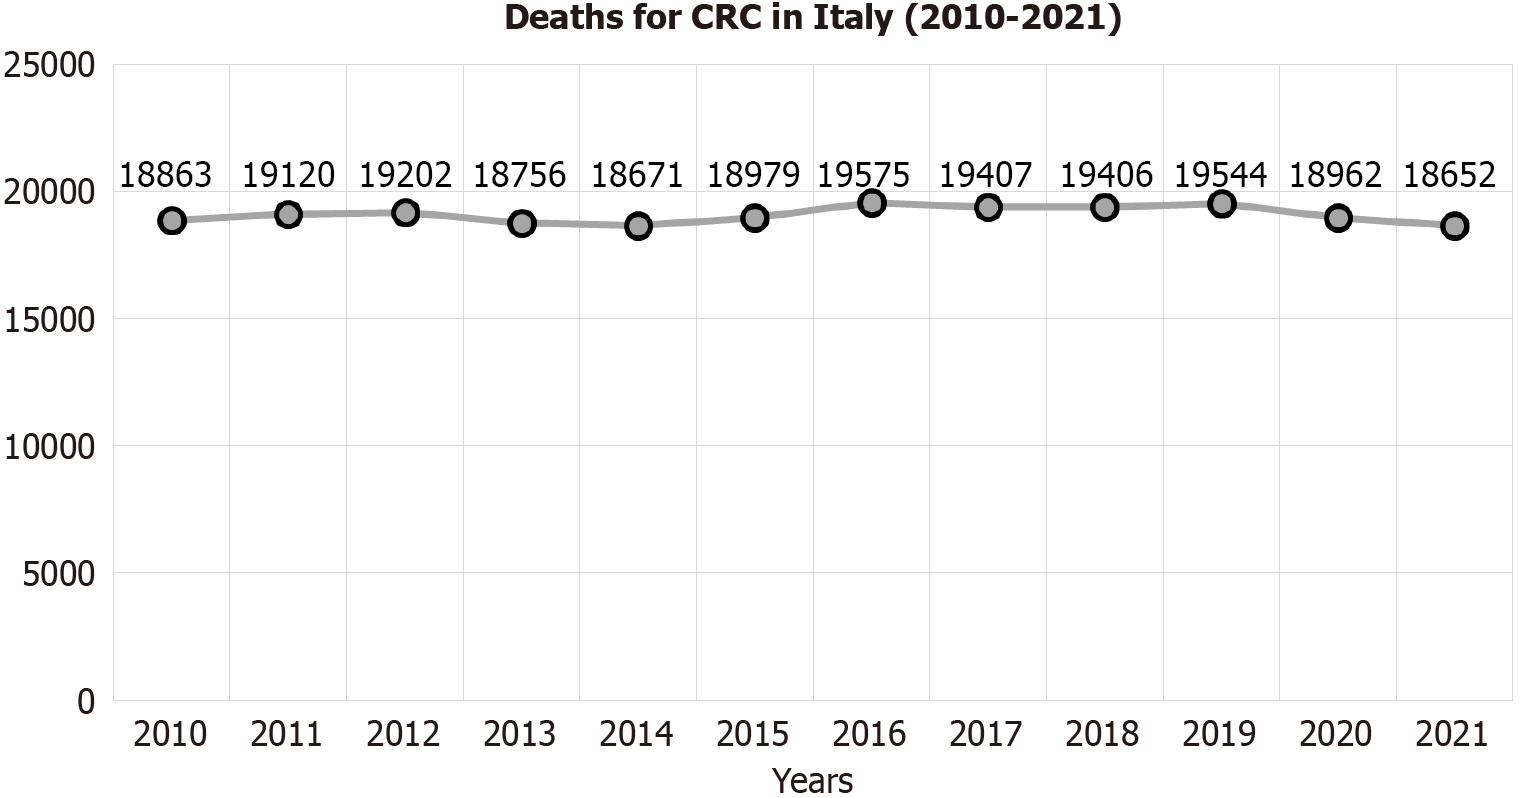
Figure 1 Trend of mortality for colorectal cancer in Italy from 2010 to 2021.
The behavior is mostly constant in the lapse of time observed. CRC: Colorectal cancer.
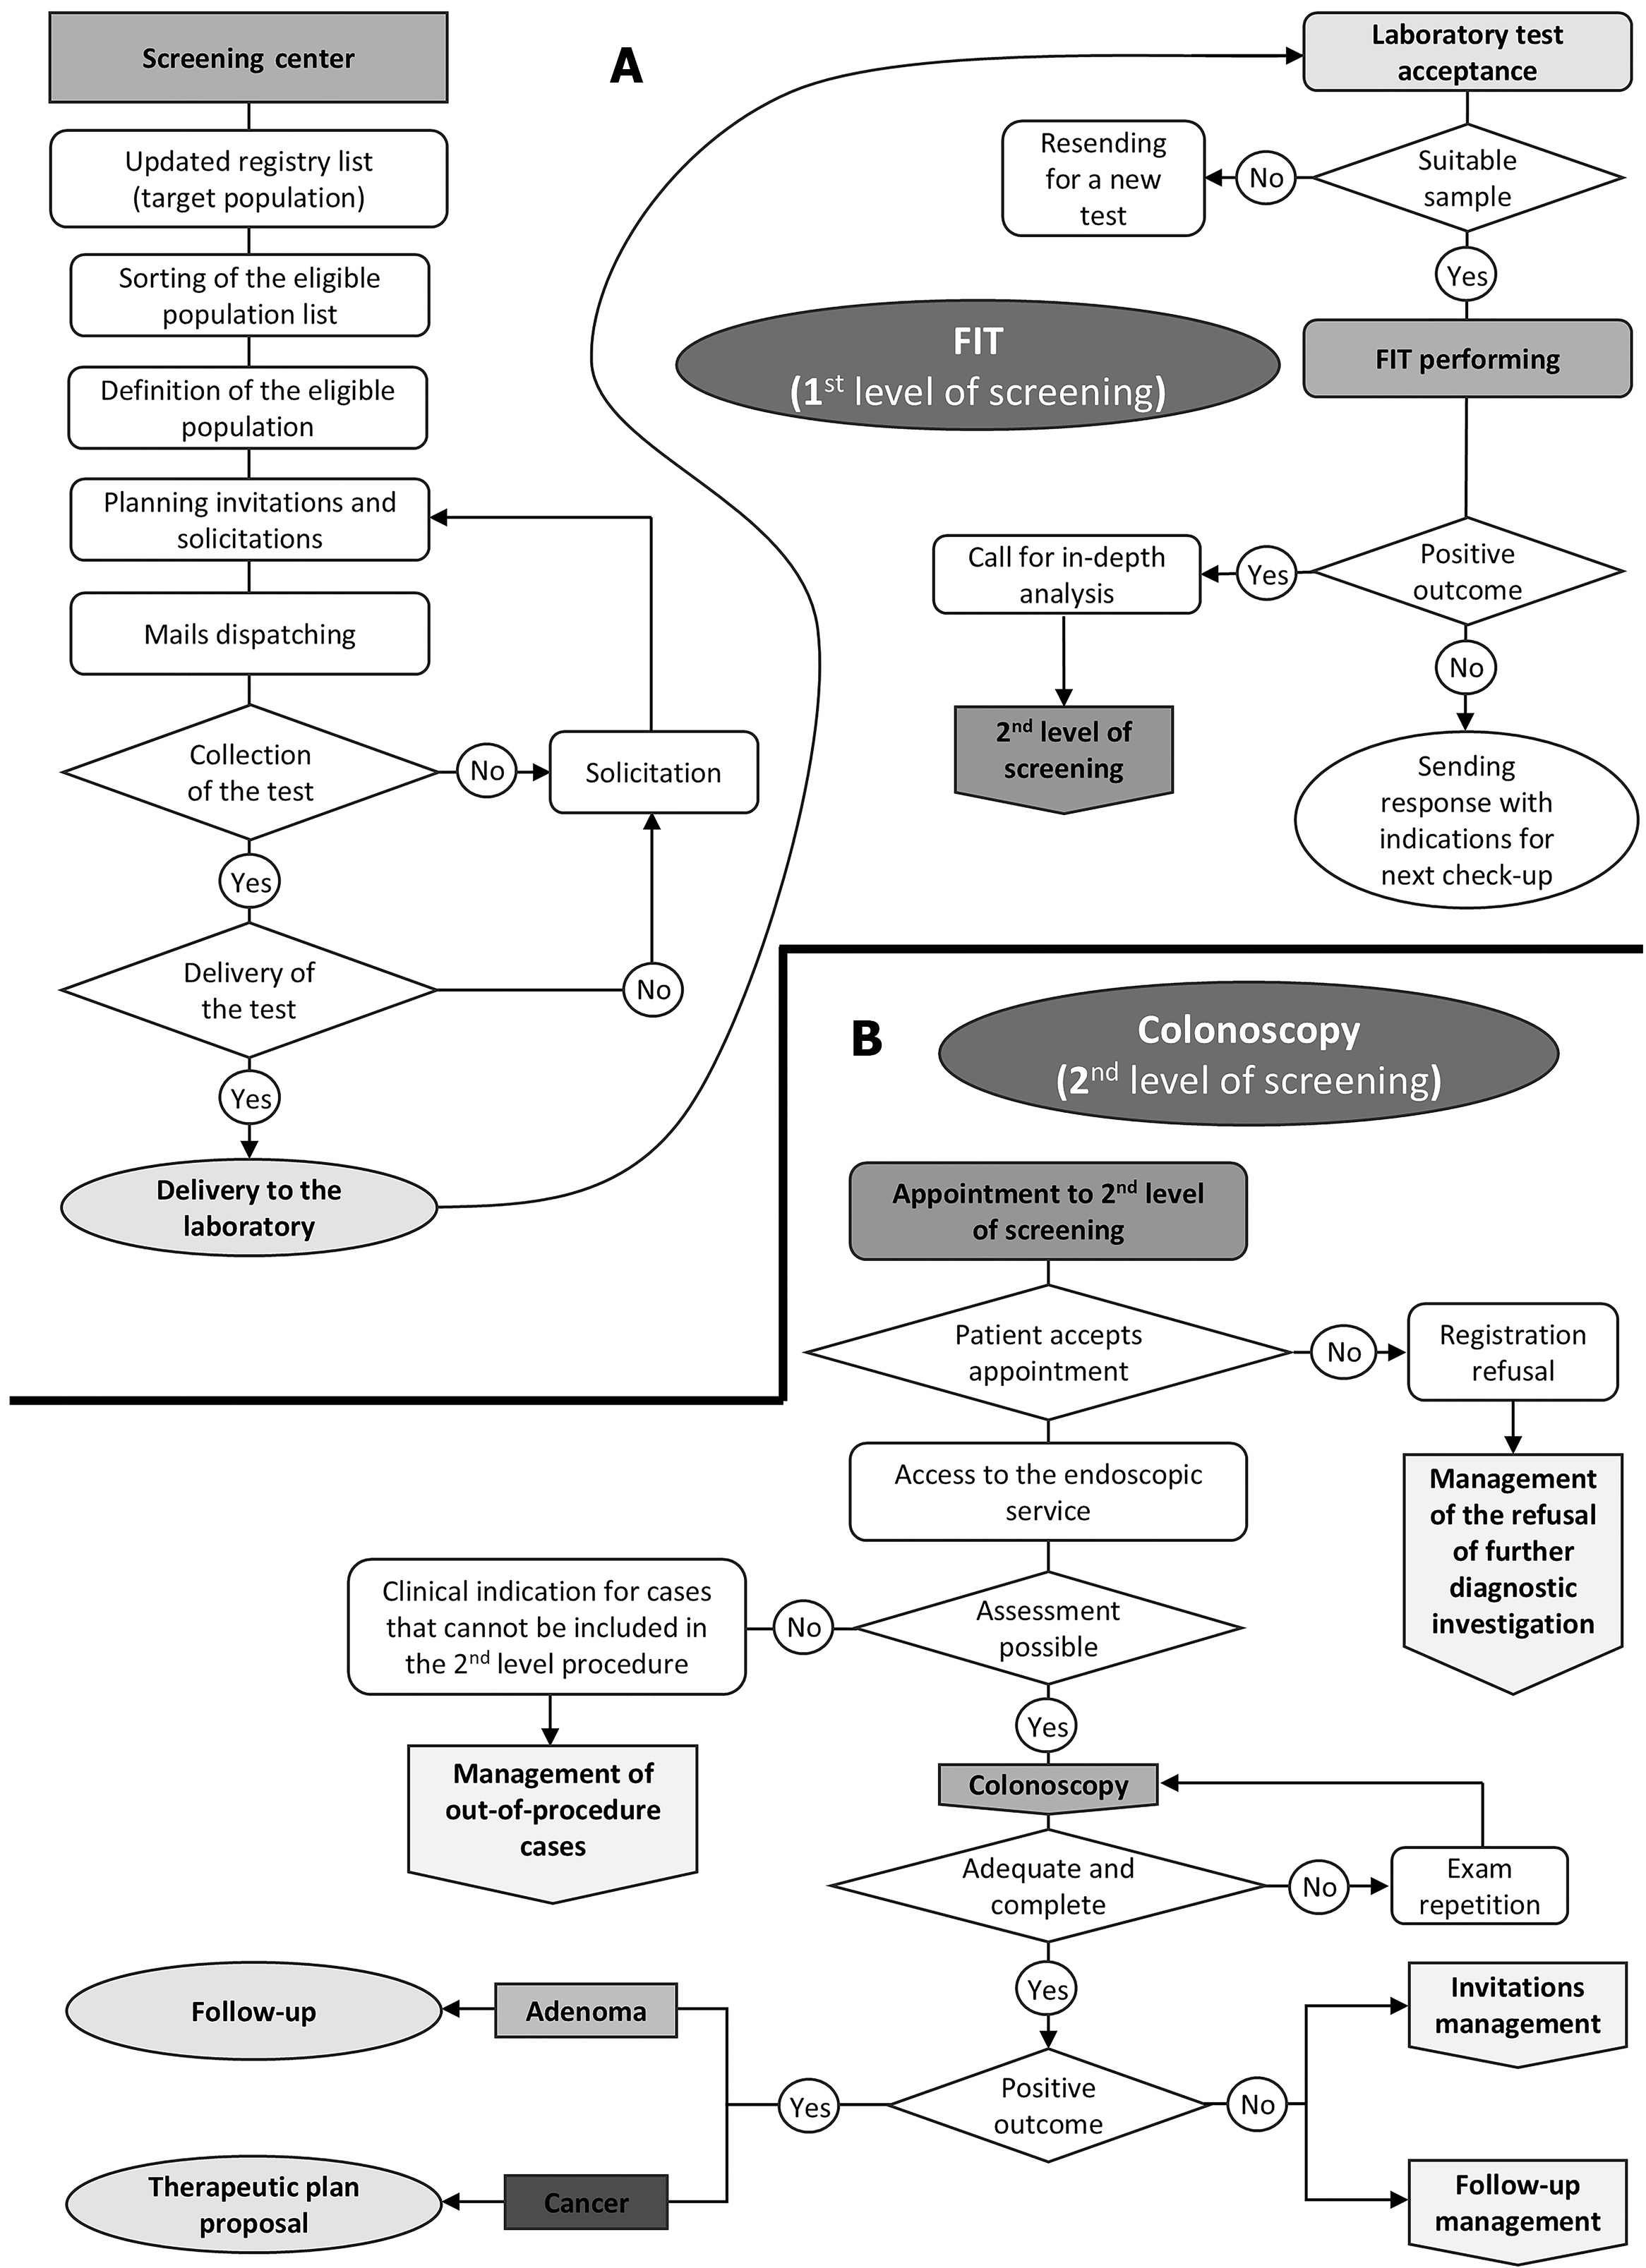
Figure 2 Flow chart schematizing the full course of the Italian national colorectal screening protocol.
A: Fecal immunochemical test (1st level) screening schematization; B: Colonoscopy (2nd level) screening schematization. Shades of gray are used to highlight critical phases in the screening chain. FIT: Fecal immunochemical test.
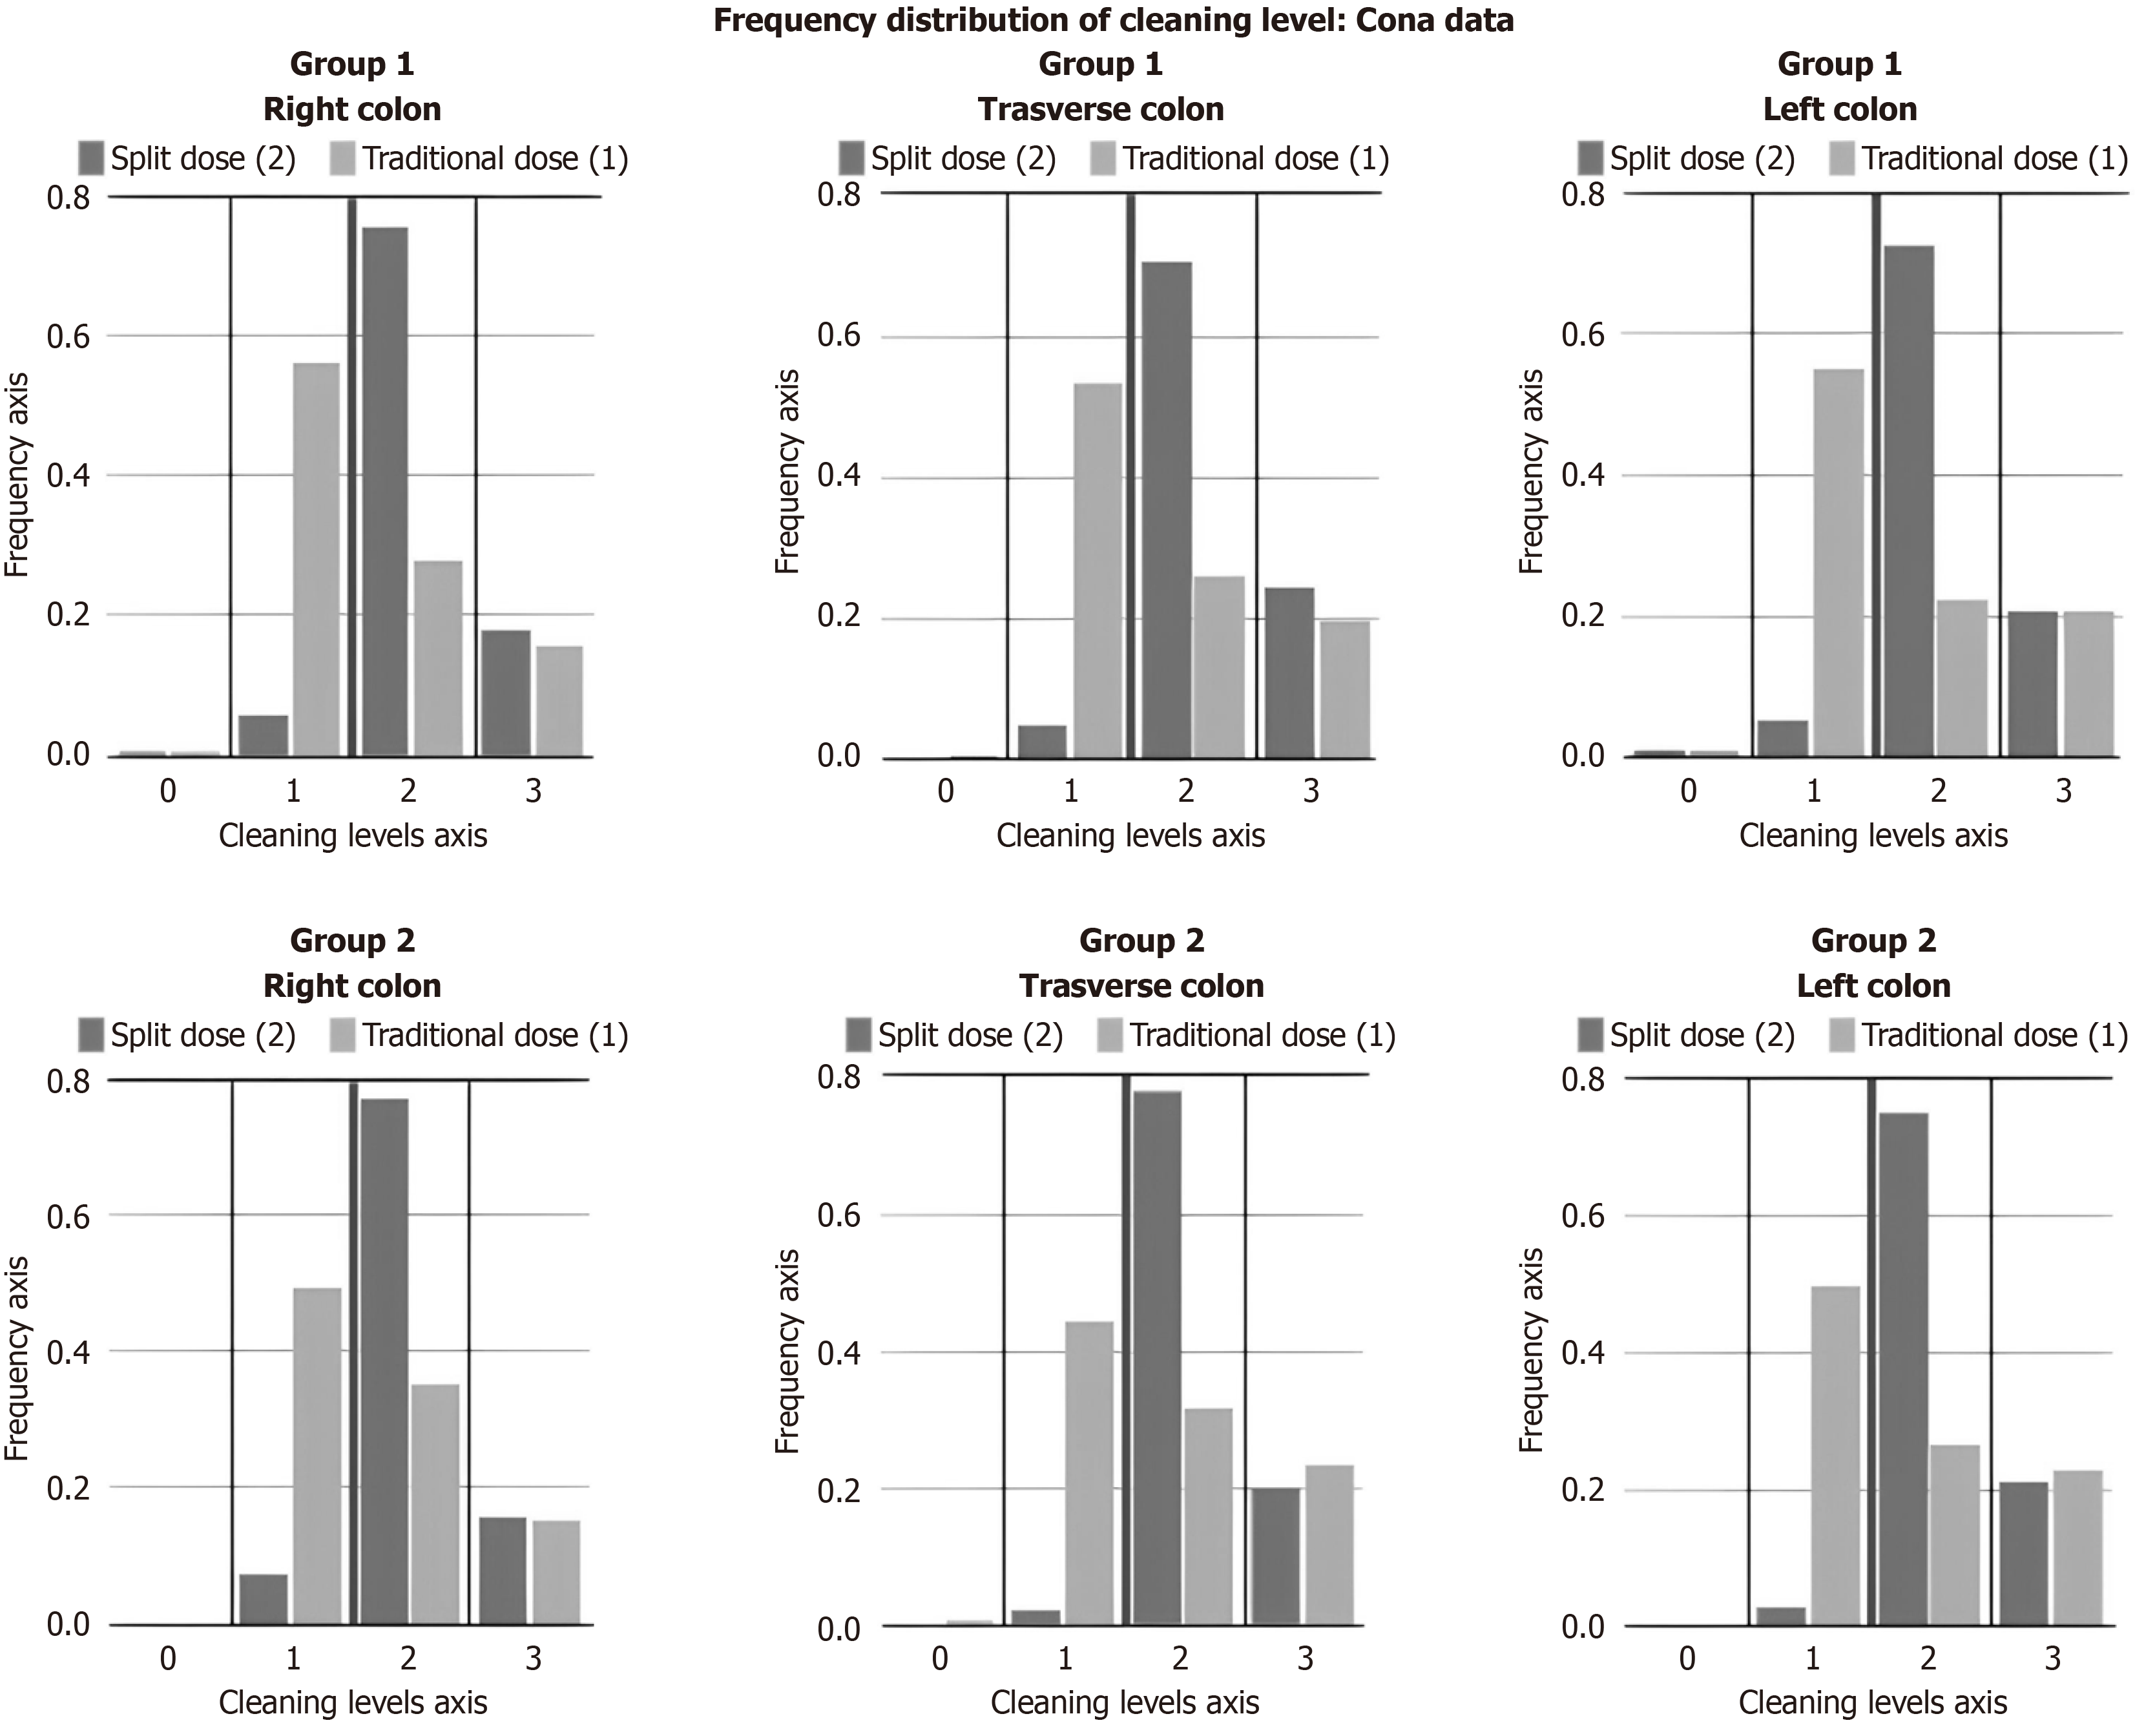
Figure 3 Cleaning levels frequency distribution on a population of 426 patients from Sant’Anna Hospital (Cona, Ferrara, Italy).
The vertical bold black lines divide good cleaning (colonoscopy possible) and bad cleaning (colonoscopy not viable).
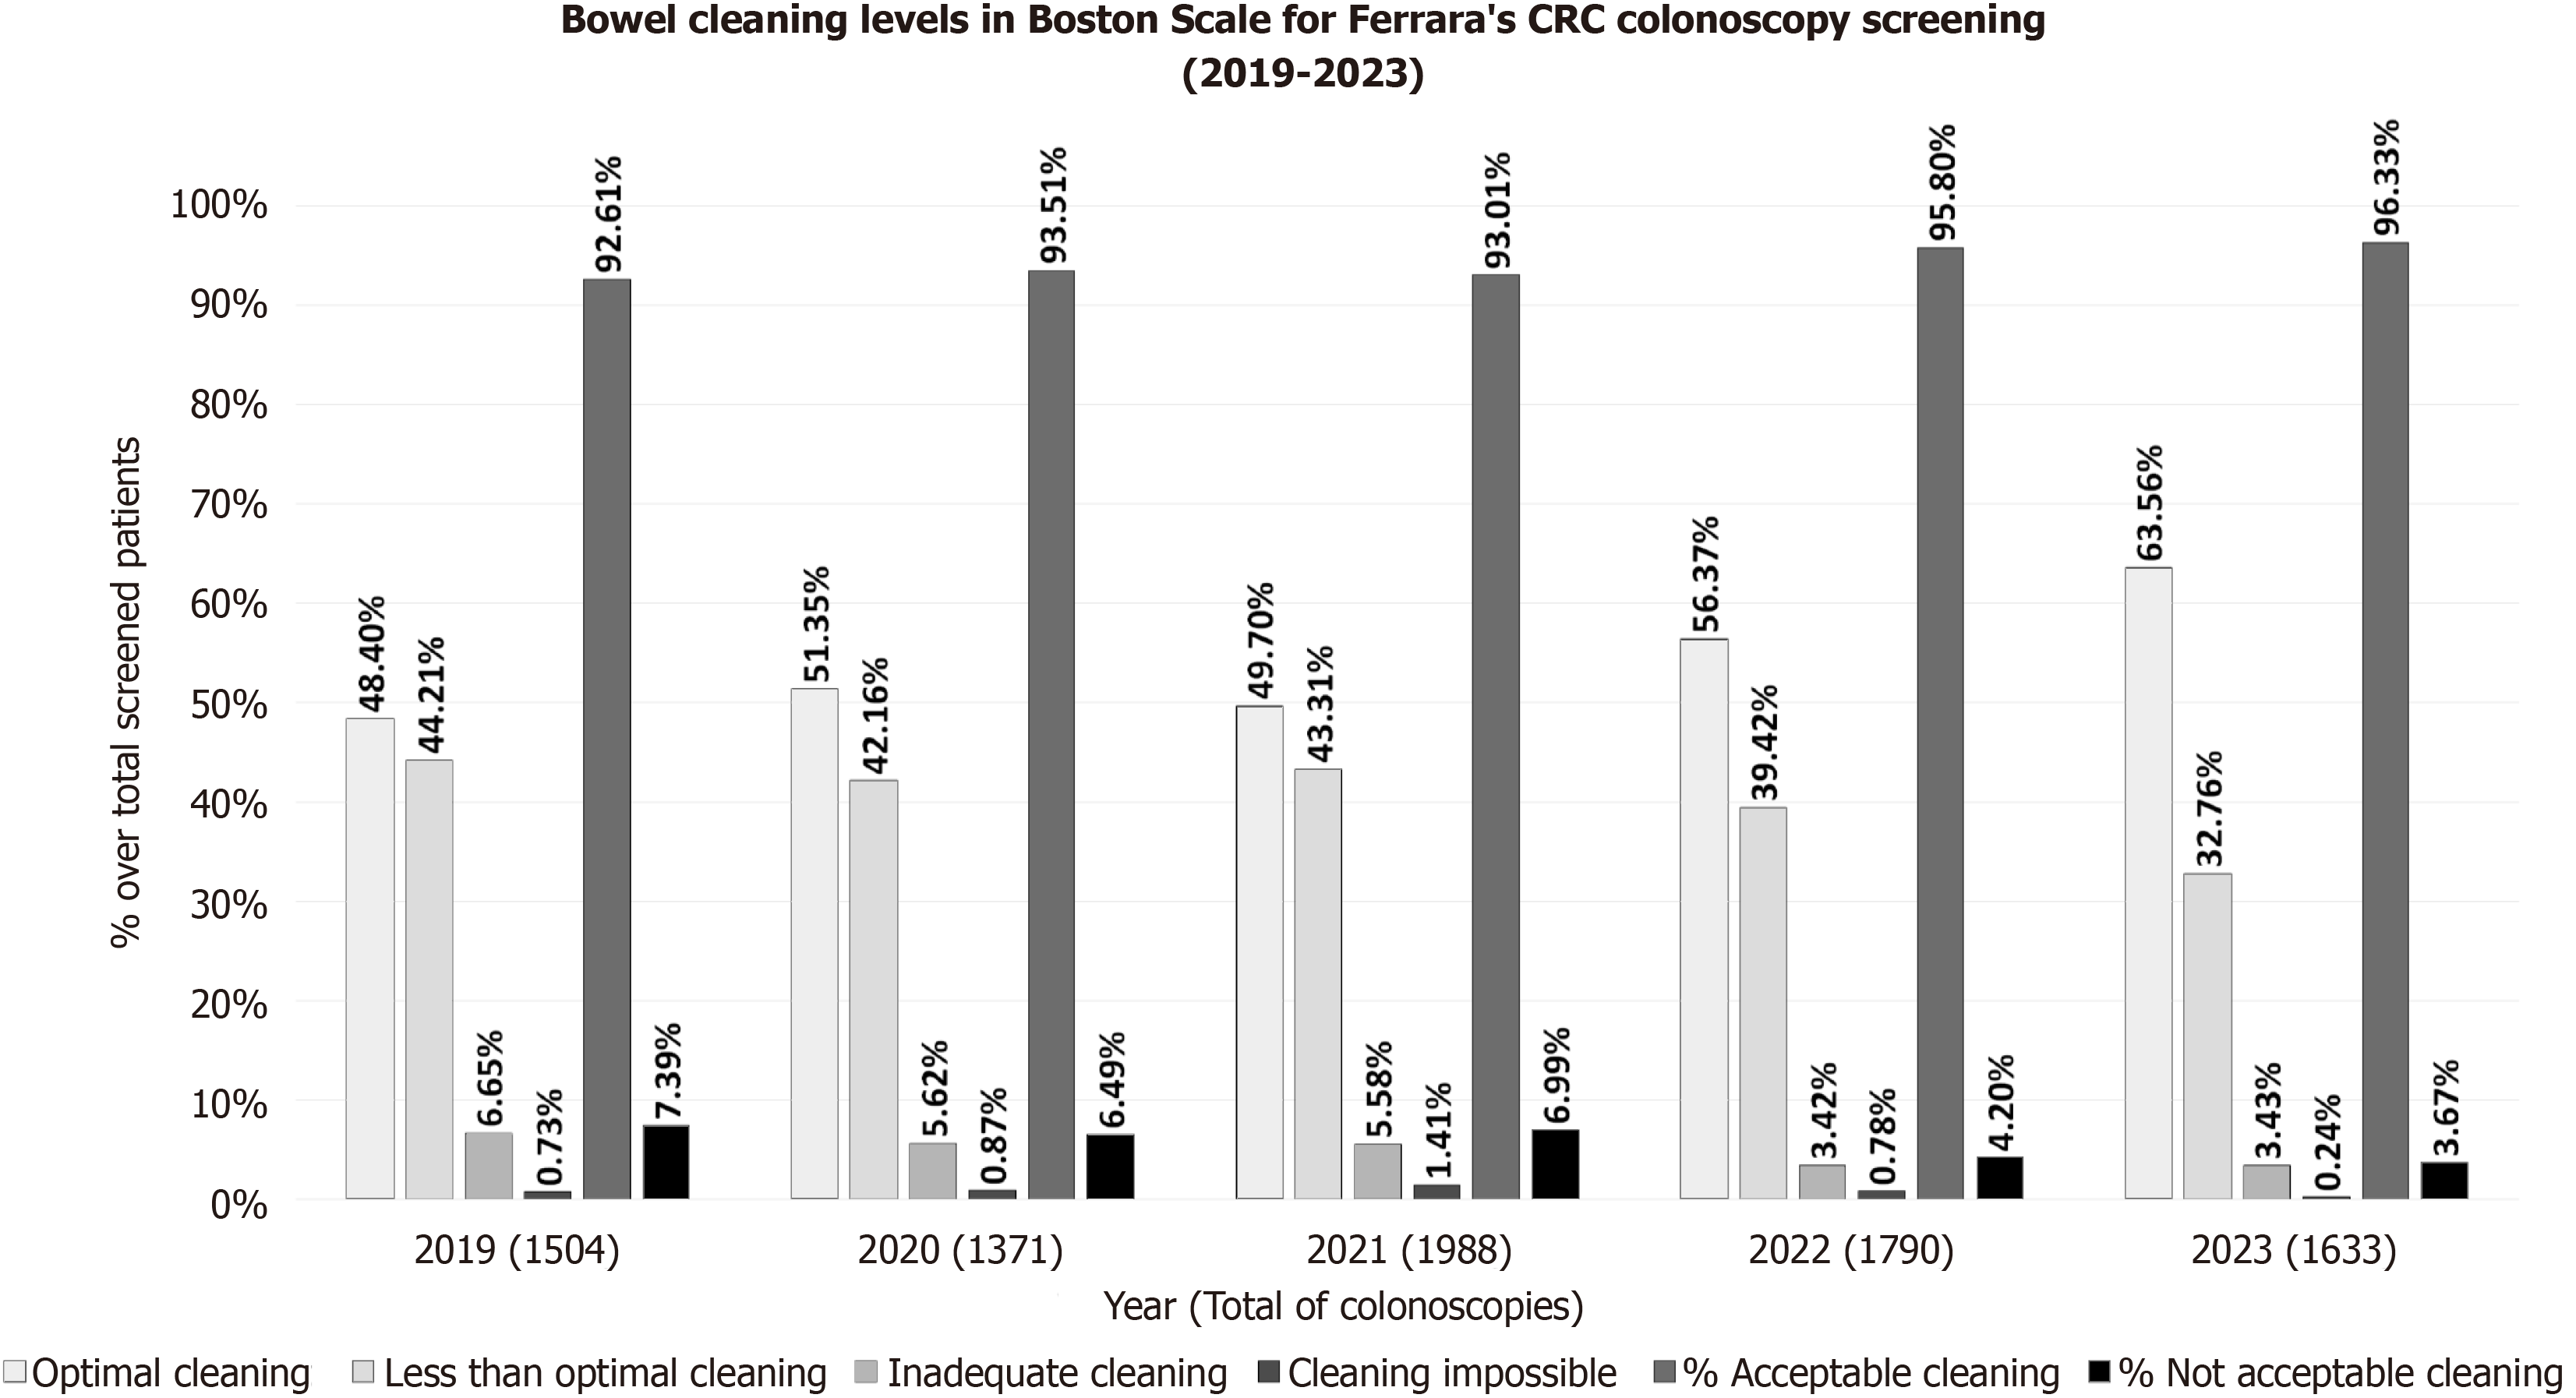
Figure 4 Colonoscopy cleaning levels for the province of Ferrara.
Number of patients treated are indicated between parentheses. CRC: Colorectal cancer.
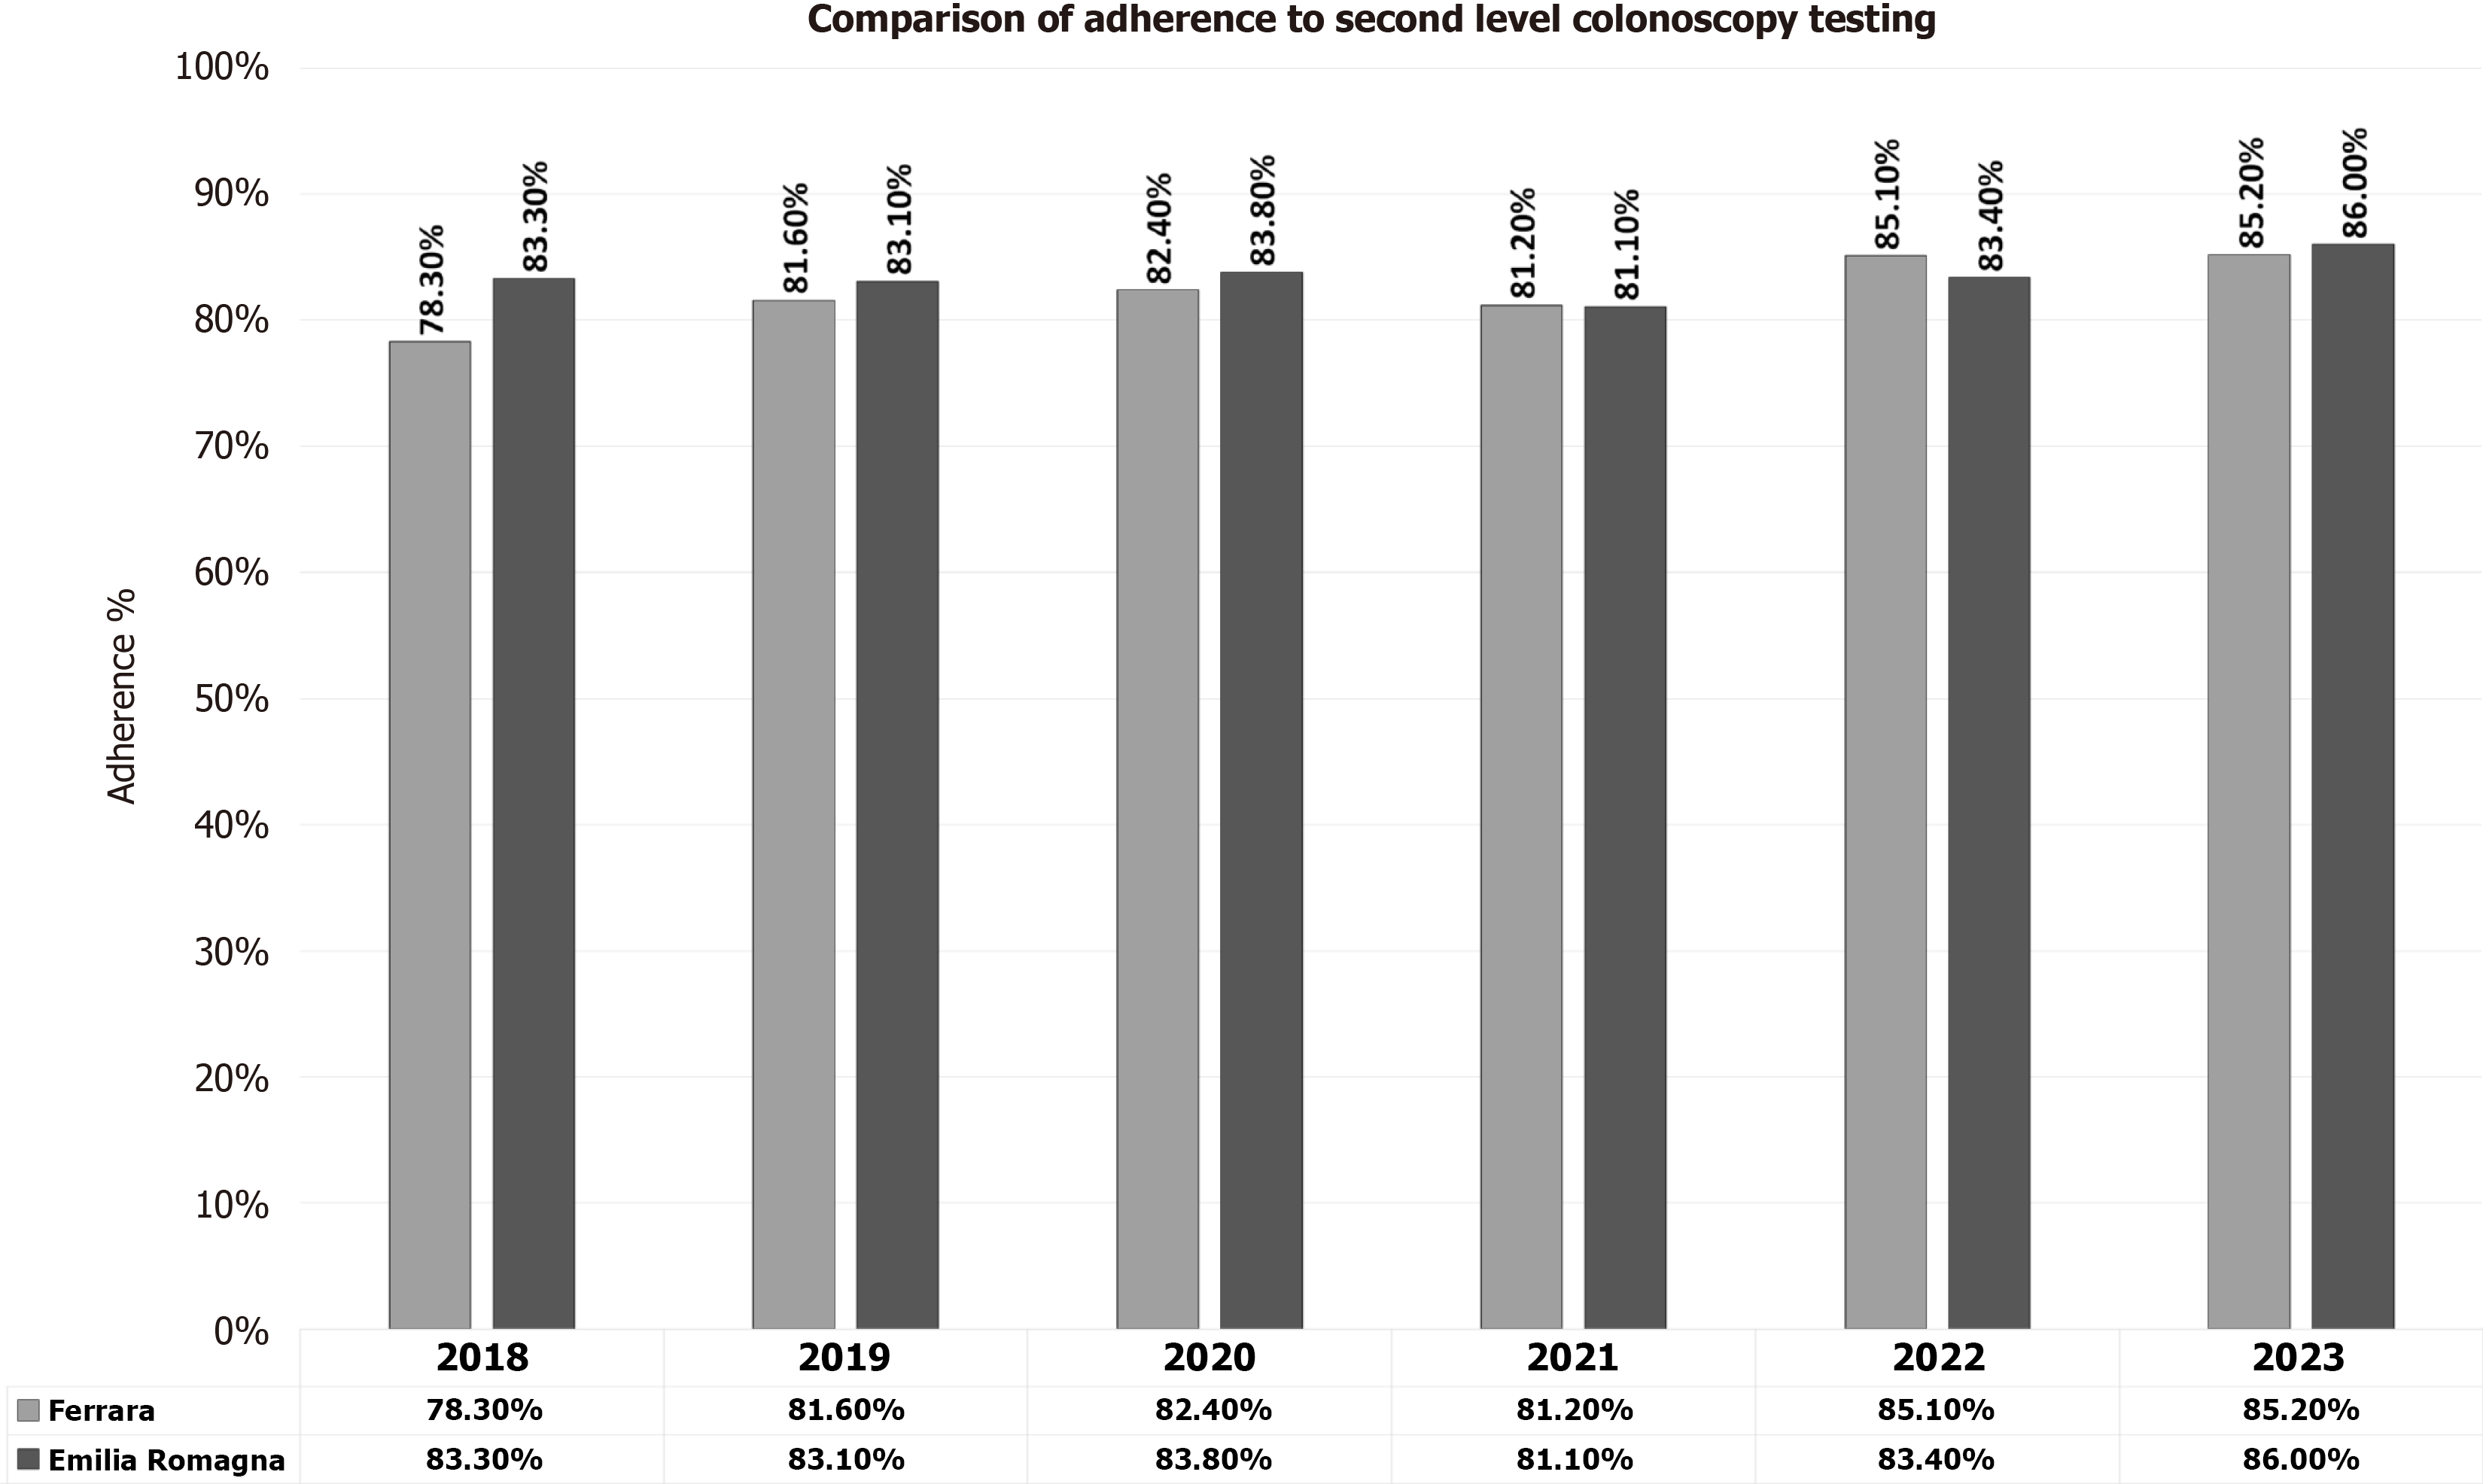
Figure 5 Colonoscopy adherence data (2nd level testing), comparison for the province of Ferrara and Emilia Romagna region.
An increasing trend has been verified along the years of observation.
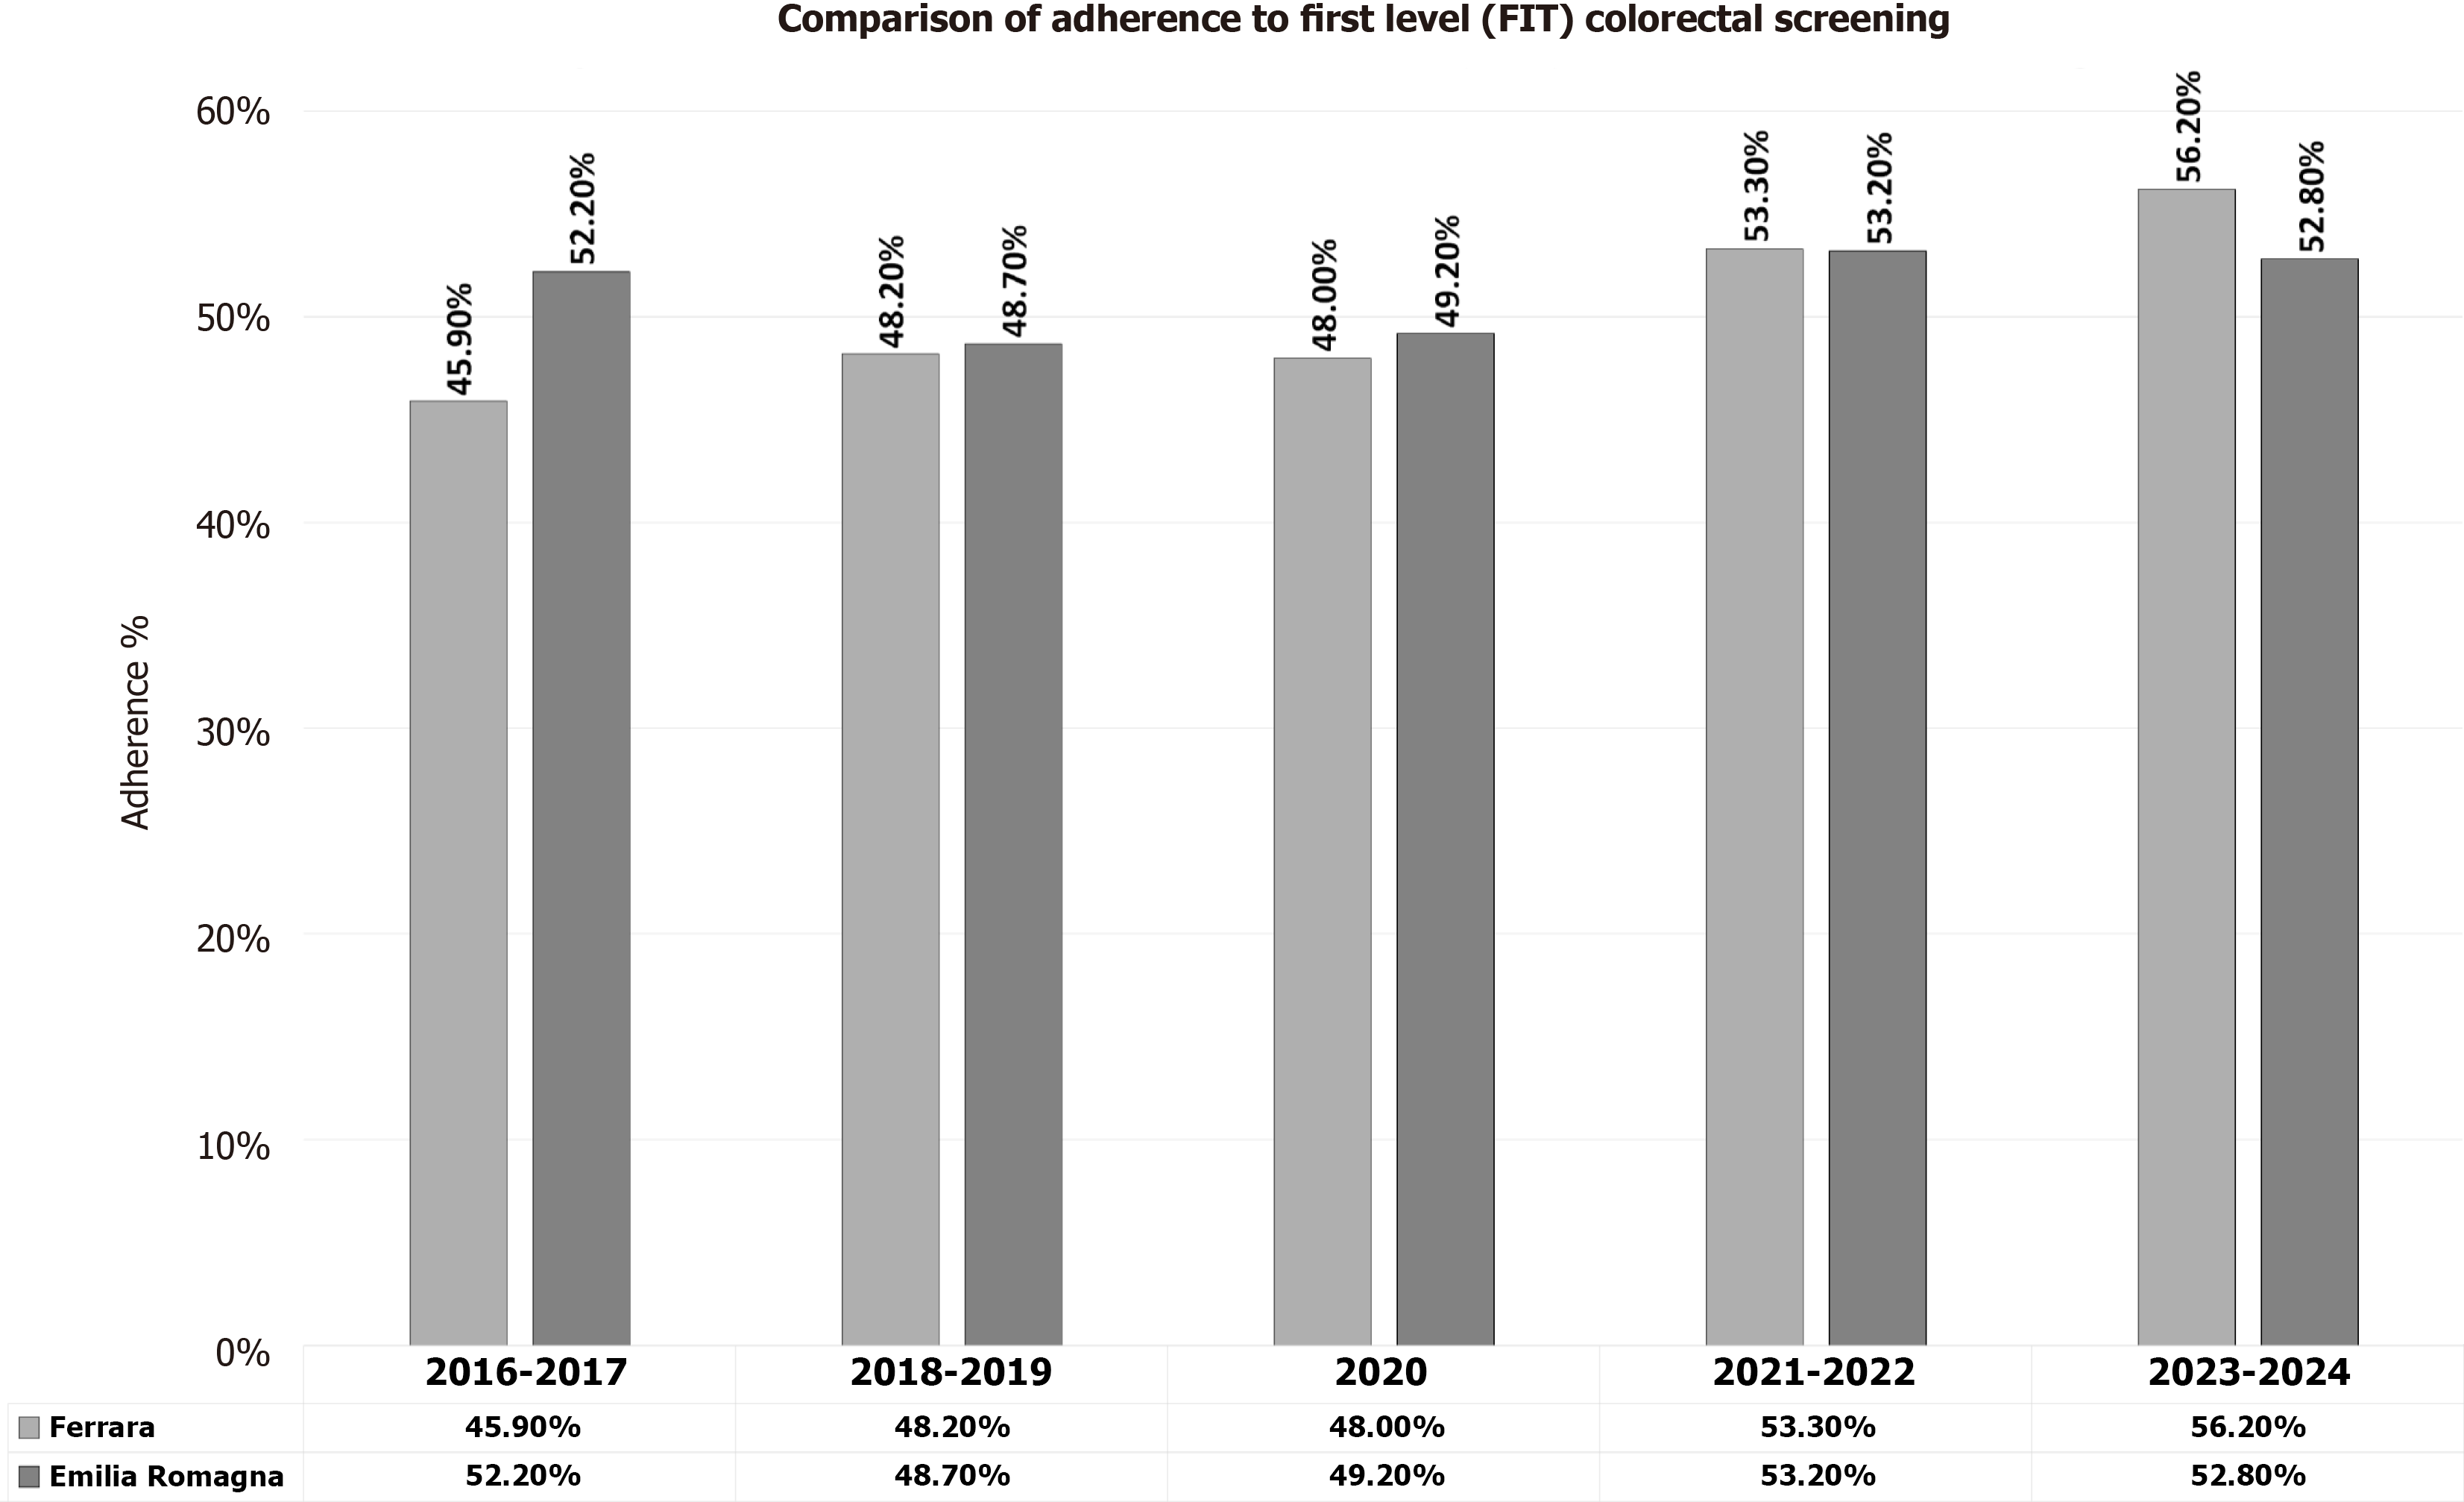
Figure 6 Data of fecal immunochemical test adherence (1st level testing), comparison for the province of Ferrara and Emilia Romagna region.
Adherence to fecal immunochemical test for Ferrara’s province colorectal cancer screening. An increasing trend has been verified along the years of observation. FIT: Fecal immunochemical test.
- Citation: Palmonari C, Landini N, Zanforlin C, Borghesi M, Cifalà V, Gregorio C, Pezzoli A, Rreshketa A, Chiericati C. Advantages of low dose polyethylene glycol + ascorbate split-dose colonoscopy preparation for colorectal screening. World J Gastrointest Oncol 2026; 18(7): 117681
- URL: https://www.wjgnet.com/1948-5204/full/v18/i7/117681.htm
- DOI: https://dx.doi.org/10.4251/wjgo.117681