Copyright
©The Author(s) 2025.
World J Gastrointest Oncol. Sep 15, 2025; 17(9): 108672
Published online Sep 15, 2025. doi: 10.4251/wjgo.v17.i9.108672
Published online Sep 15, 2025. doi: 10.4251/wjgo.v17.i9.108672
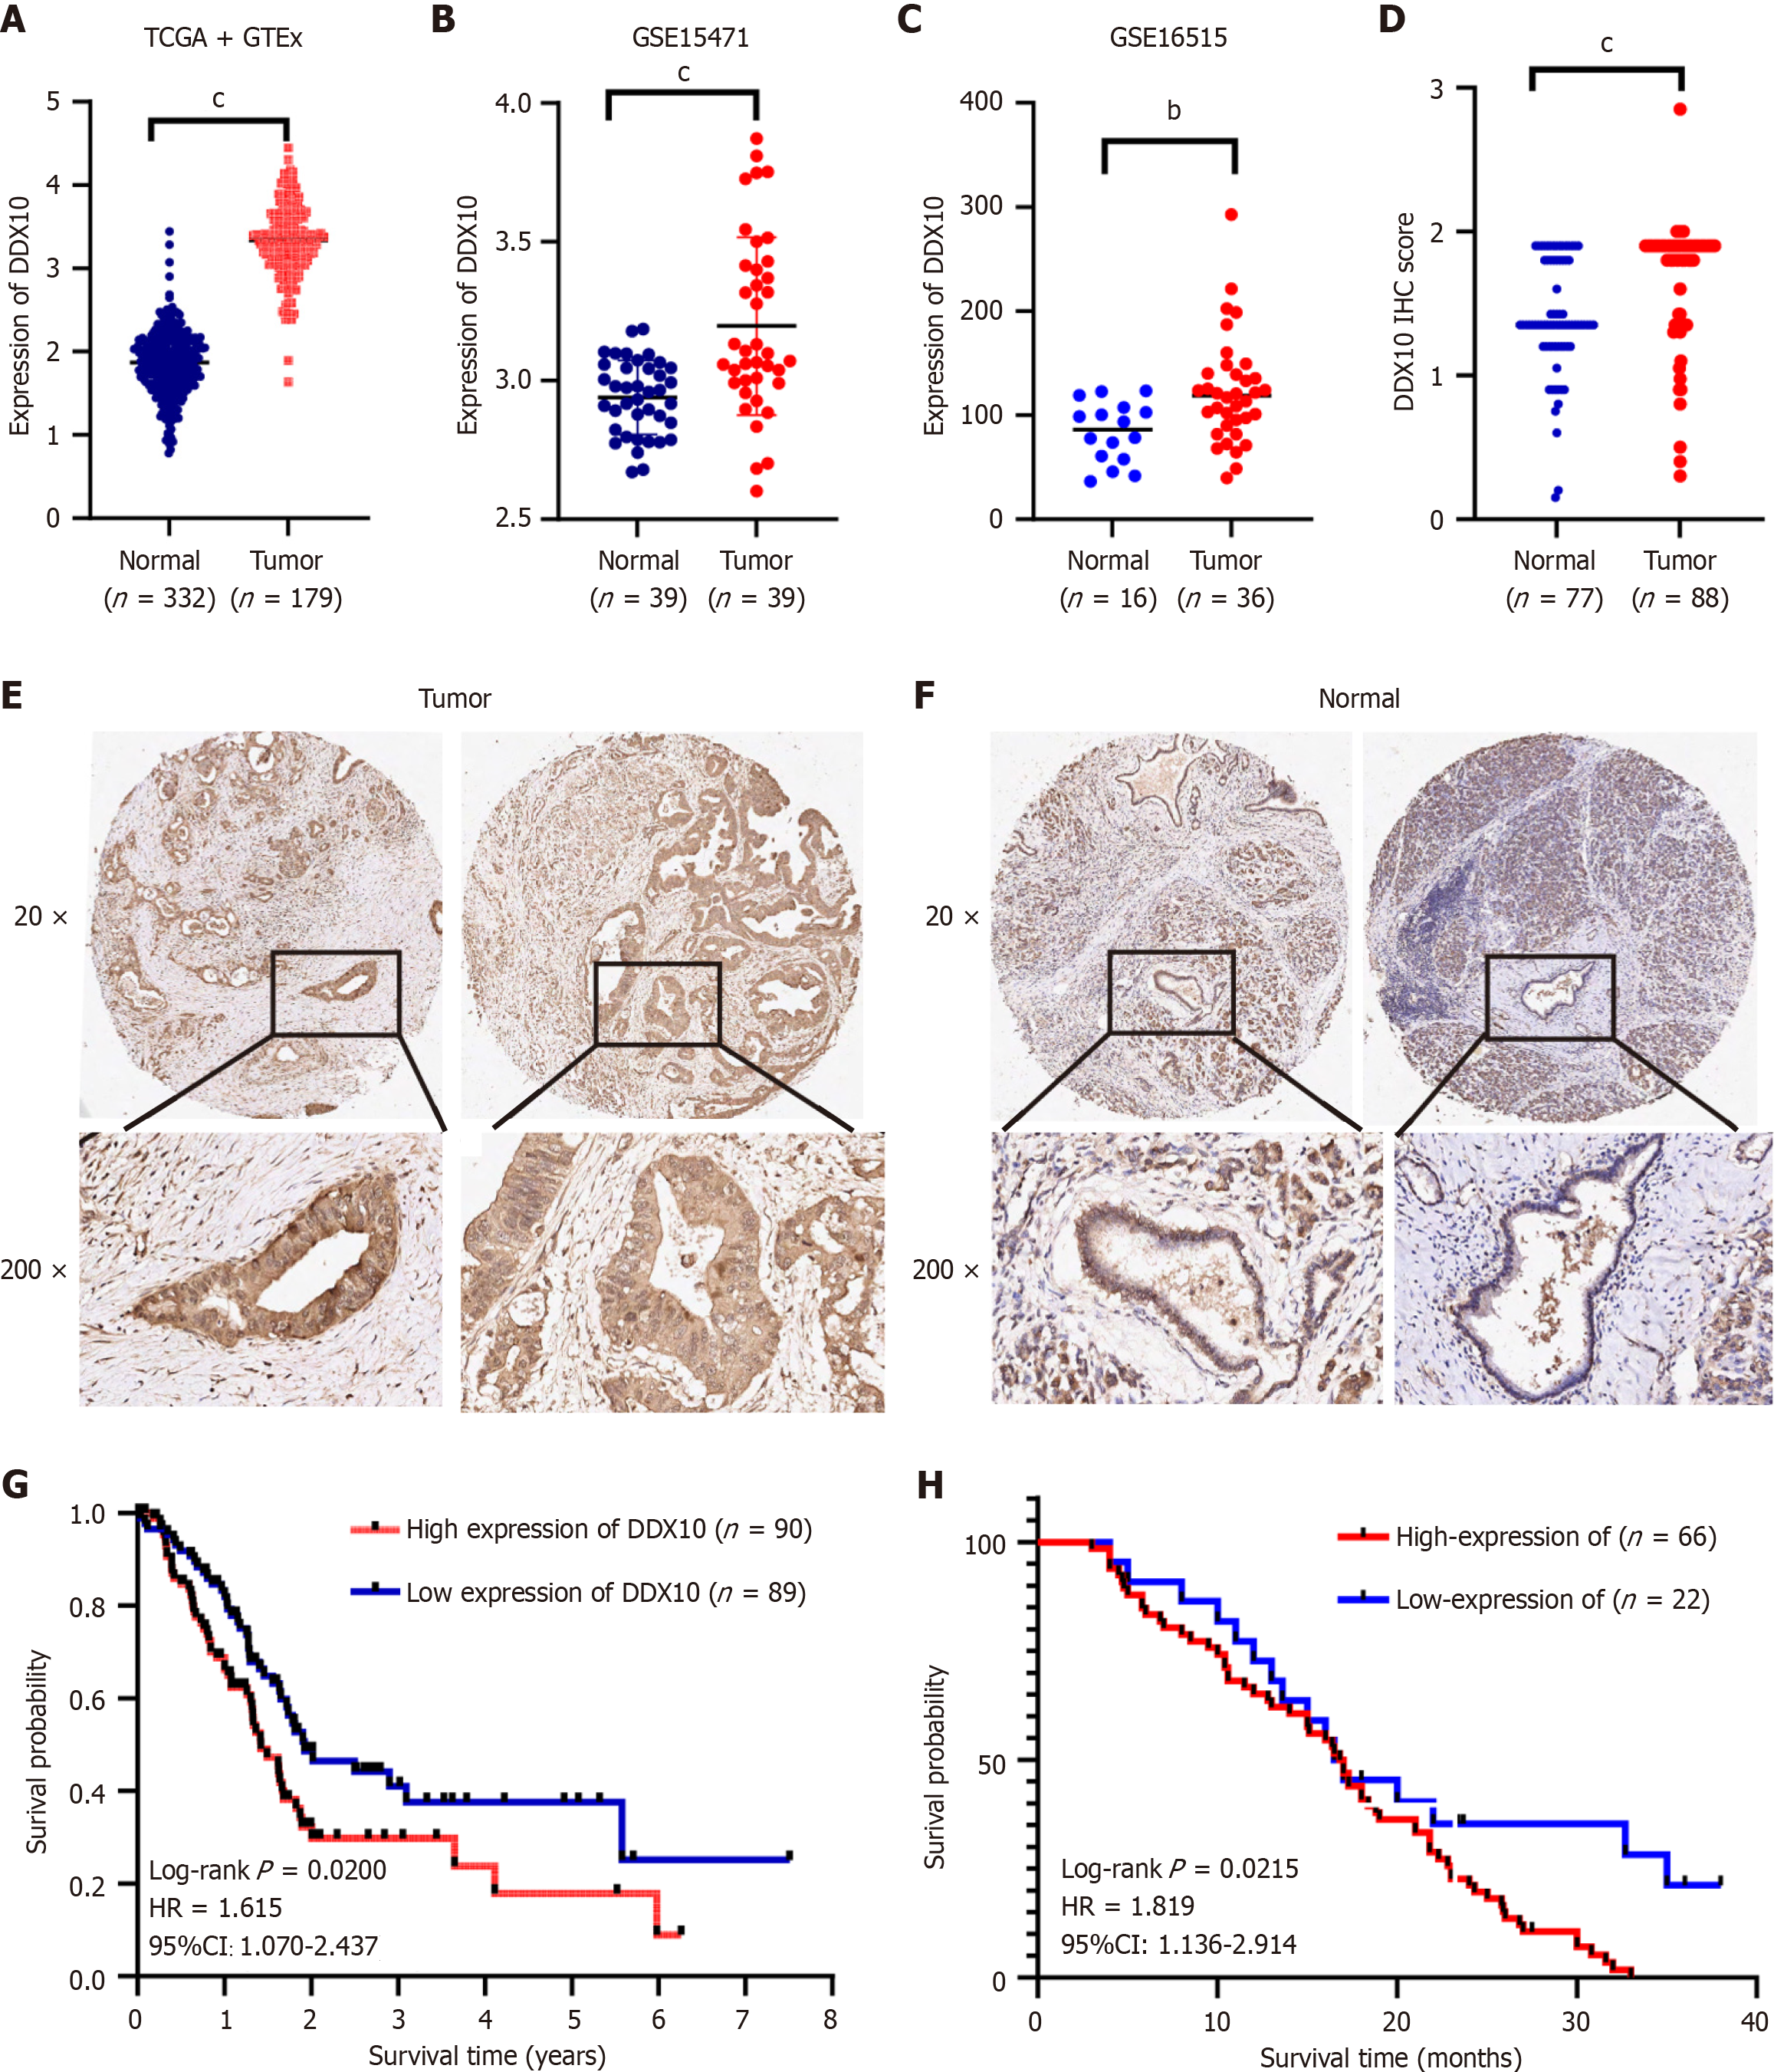
Figure 1 Expression of DEAD/H-box RNA helicase 10 and prognosis in pancreatic cancer tissues.
A-C: Differential expression levels of DEAD/H-box RNA helicase 10 (DDX10) in pancreatic cancer; D-F: Expression of DDX10 in pancreatic cancer tissues and peritumor tissues as detected by IHC; G and H: High expression of DDX10 correlates with a poor prognosis in pancreatic cancer patients. bP < 0.01; cP < 0.001; DDX10: DEAD/H-box RNA helicase 10; IHC: Immunohistochemistry.
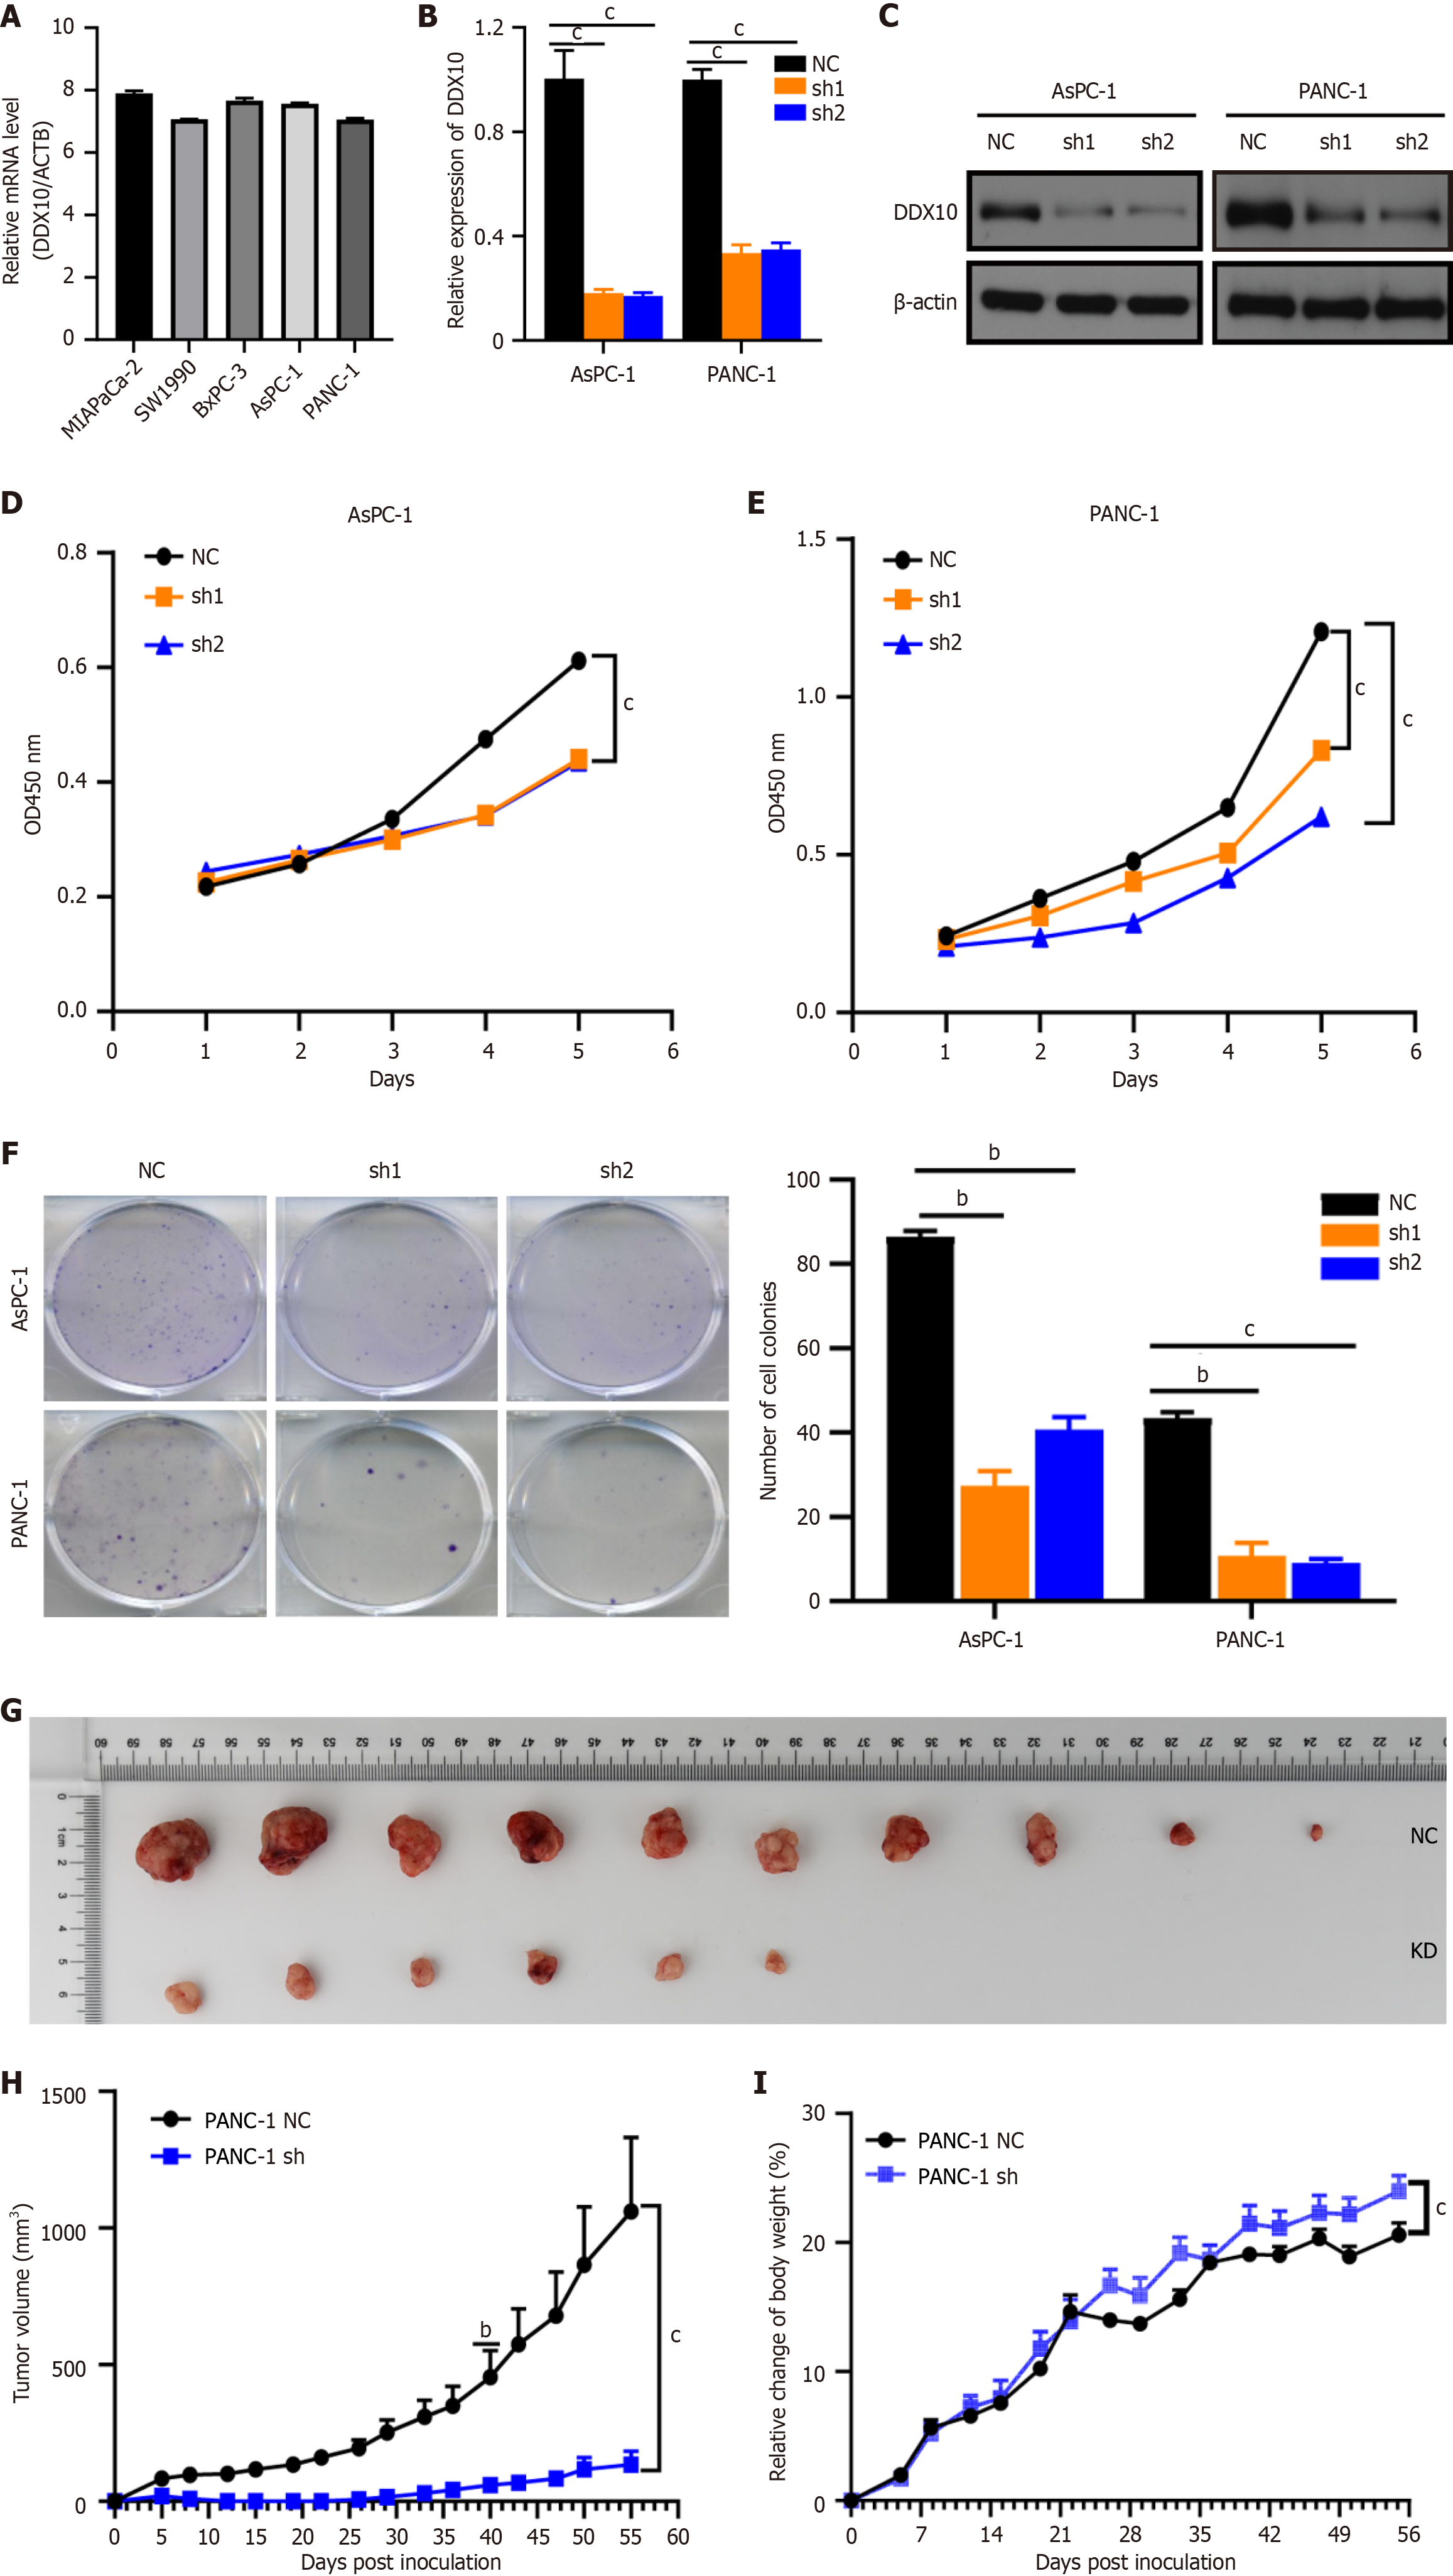
Figure 2 Knockdown of DEAD/H-box RNA helicase 10 inhibits the proliferation of pancreatic cancer cells.
A: DEAD/H-box RNA helicase 10 (DDX10) mRNA expression by quantitative real-time PCR (qRT-PCR) in five pancreatic cancer cells. The value was represented with ∆Ct (DDX10-ACTB). ACTB was utilized as internal reference. All the reactions were run in triplicate. Data are represented as mean ± SD; B and C: Interference efficiency of two shRNAs for DDX10 was examined by qRT-PCR and Western blotting; D-F: Knockdown of DDX10 inhibits cell growth, as determined by counting kit-8 and colony formation assays; G: Gross observation of xenograft tumor size; H and I: Volume and weight of tumors derived from nude mouse models following DDX10 downregulation by shRNA were decreased in vivo. bP < 0.01, cP < 0.001; DDX10: DEAD/H-box RNA helicase 10; sh1: Sh1RNA-DEAD/H-box RNA helicase 10; sh2: Sh2RNA-DEAD/H-box RNA helicase 10.
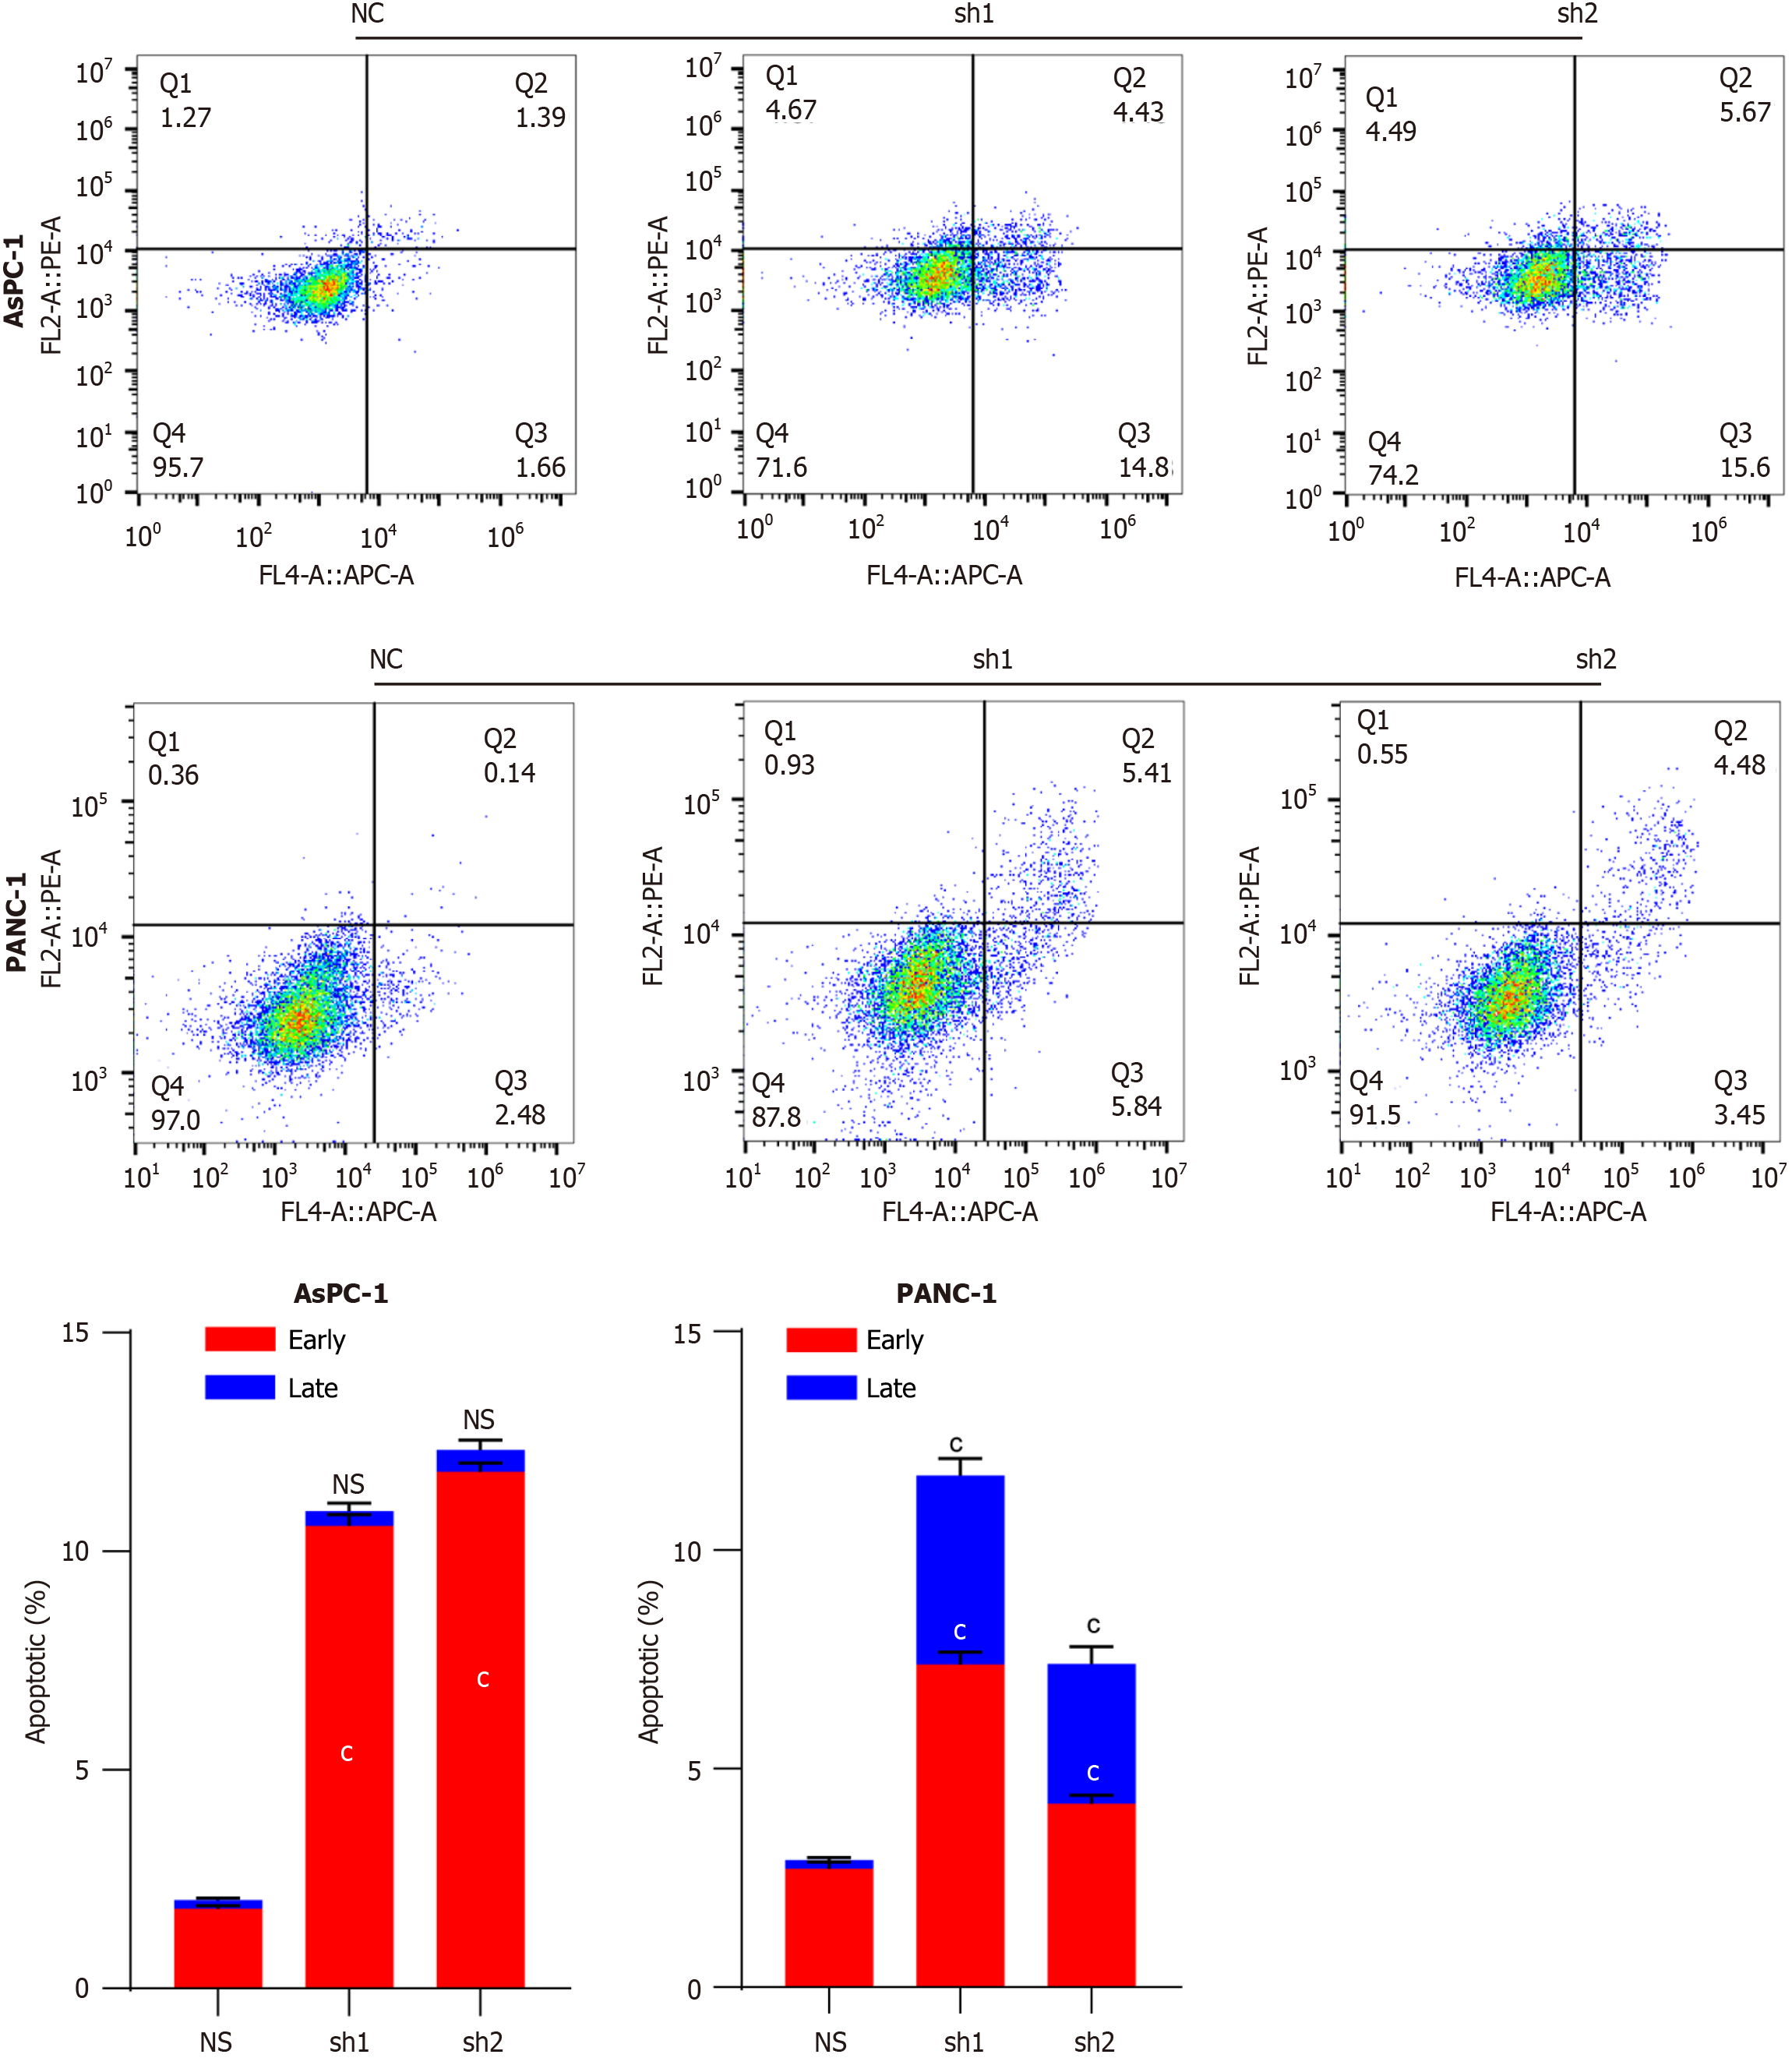
Figure 3 Flow cytometry detection of apoptosis in DEAD/H-box RNA helicase 10 knockdown pancreatic cancer cells.
Apoptosis detection in AsPC-1 and PANC-1 pancreatic cancer cell lines with DDX10 knockdown. cP < 0.001; NS: No significance; DDX10: DEAD/H-box RNA helicase 10; sh1: Sh1RNA-DEAD/H-box RNA helicase 10; sh2: Sh2RNA-DEAD/H-box RNA helicase 10.
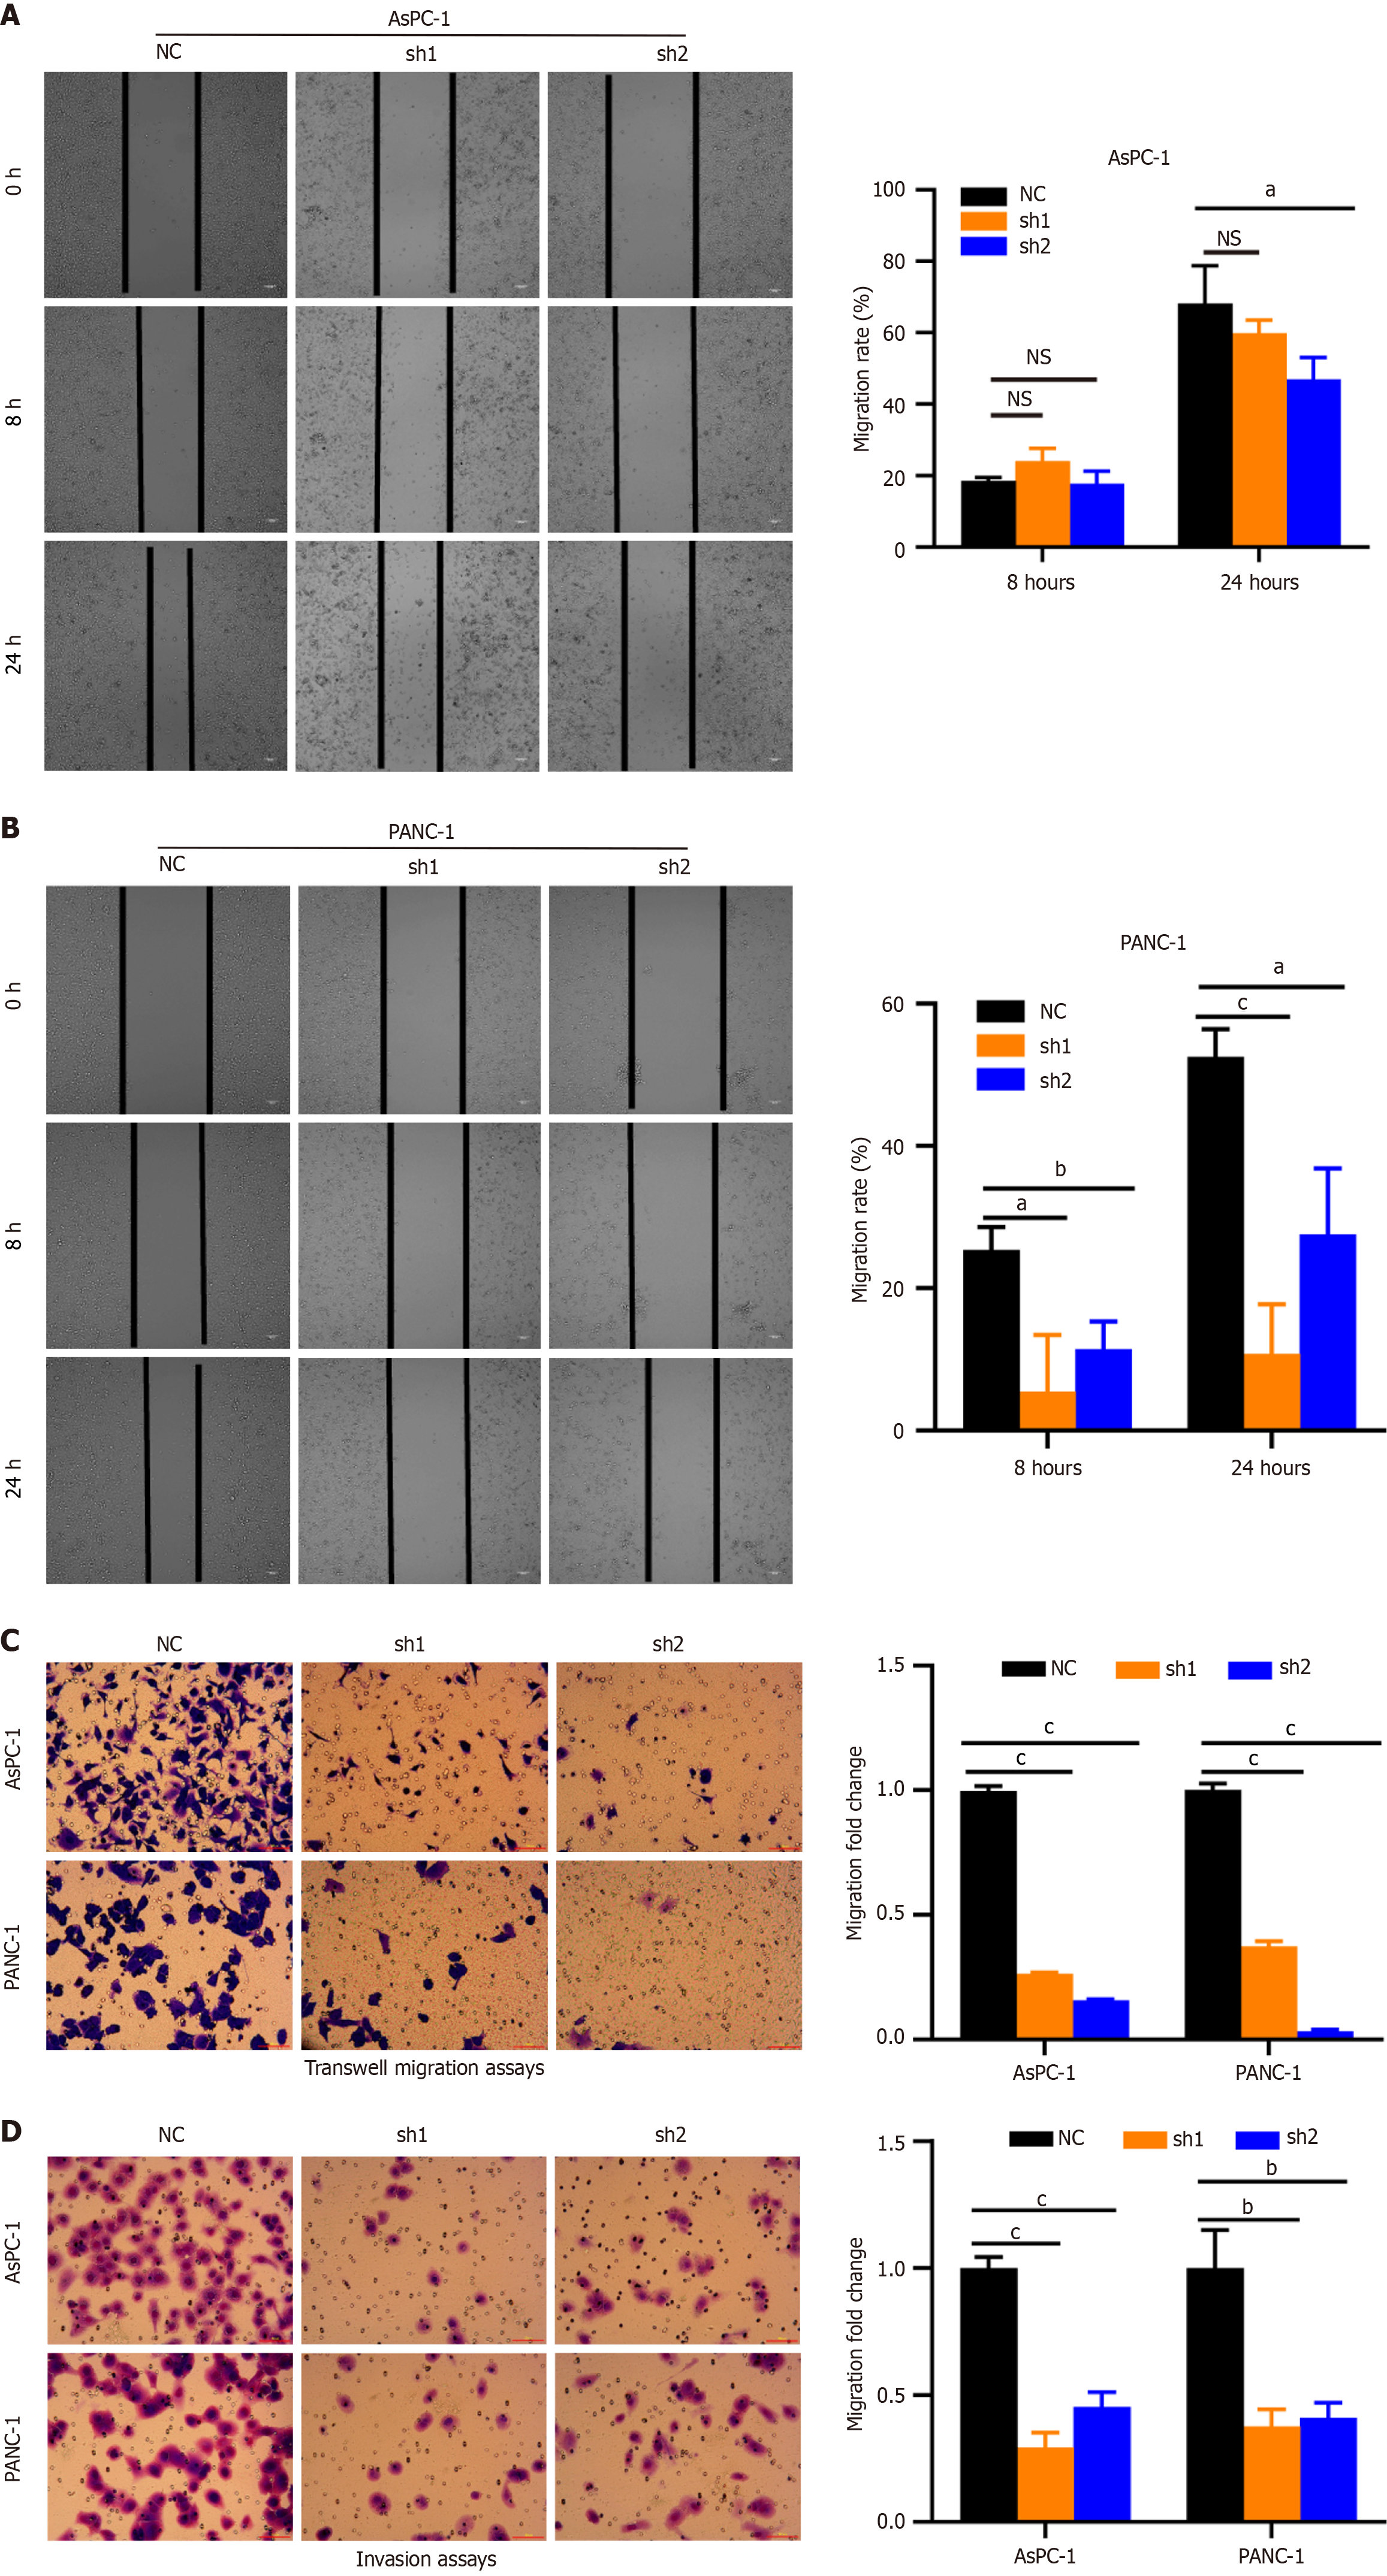
Figure 4 Knockdown of EAD/H-box RNA helicase 10 inhibits migration and invasion of pancreatic cancer cells.
A and B: Representative images of wound healing by DEAD/H-box RNA helicase 10 (DDX10) knockdown (shRNA) and control (NC) cells were photographed at 0 hour and 24 hours after scraping; C: Cell migration was measured by transwell assays; D: Transwell invasion assays using DDX10-knockdown AsPC-1 and PANC-1 cells; Number of migrated cells was exhibited as the mean ± SD of three randomly chosen visual fields from three independent experiments. aP < 0.05; bP < 0.01; cP < 0.001; NS: No significance; PC: Pancreatic cancer.
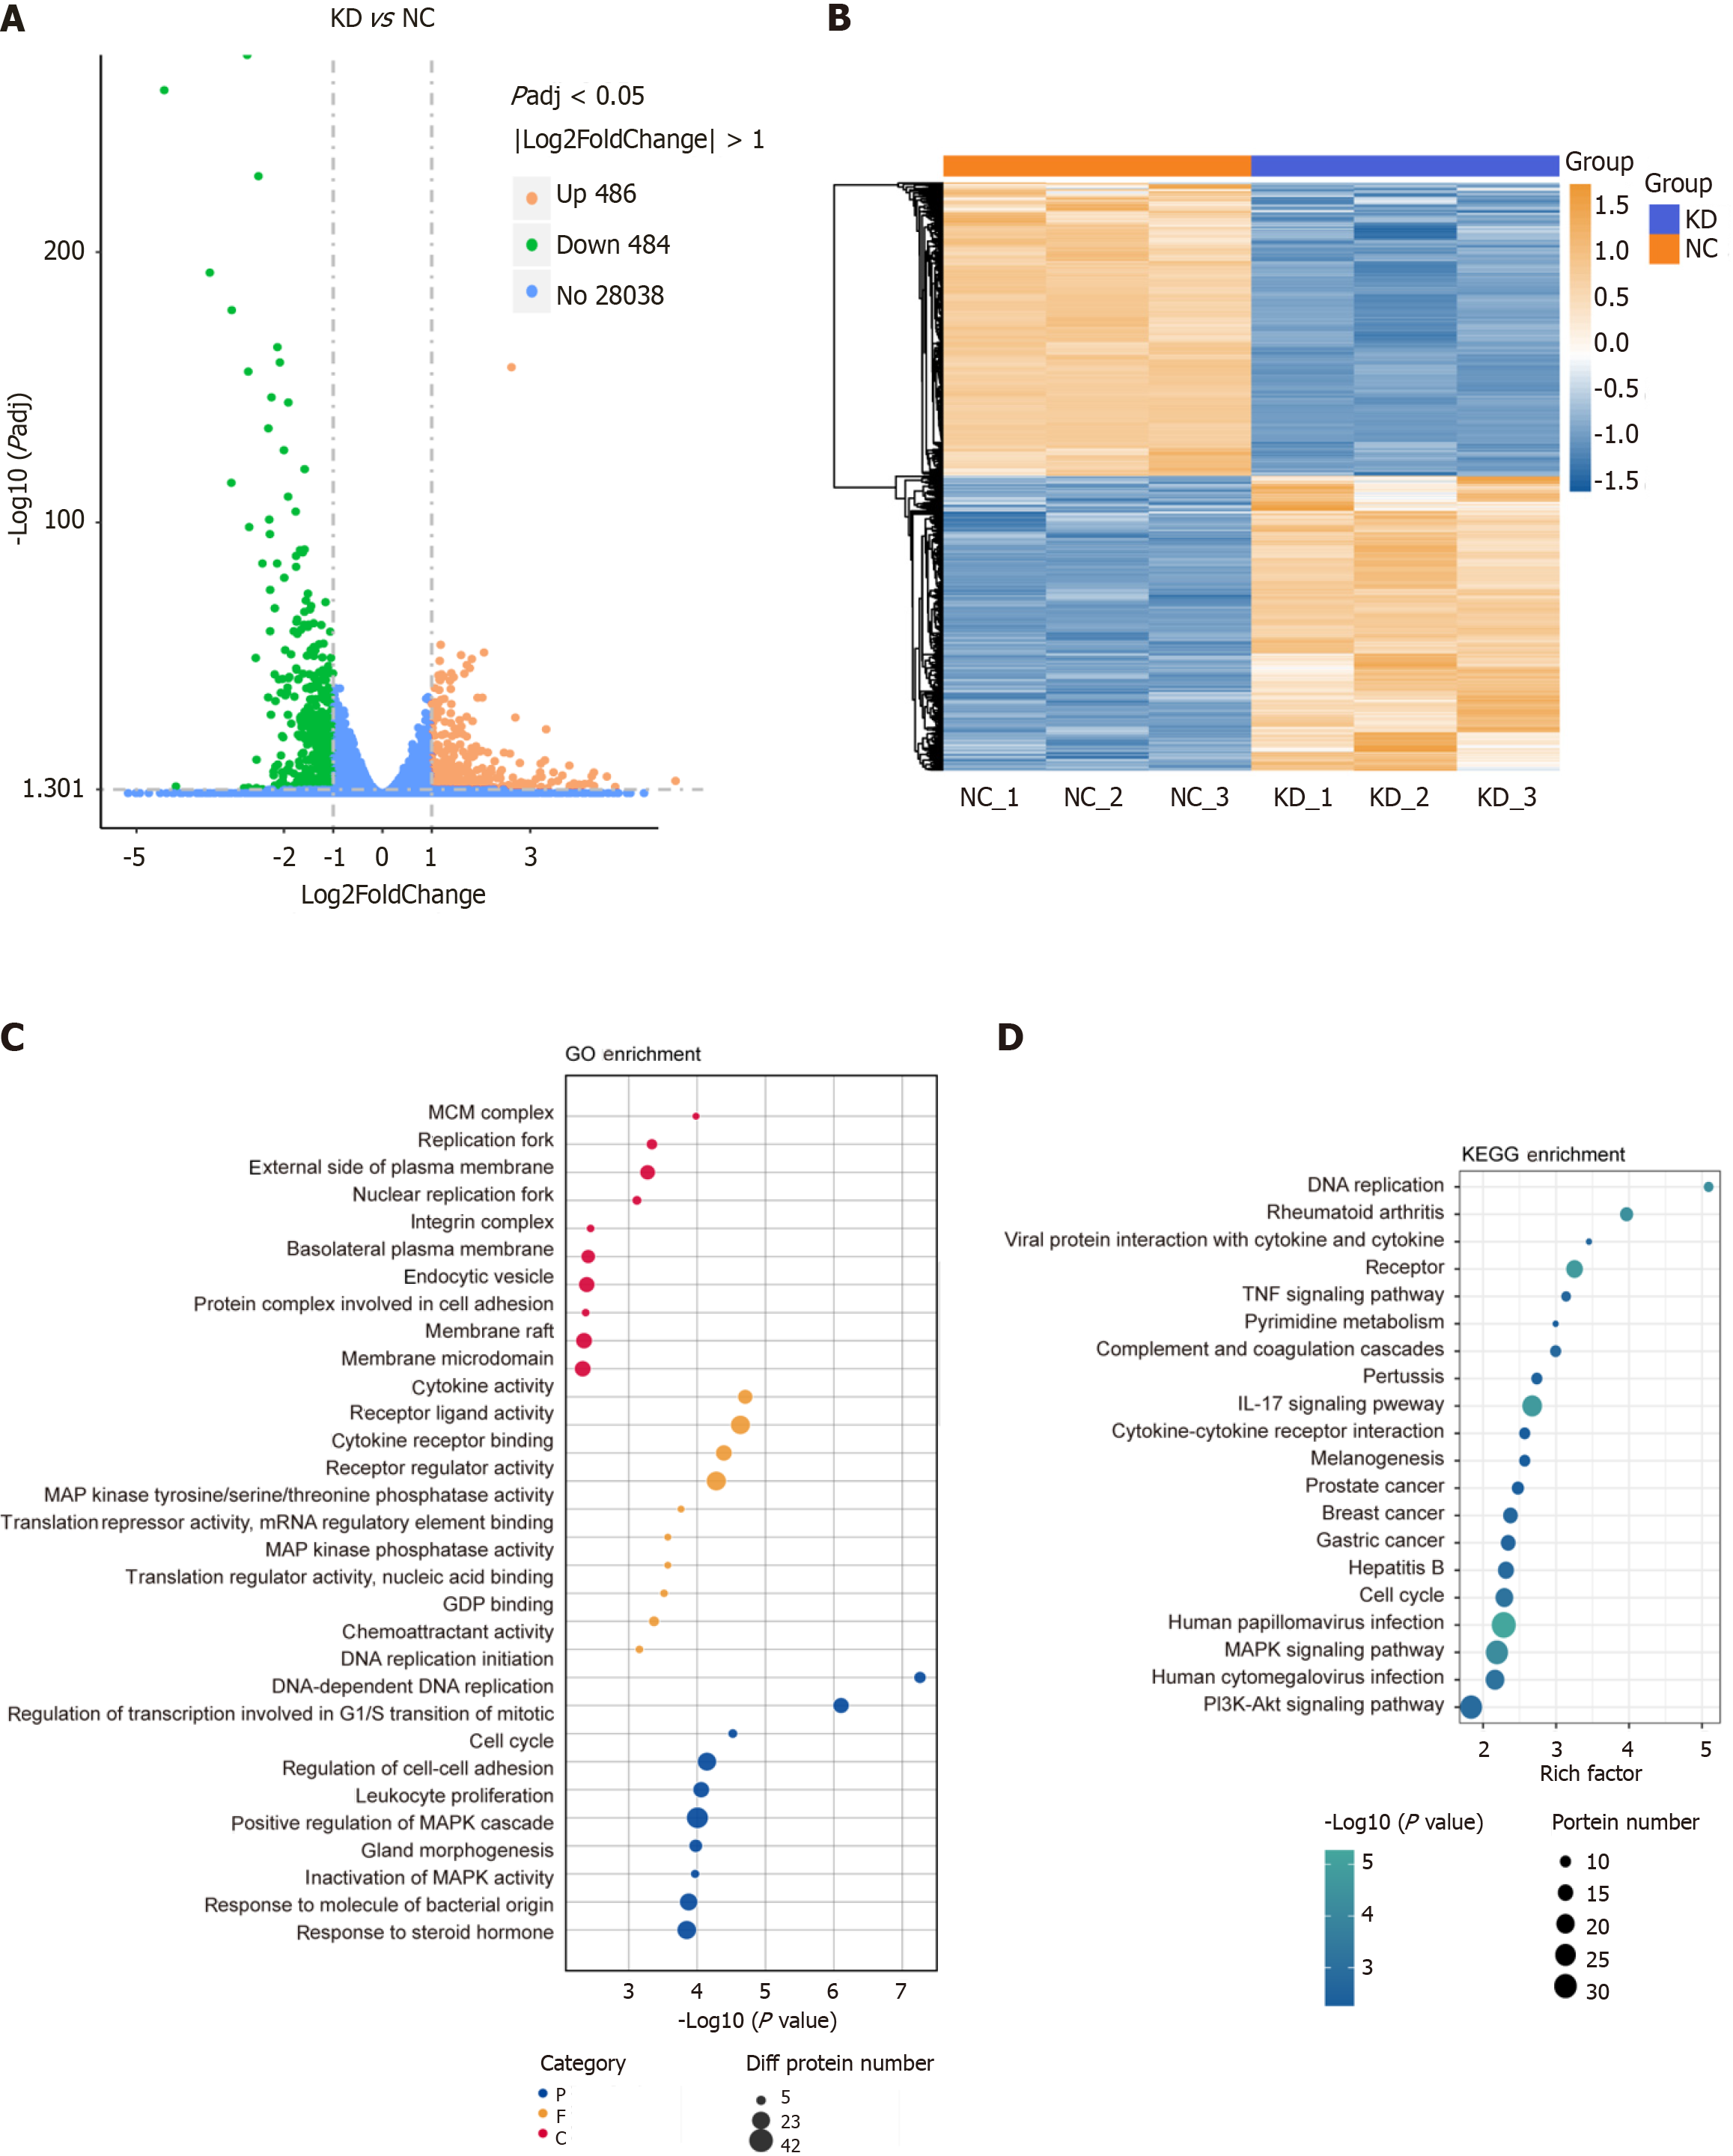
Figure 5 RNA-seq by DEAD/H-box RNA helicase 10 knockdown (shRNA) and control (NC).
Padj ≤ 0.05 |log2FoldChange| ≥ 1.0. A: Differential Gene Volcano Map; B: The differential genes of the three comparison groups were clustered after taking the concatenated set as the set of differential genes for cluster analysis; C: The cluster Profiler software was used to analyze the GO functional enrichment of the differential gene sets, and the 30 most significant Terms were selected to draw bubble plots; D: From the KEGG enrichment results, the 20 most significant KEGG pathways were selected to be shown in bubble plots.
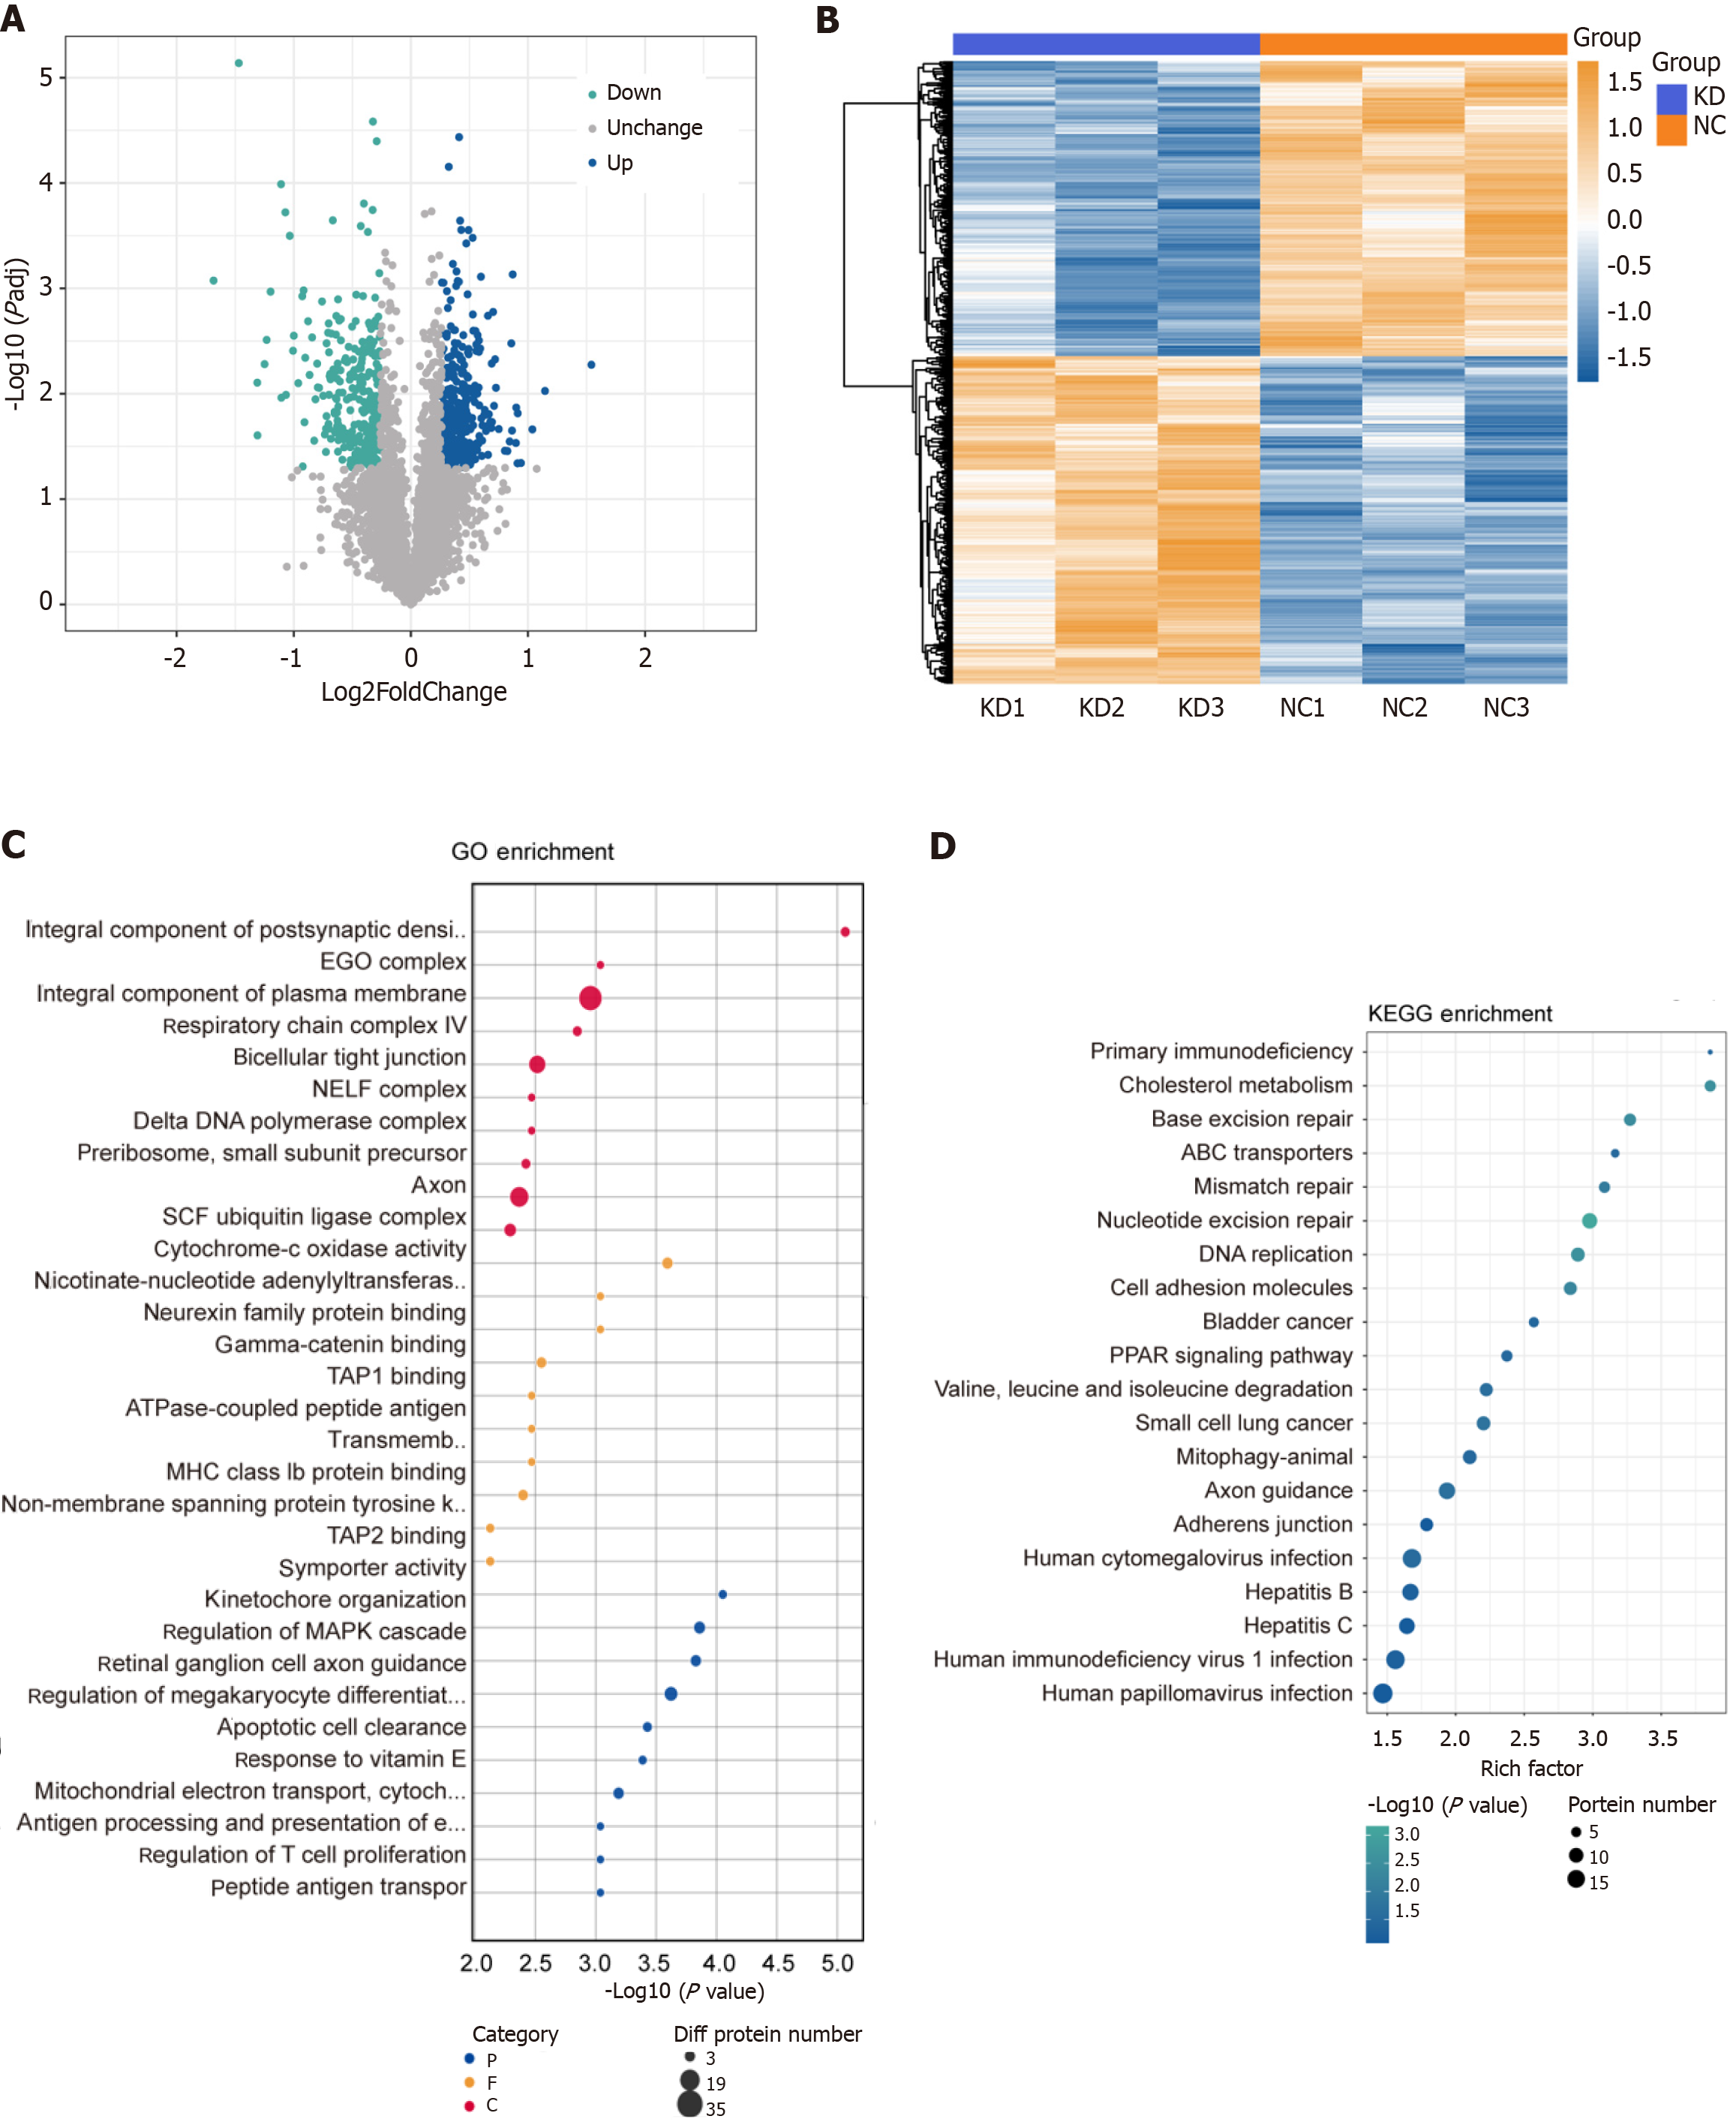
Figure 6 Proteomics analysis by DEAD/H-box RNA helicase 10 knockdown (shRNA) and control (NC).
|log2FoldChange| > 1.2 P ≤ 0.05. A: Differential proteins Volcano Map; B: The quantitative values of target proteins were normalized. Then used the matplotlib package in Python to classify samples and protein expression at the same time (distance algorithm: Euclidean; connection method: Average linkage). Finally, the hierarchical clustering heat map was generated; C and D: Based on the Fisher's Exact Test, compared the distribution of each GO term or KEGG pathway in the target protein set and the total protein set. Then, evaluate the significance level of the enrichment of a GO term or KEGG pathway.to be shown in bubble plots.
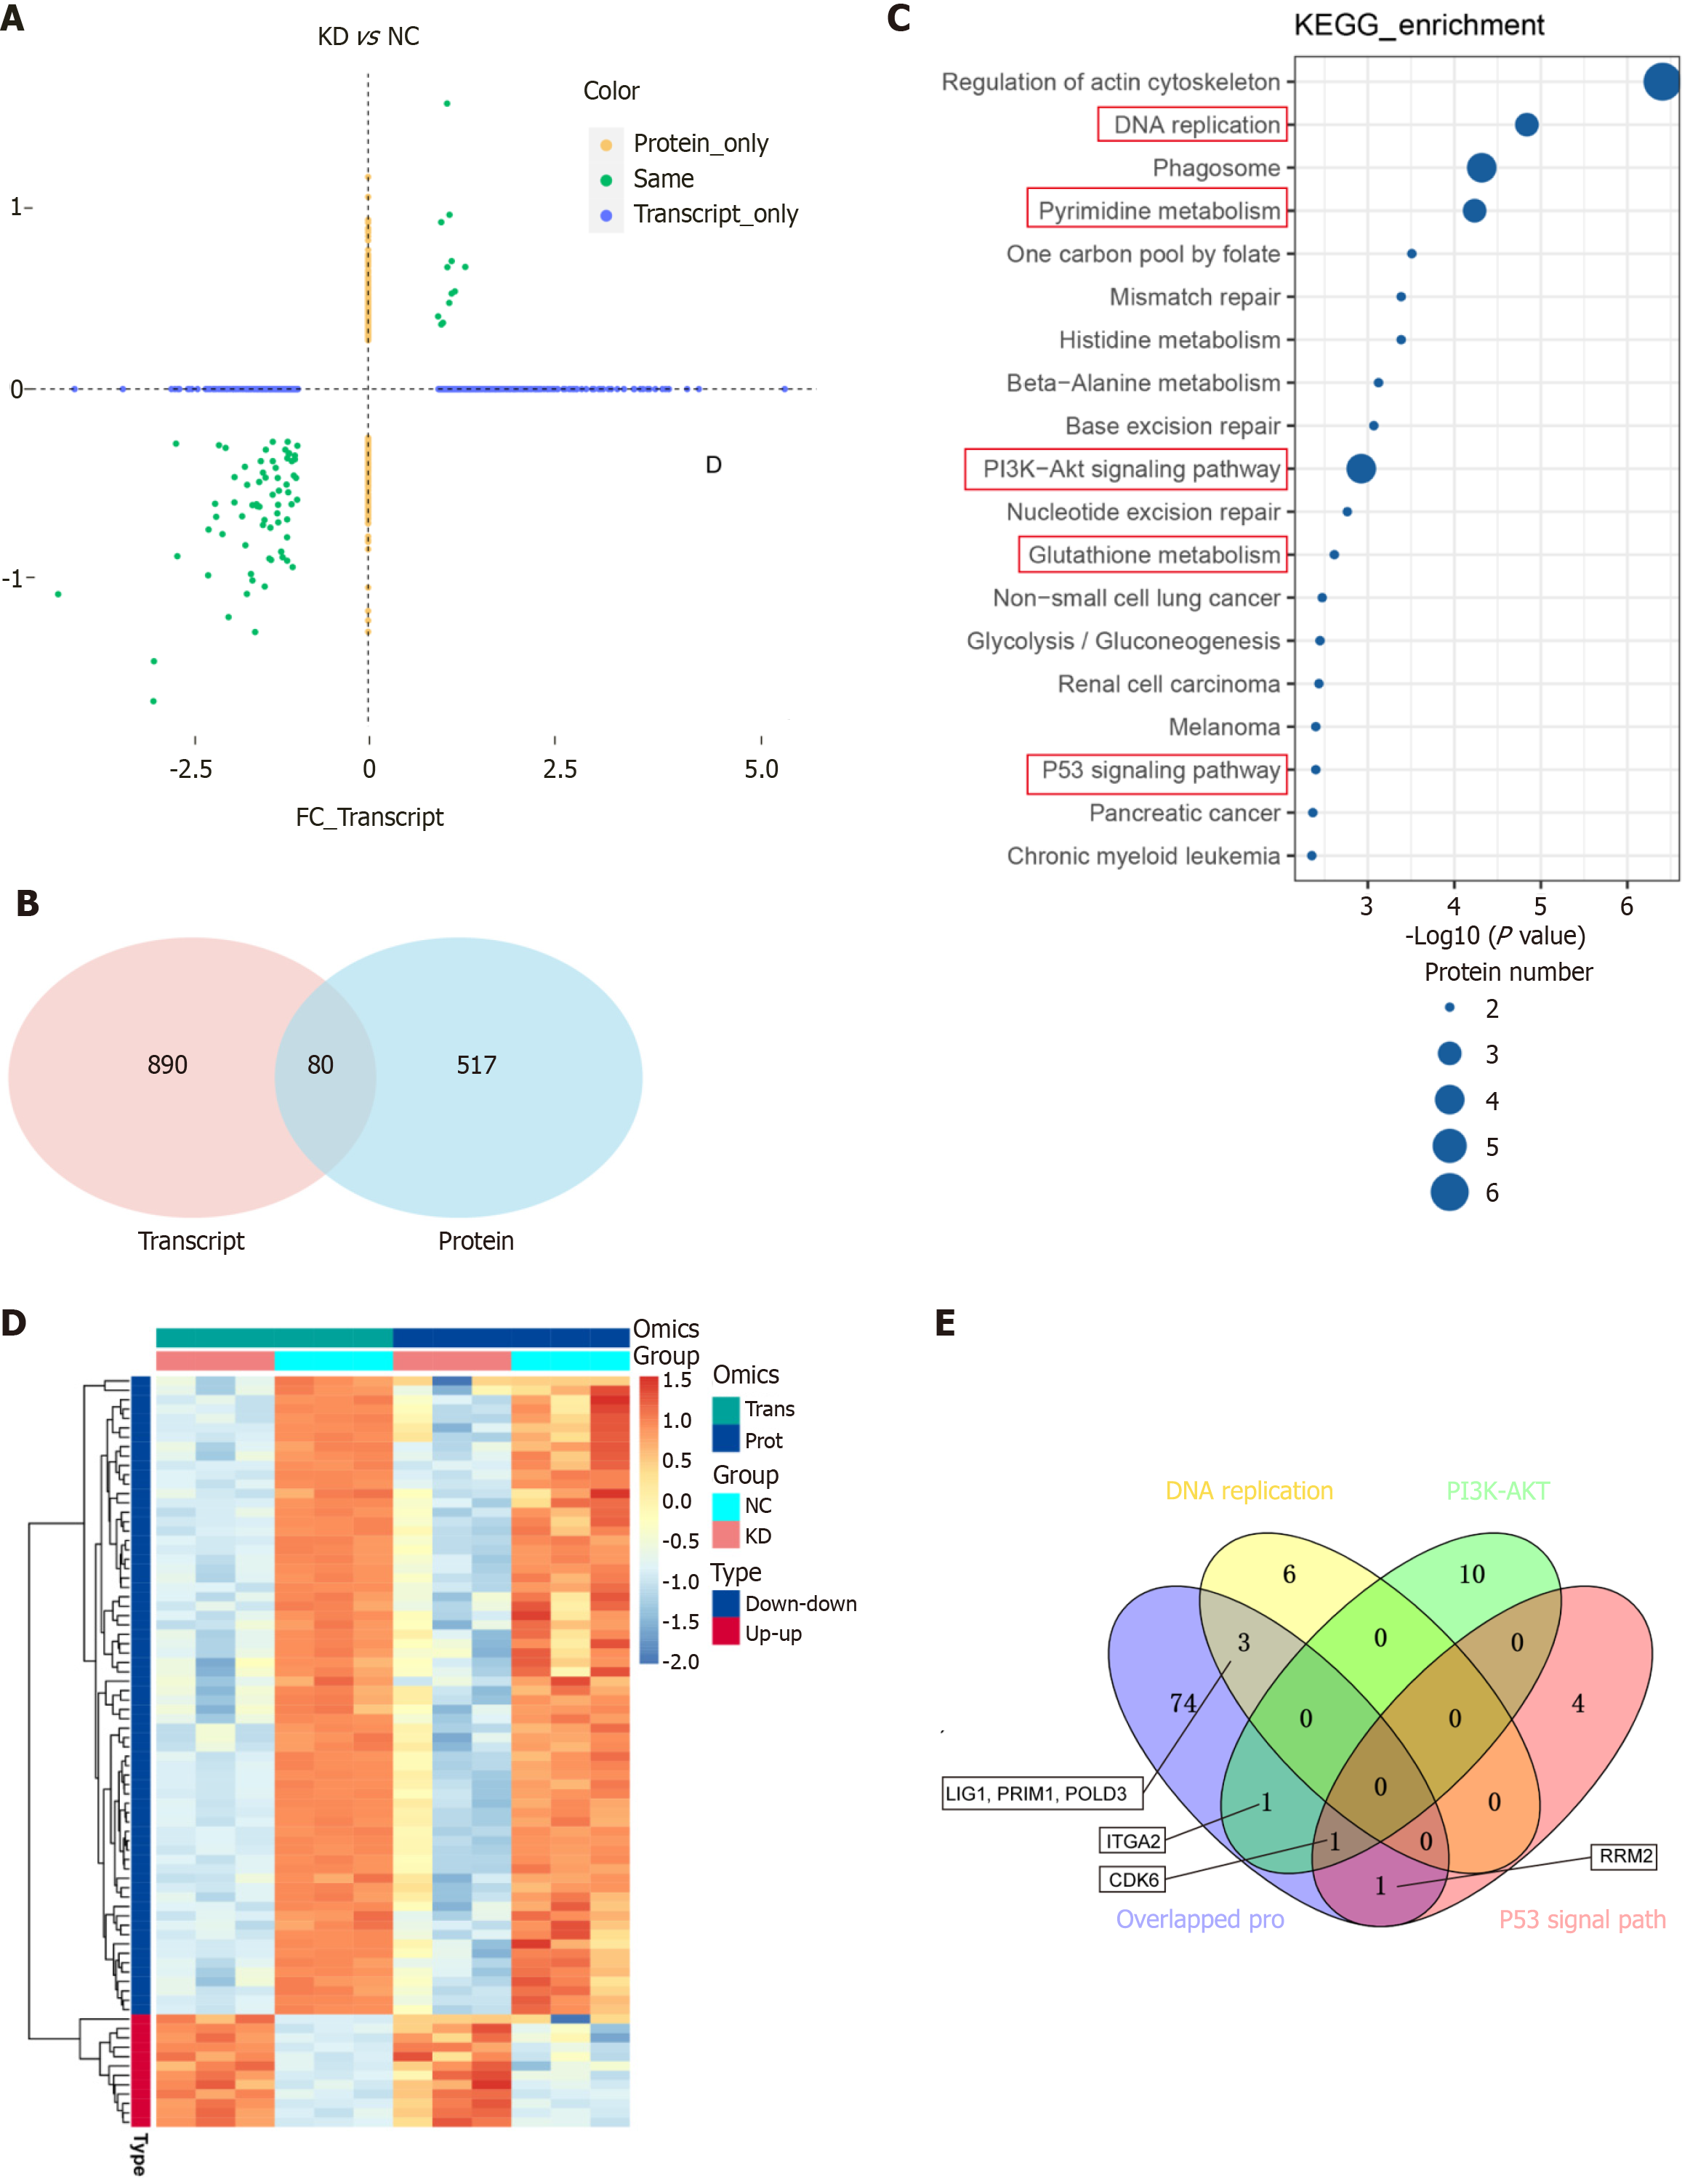
Figure 7 Proteomic (|log2FoldChange| > 1.
2 P ≤ 0.05) and RNA-seq |log2FoldChange|≥ 1.0, Padj ≤ 0.05 expression correlation analysis by DEAD/H-box RNA helicase 10 knockdown (shRNA) and control (NC). A: Proteomic and RNA-seq expression correlation analysis plots; B-E: The results of the association analysis were categorized into the following four categories: Demonstrating the distribution of overlap between proteomes and transcriptomes using the Venn plot (B); Heatmap for hierarchical clustering using differential proteins and associated transcriptomic data (C); The most significantly enriched pathways among the 80 genes were selected to be shown in bubble plots (D); The overlapping of 80 genes with PI3K-AKT, P53 signal pathway and DNA replication to produce a Venn diagram (E).
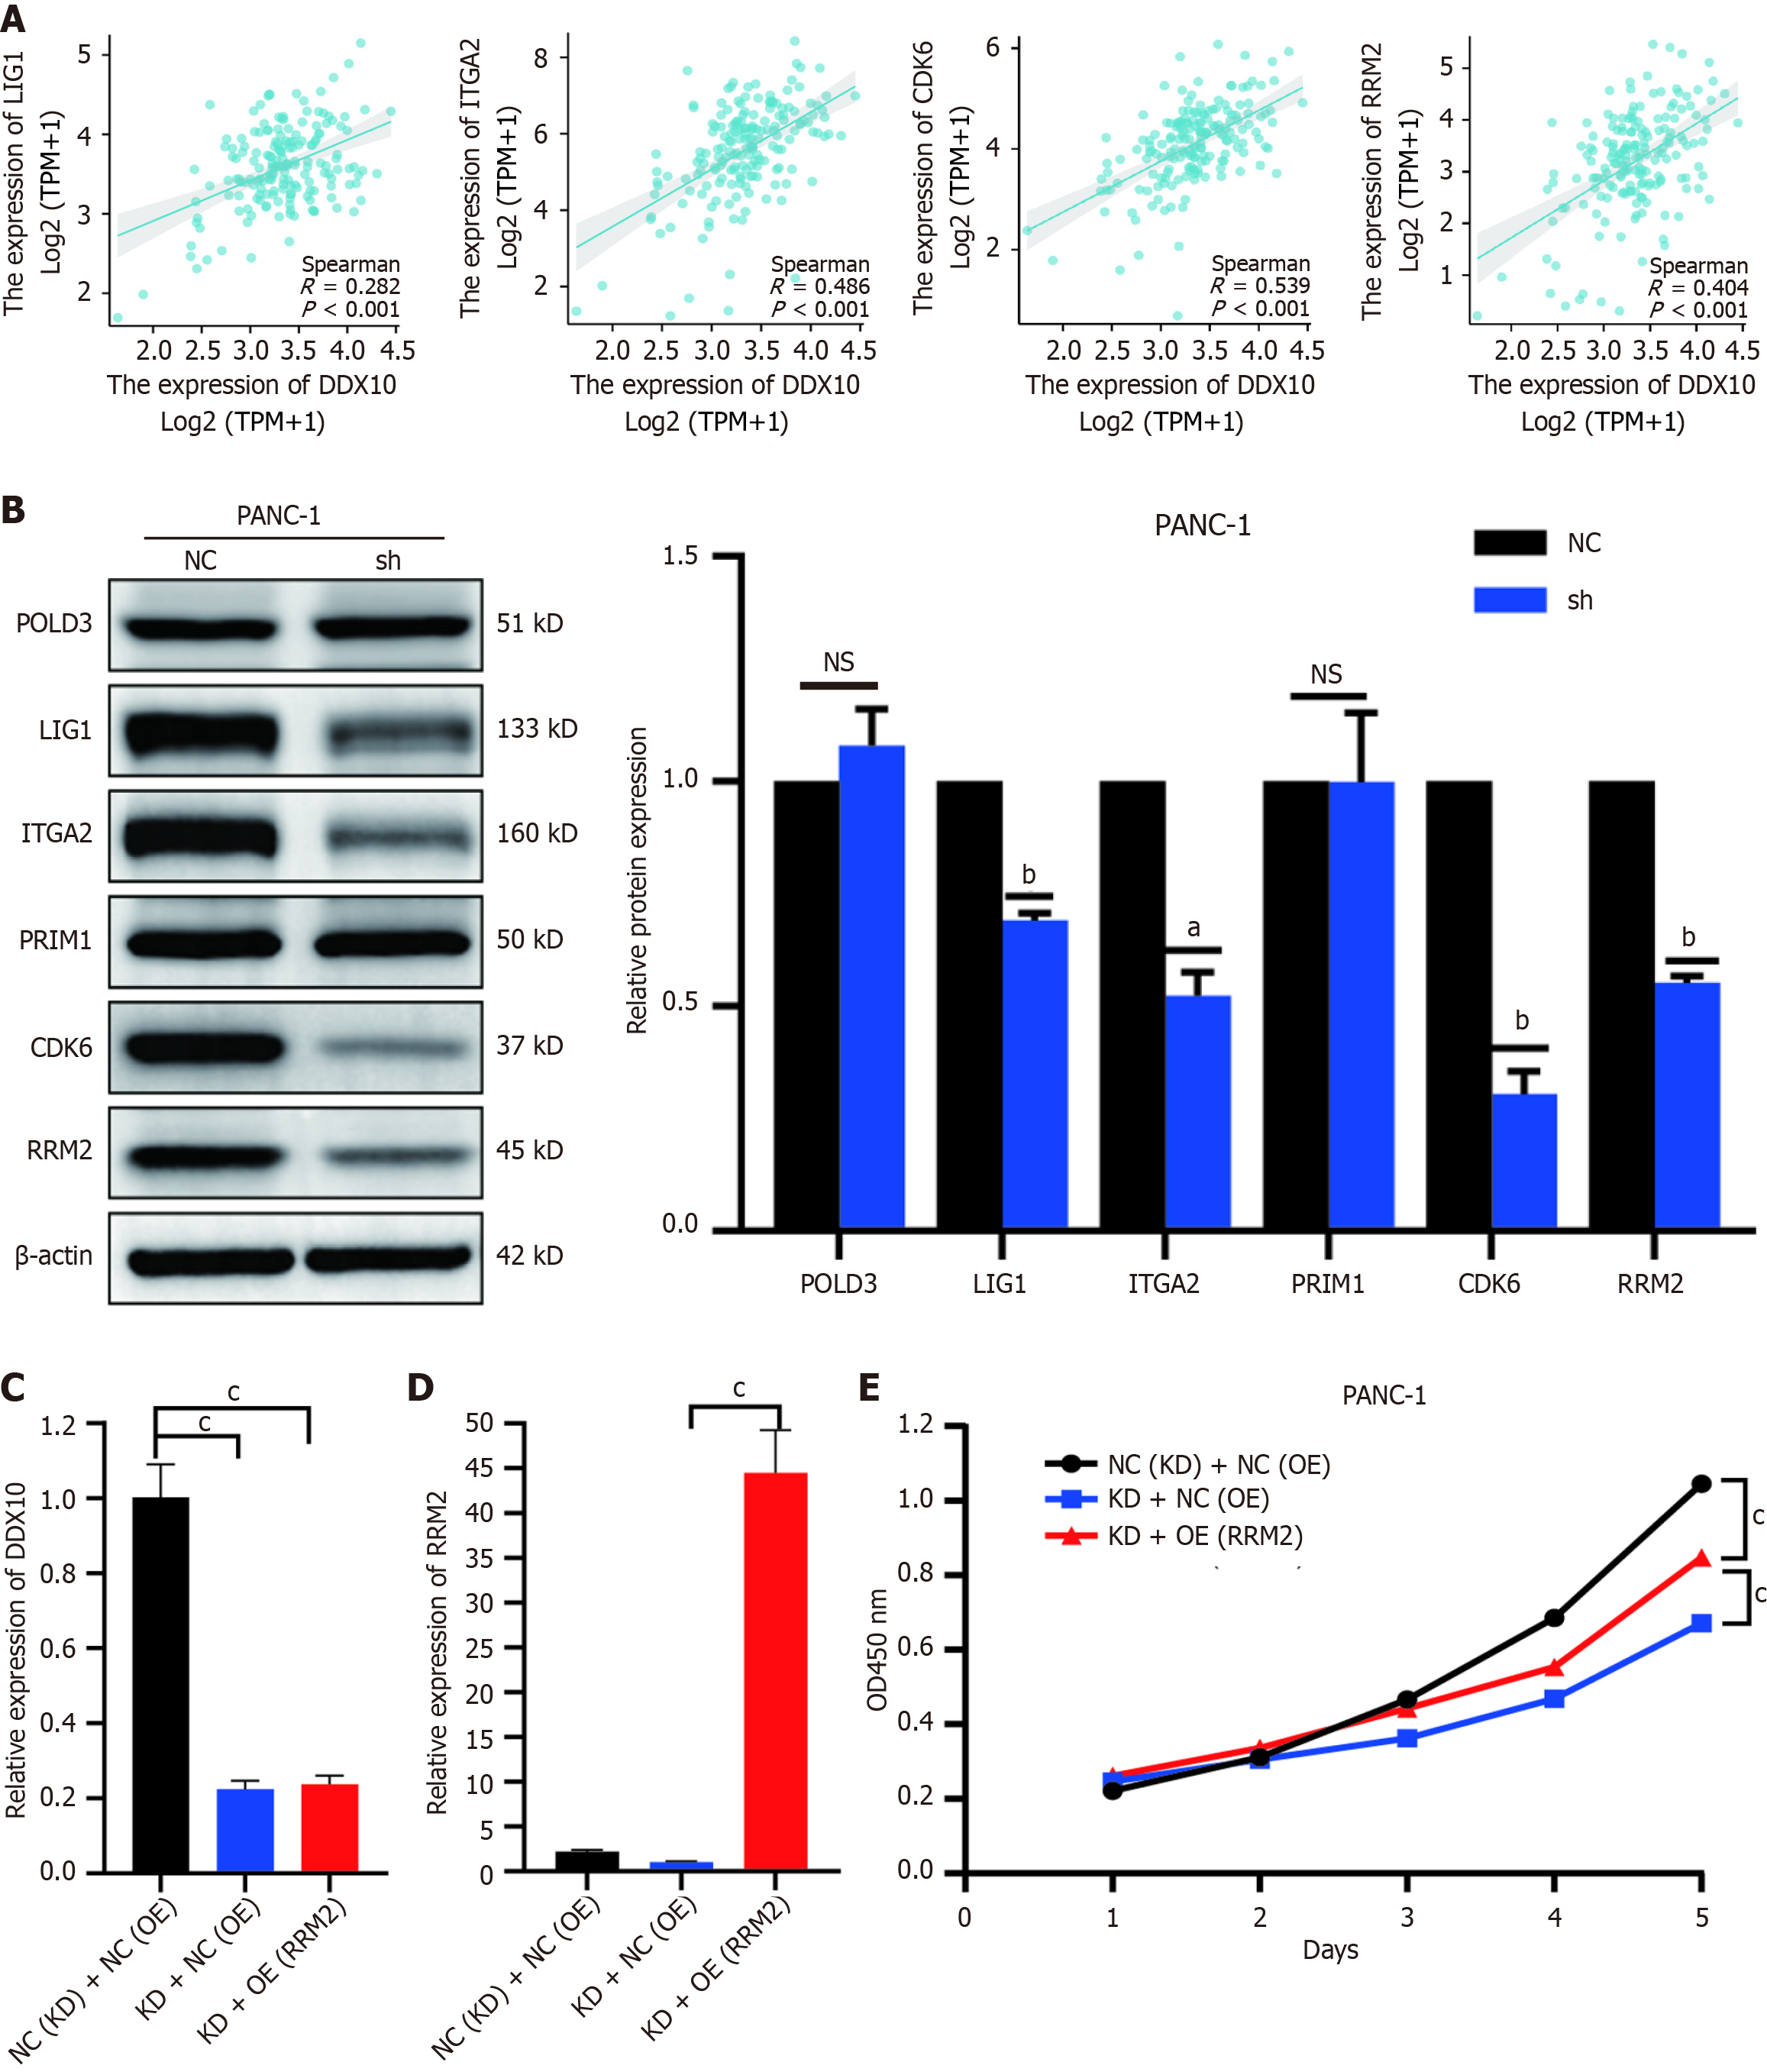
Figure 8 Clinical relevance of DEAD/H-box RNA helicase 10 and predictor proteins in TCGA data and experimental validation.
A: ITGA2, LIG1, RRM2, CDK6 are positively correlated with DEAD/H-box RNA helicase 10 (DDX10) expression; B: Western blotting verified the protein expression of 6 proteins in NC and shDDX10 groups; C: QPCR detection of mRNA expression of DDX10 in grouped cells; D: QPCR detection of mRNA expression of RRM2 in grouped cells; E: Functional rescue assay of shDDX10 with RRM2 overexpression detected by cell counting kit-8. aP < 0.05; bP < 0.01; cP < 0.001; NS: No significance; DDX10: DEAD/H-box RNA helicase 10.
- Citation: Qiu ZS, Wang XC, Ma JC, Zhu CL, Hu YL, Da MX. DEAD/H-box RNA helicase 10 promotes pancreatic cancer cell proliferation via ribonucleotide reductase M2. World J Gastrointest Oncol 2025; 17(9): 108672
- URL: https://www.wjgnet.com/1948-5204/full/v17/i9/108672.htm
- DOI: https://dx.doi.org/10.4251/wjgo.v17.i9.108672


