©The Author(s) 2025.
World J Gastrointest Oncol. Mar 15, 2025; 17(3): 100927
Published online Mar 15, 2025. doi: 10.4251/wjgo.v17.i3.100927
Published online Mar 15, 2025. doi: 10.4251/wjgo.v17.i3.100927
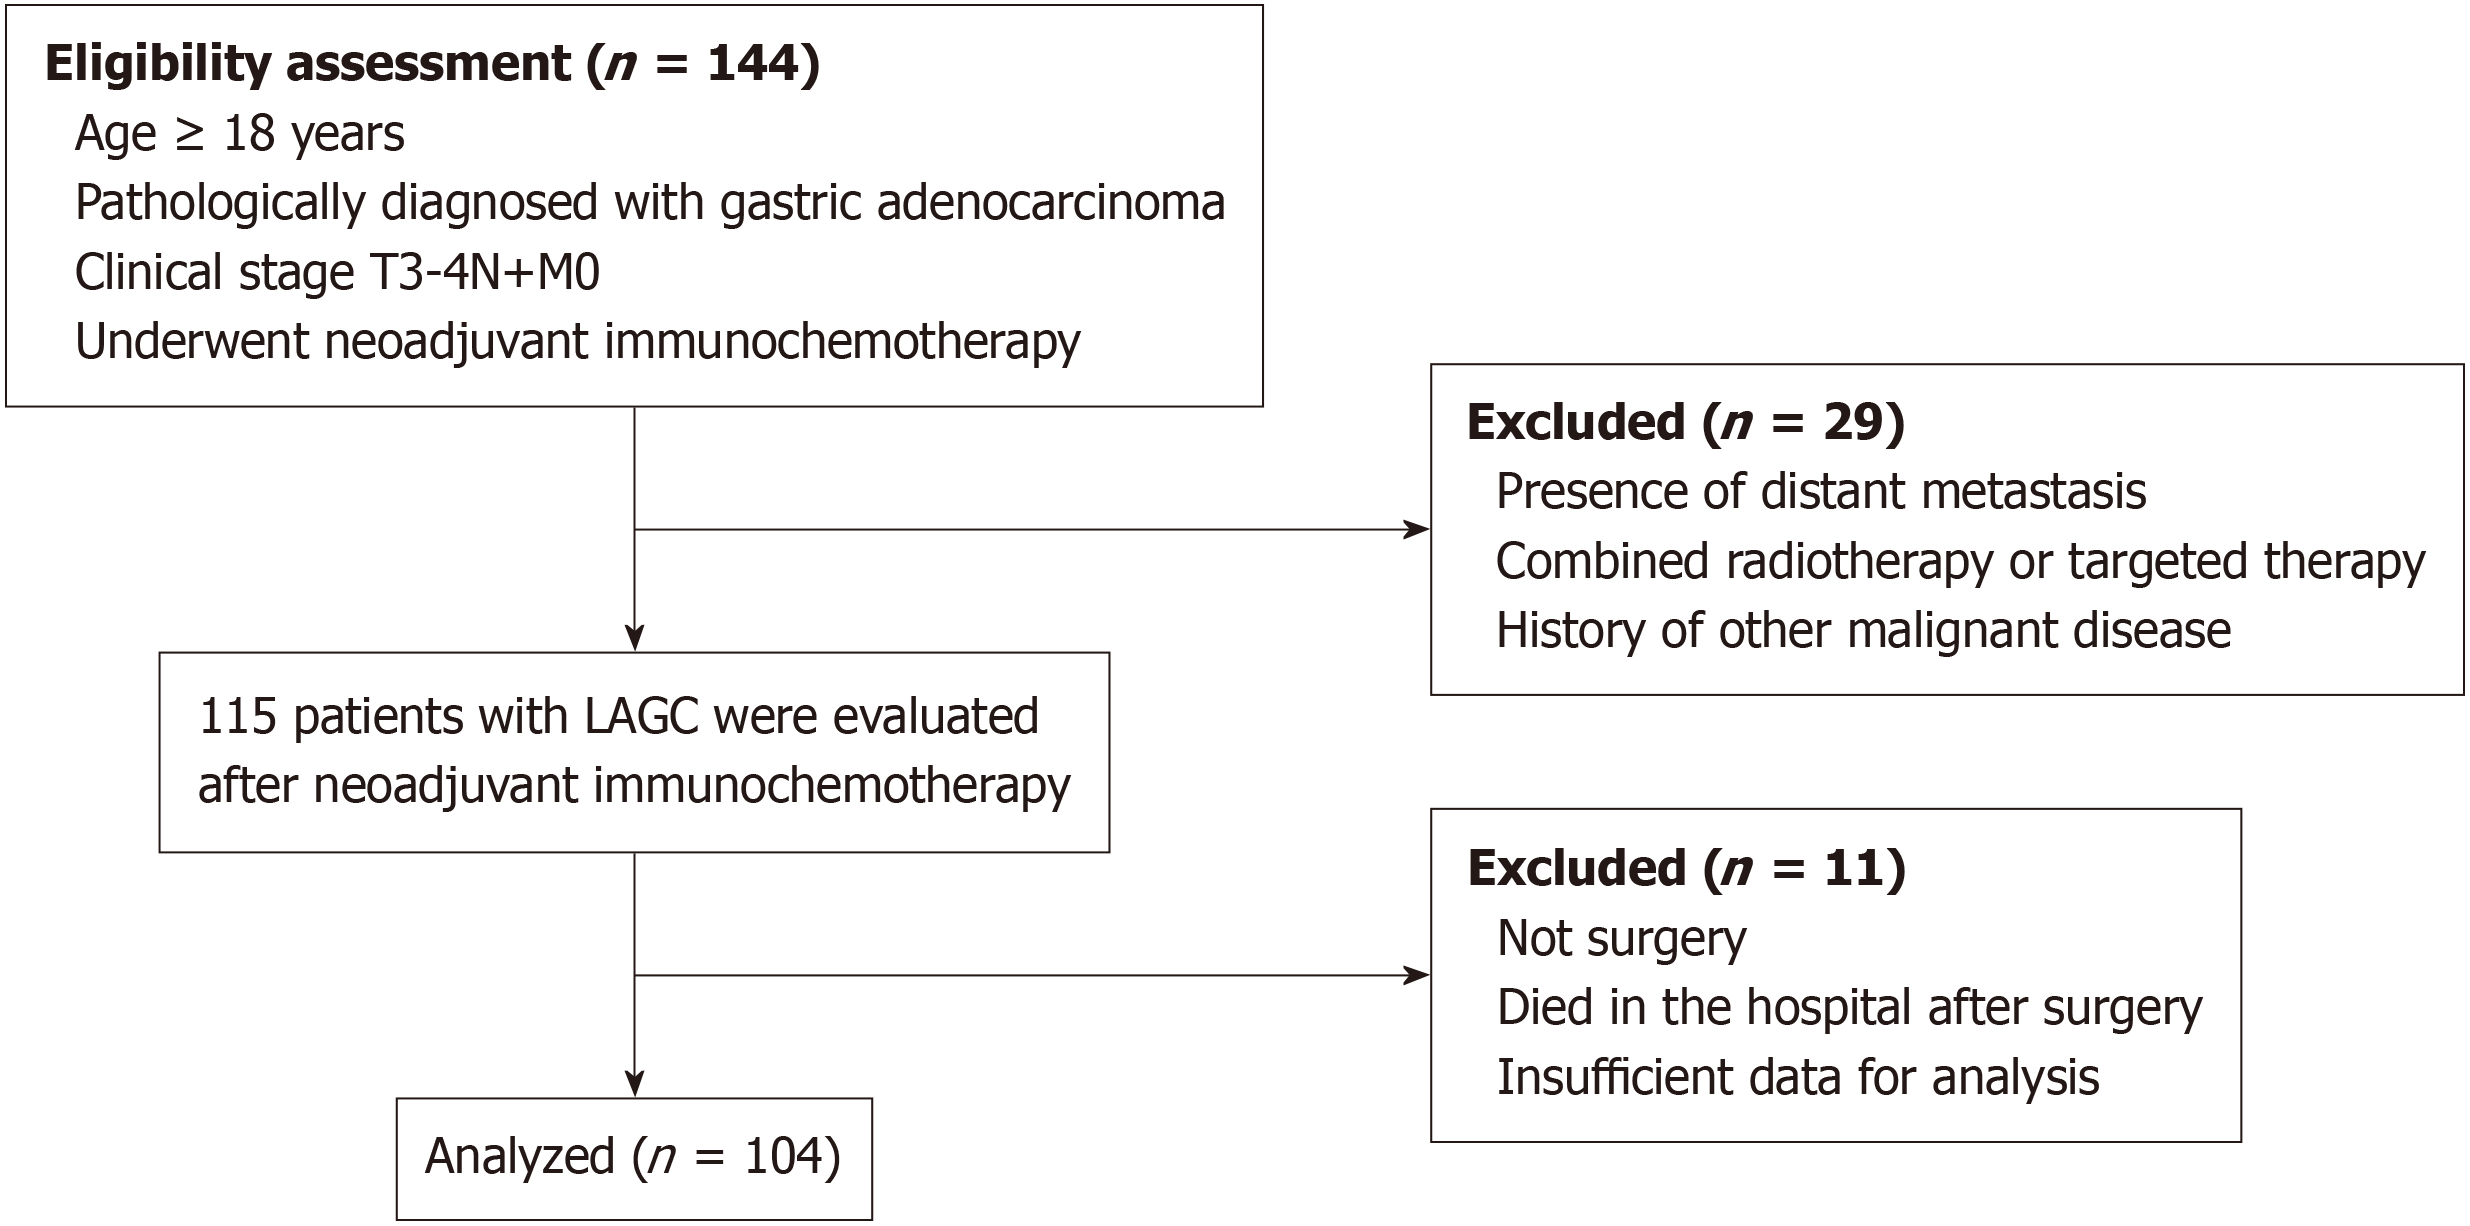
Figure 1 Flow diagram for screening participants.
LAGC: Locally advanced gastric cancer.
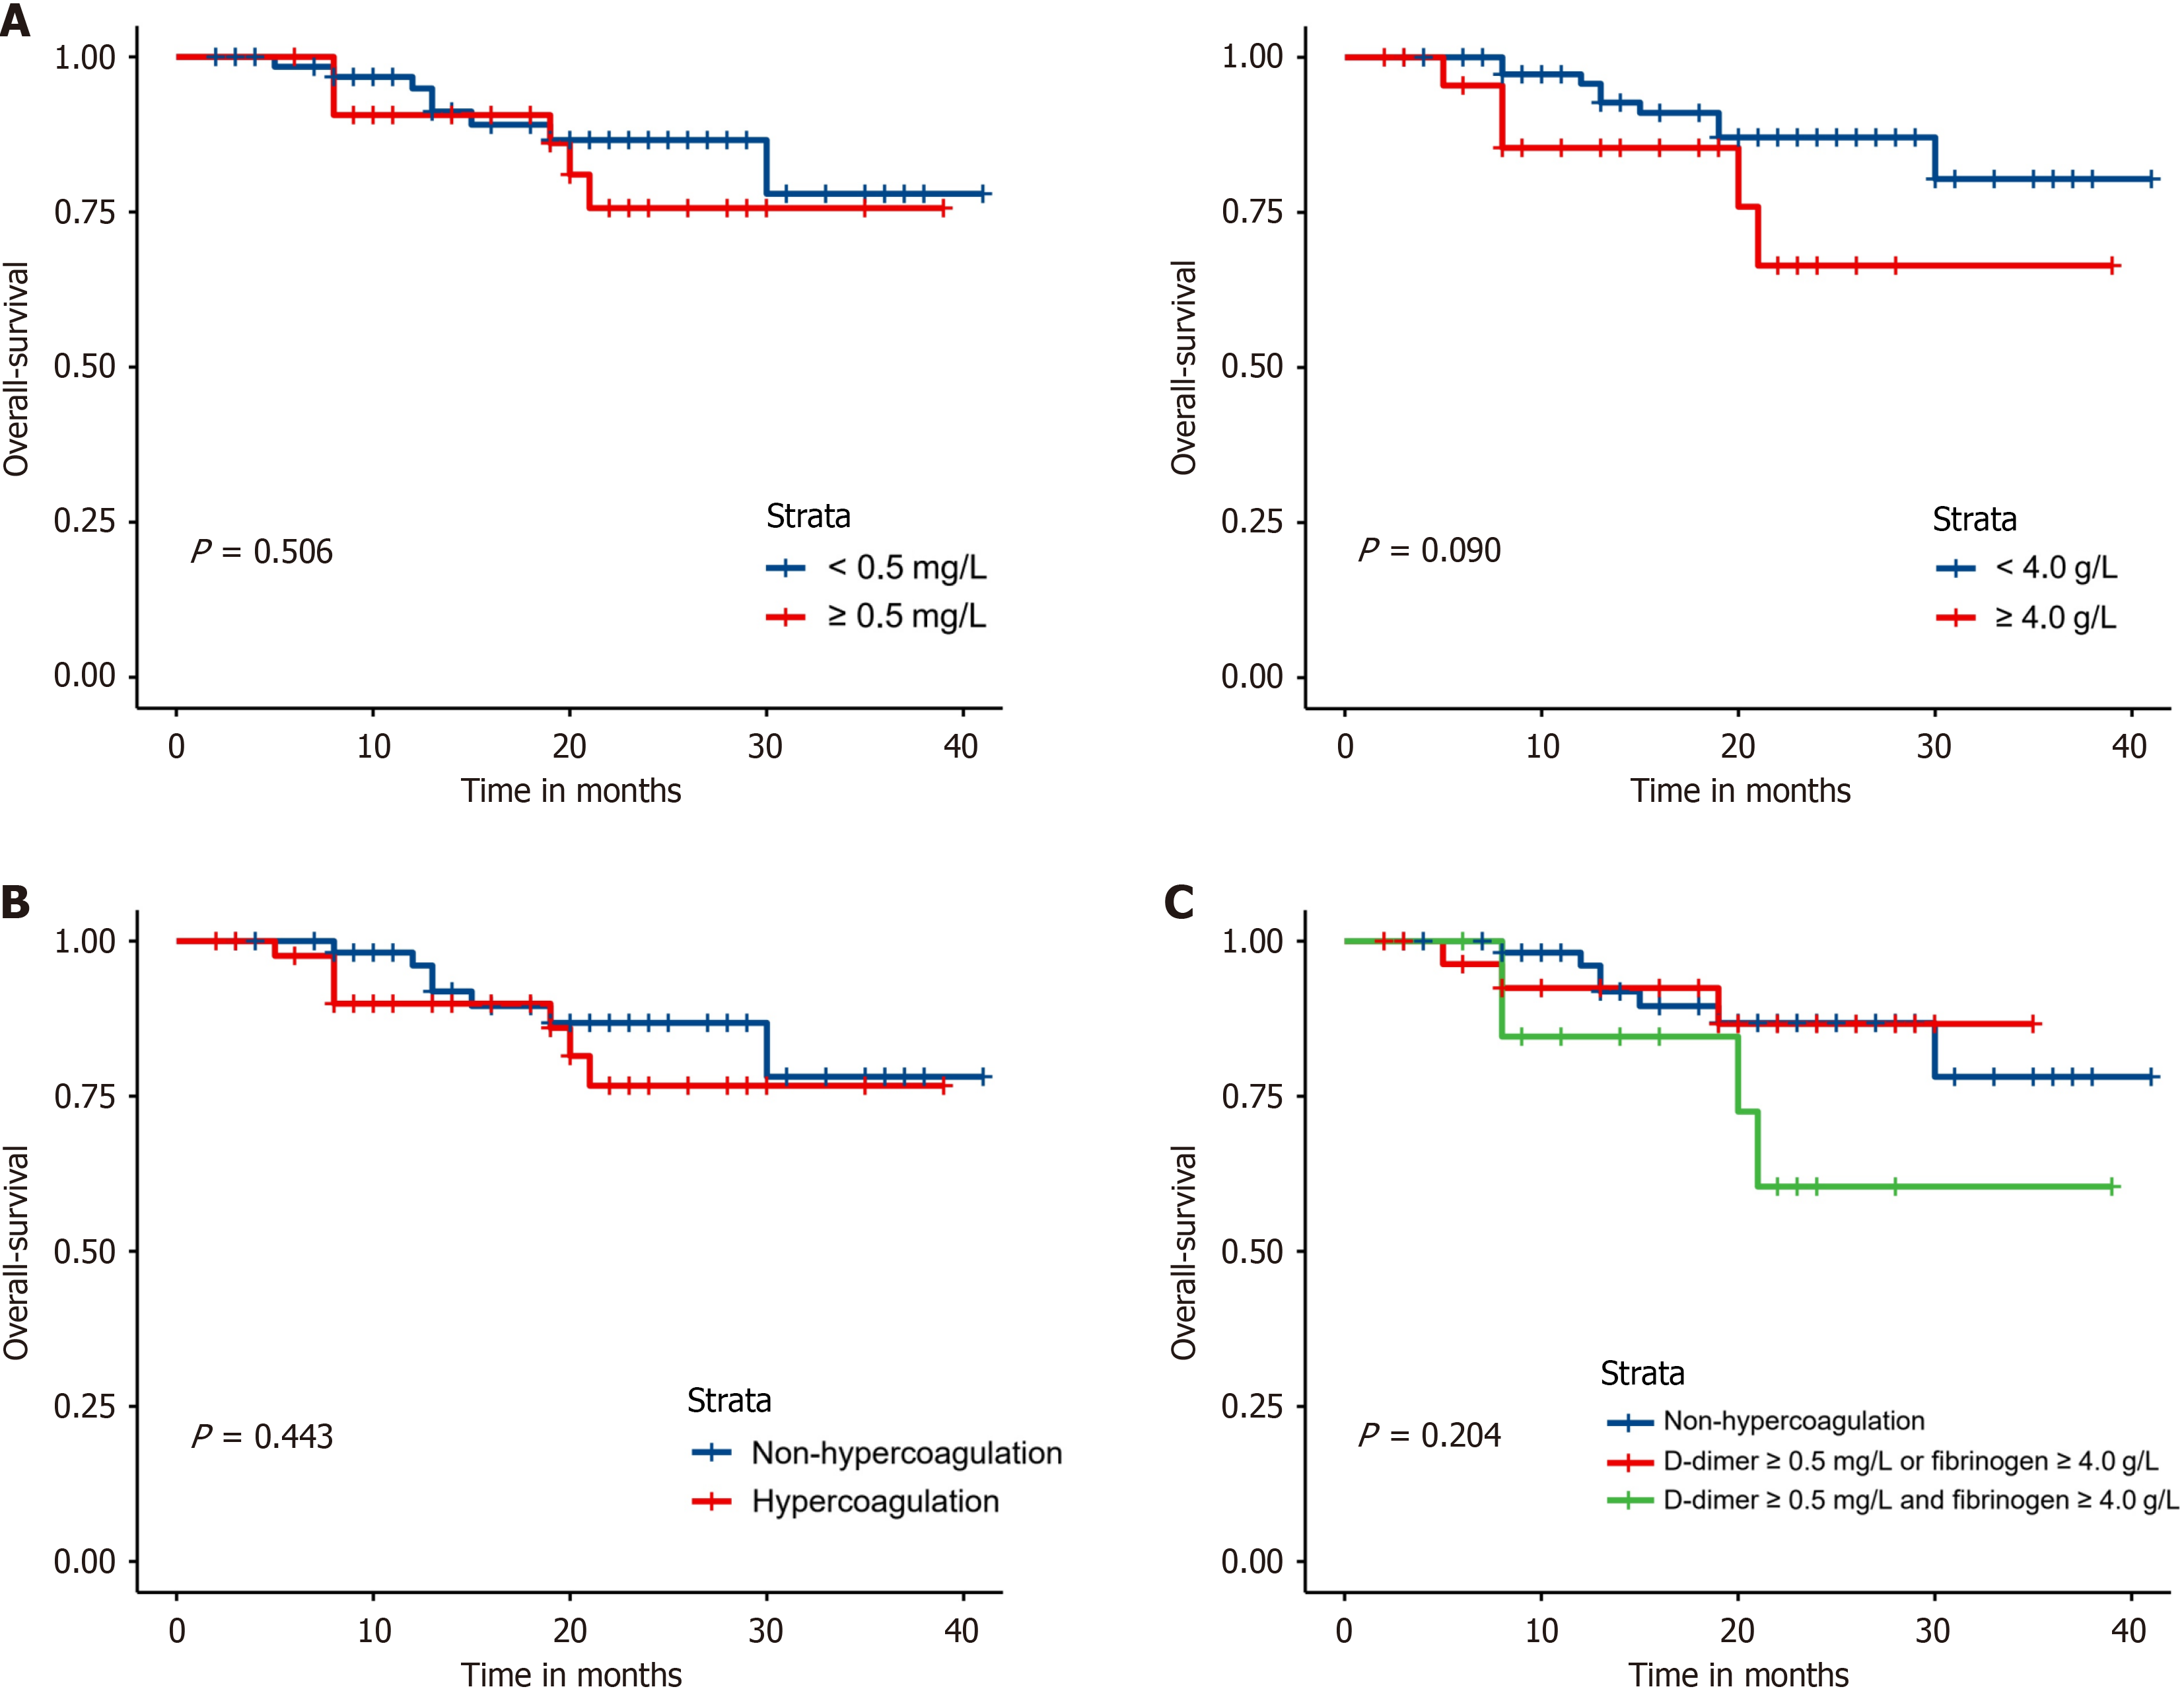
Figure 2 Comparison of overall survival according to pretherapeutic coagulation factors.
A: Overall survival (OS) associated with pretherapeutic plasma D-dimer and fibrinogen concentrations; B: Comparison of OS between pretherapeutic hypercoagulation and non-hypercoagulation; C: Comparison among pretherapeutic non-hypercoagulation, high concentrations of either (either elevated), and high concentrations of both (both elevated) after neoadjuvant immunochemotherapy.
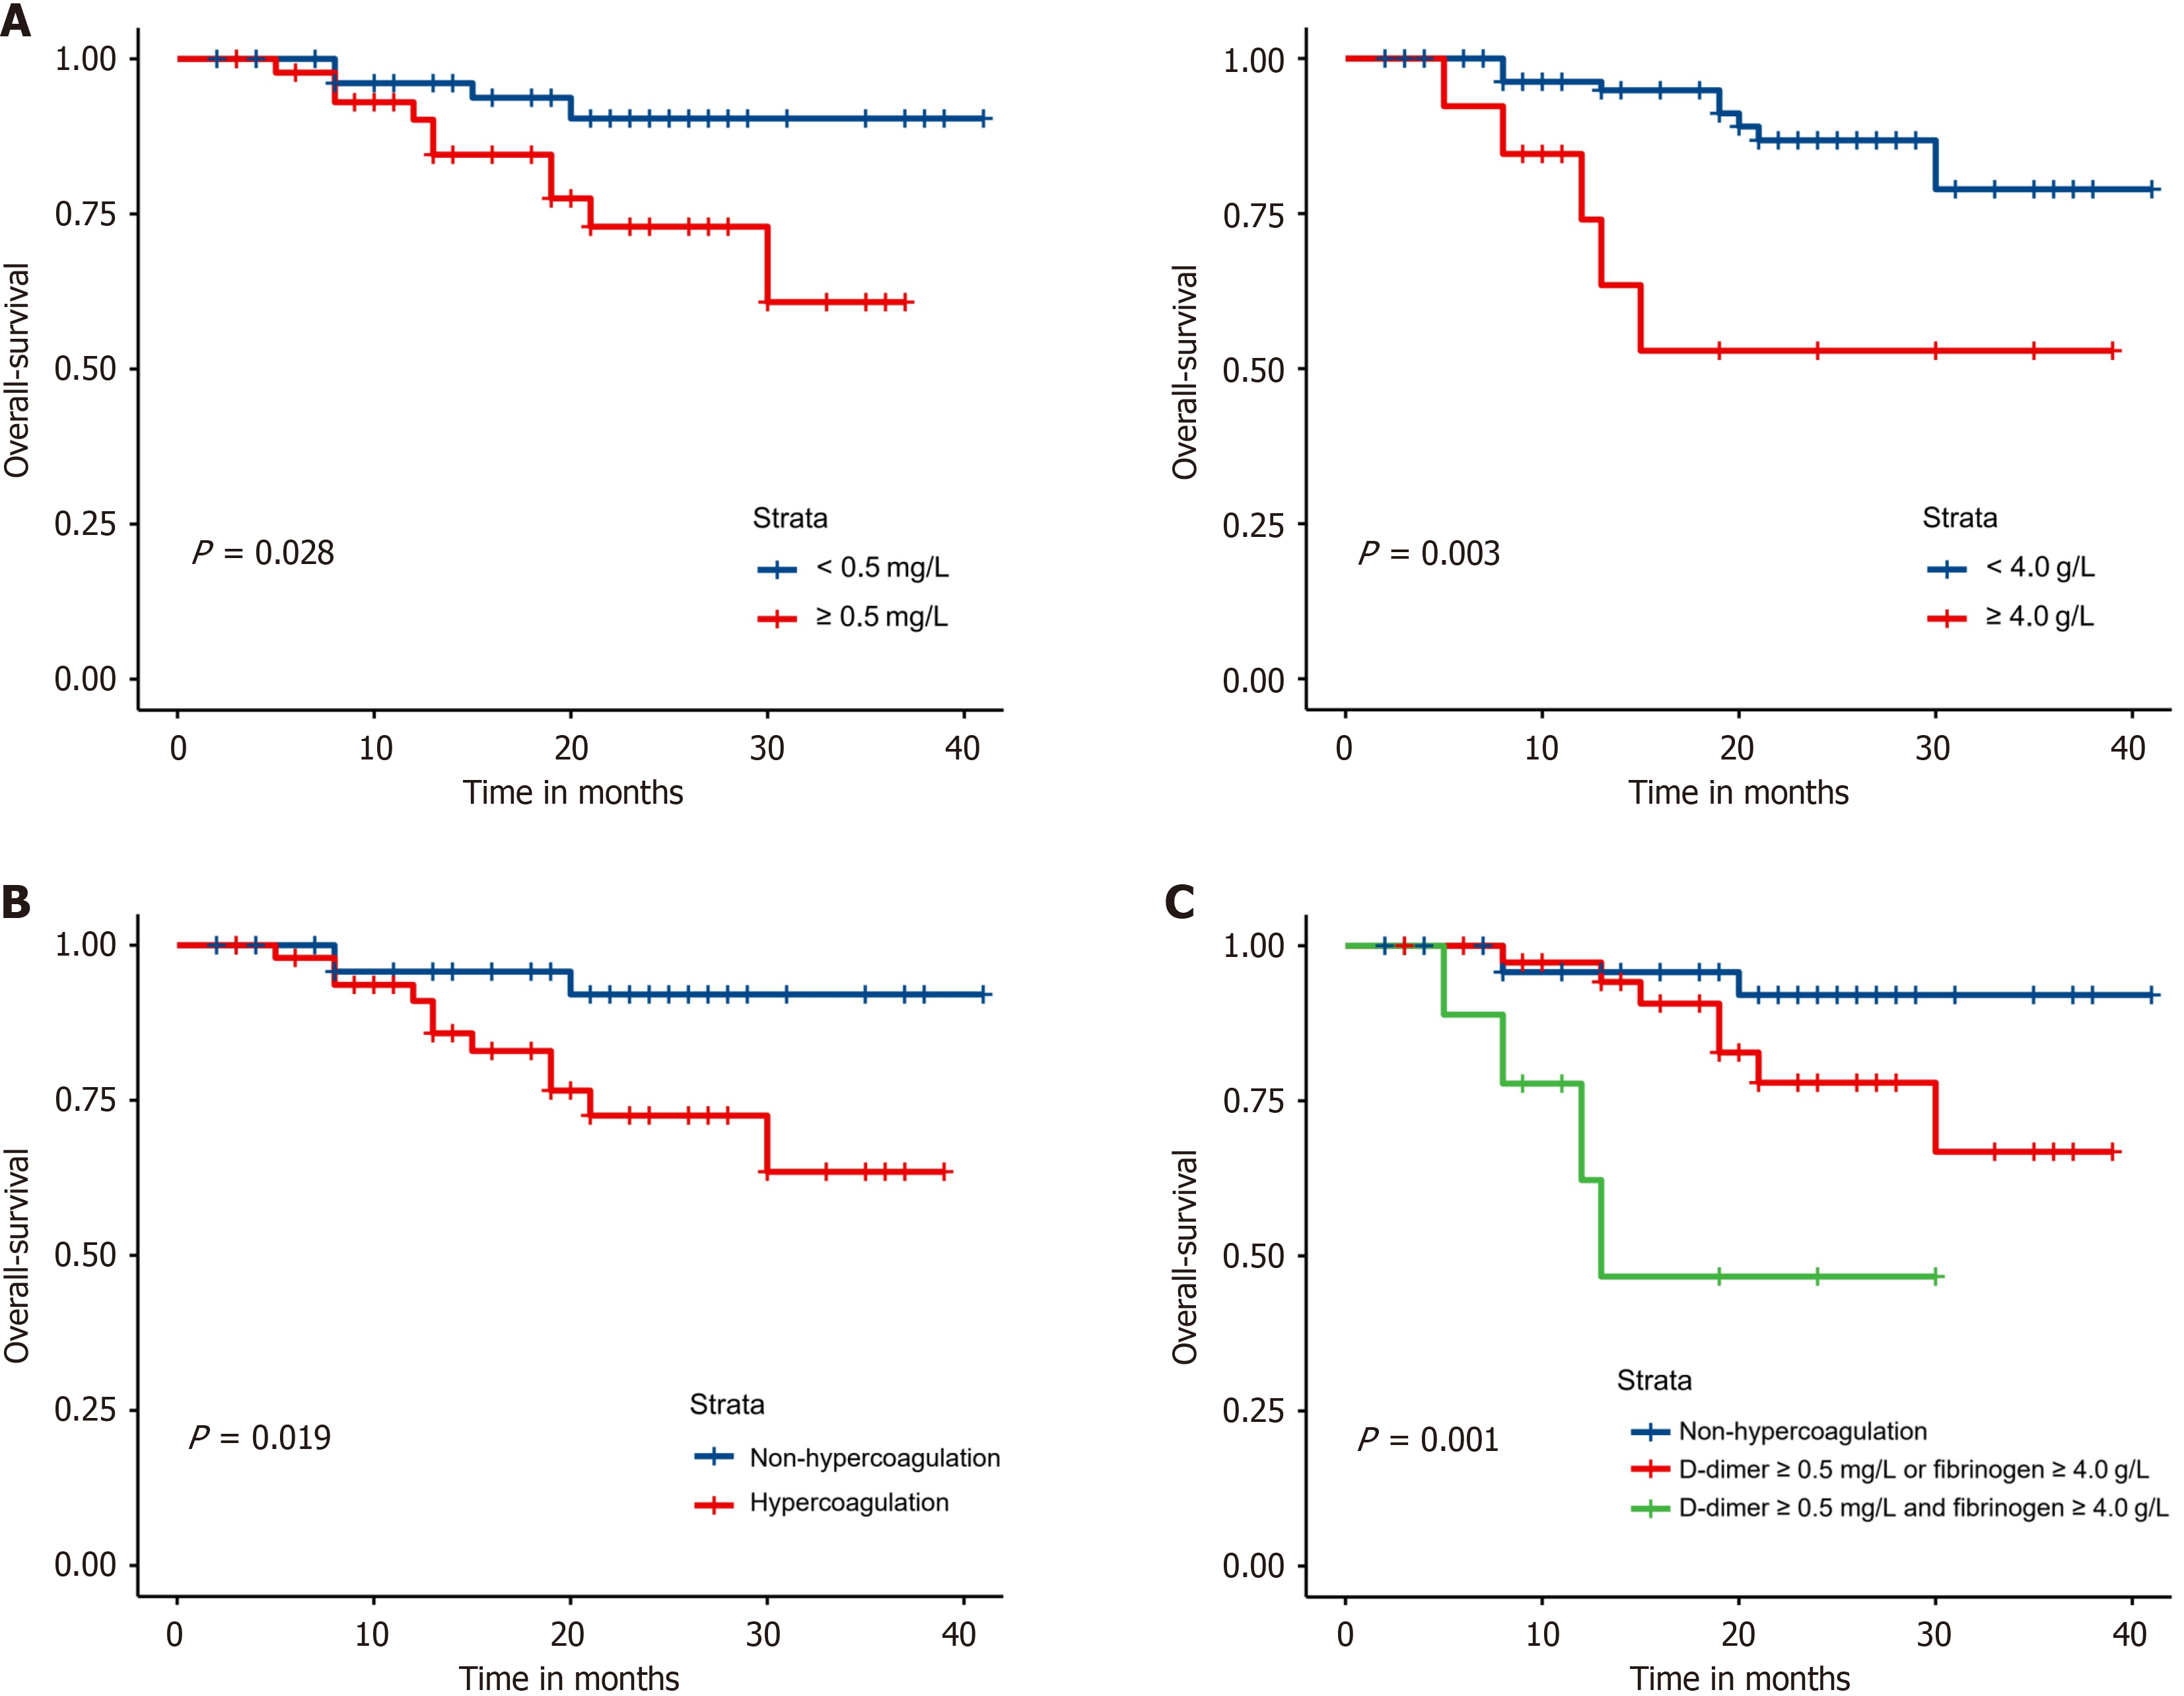
Figure 3 Comparison of overall survival according to preoperative coagulation factors.
A: Overall survival (OS) associated with preoperative plasma D-dimer and fibrinogen concentrations; B: Comparison of OS between preoperative hypercoagulation and non-hypercoagulation; C: Comparison among preoperative non-hypercoagulation, high concentrations of either (either elevated), and high concentrations of both (both elevated) after neoadjuvant immunochemotherapy.
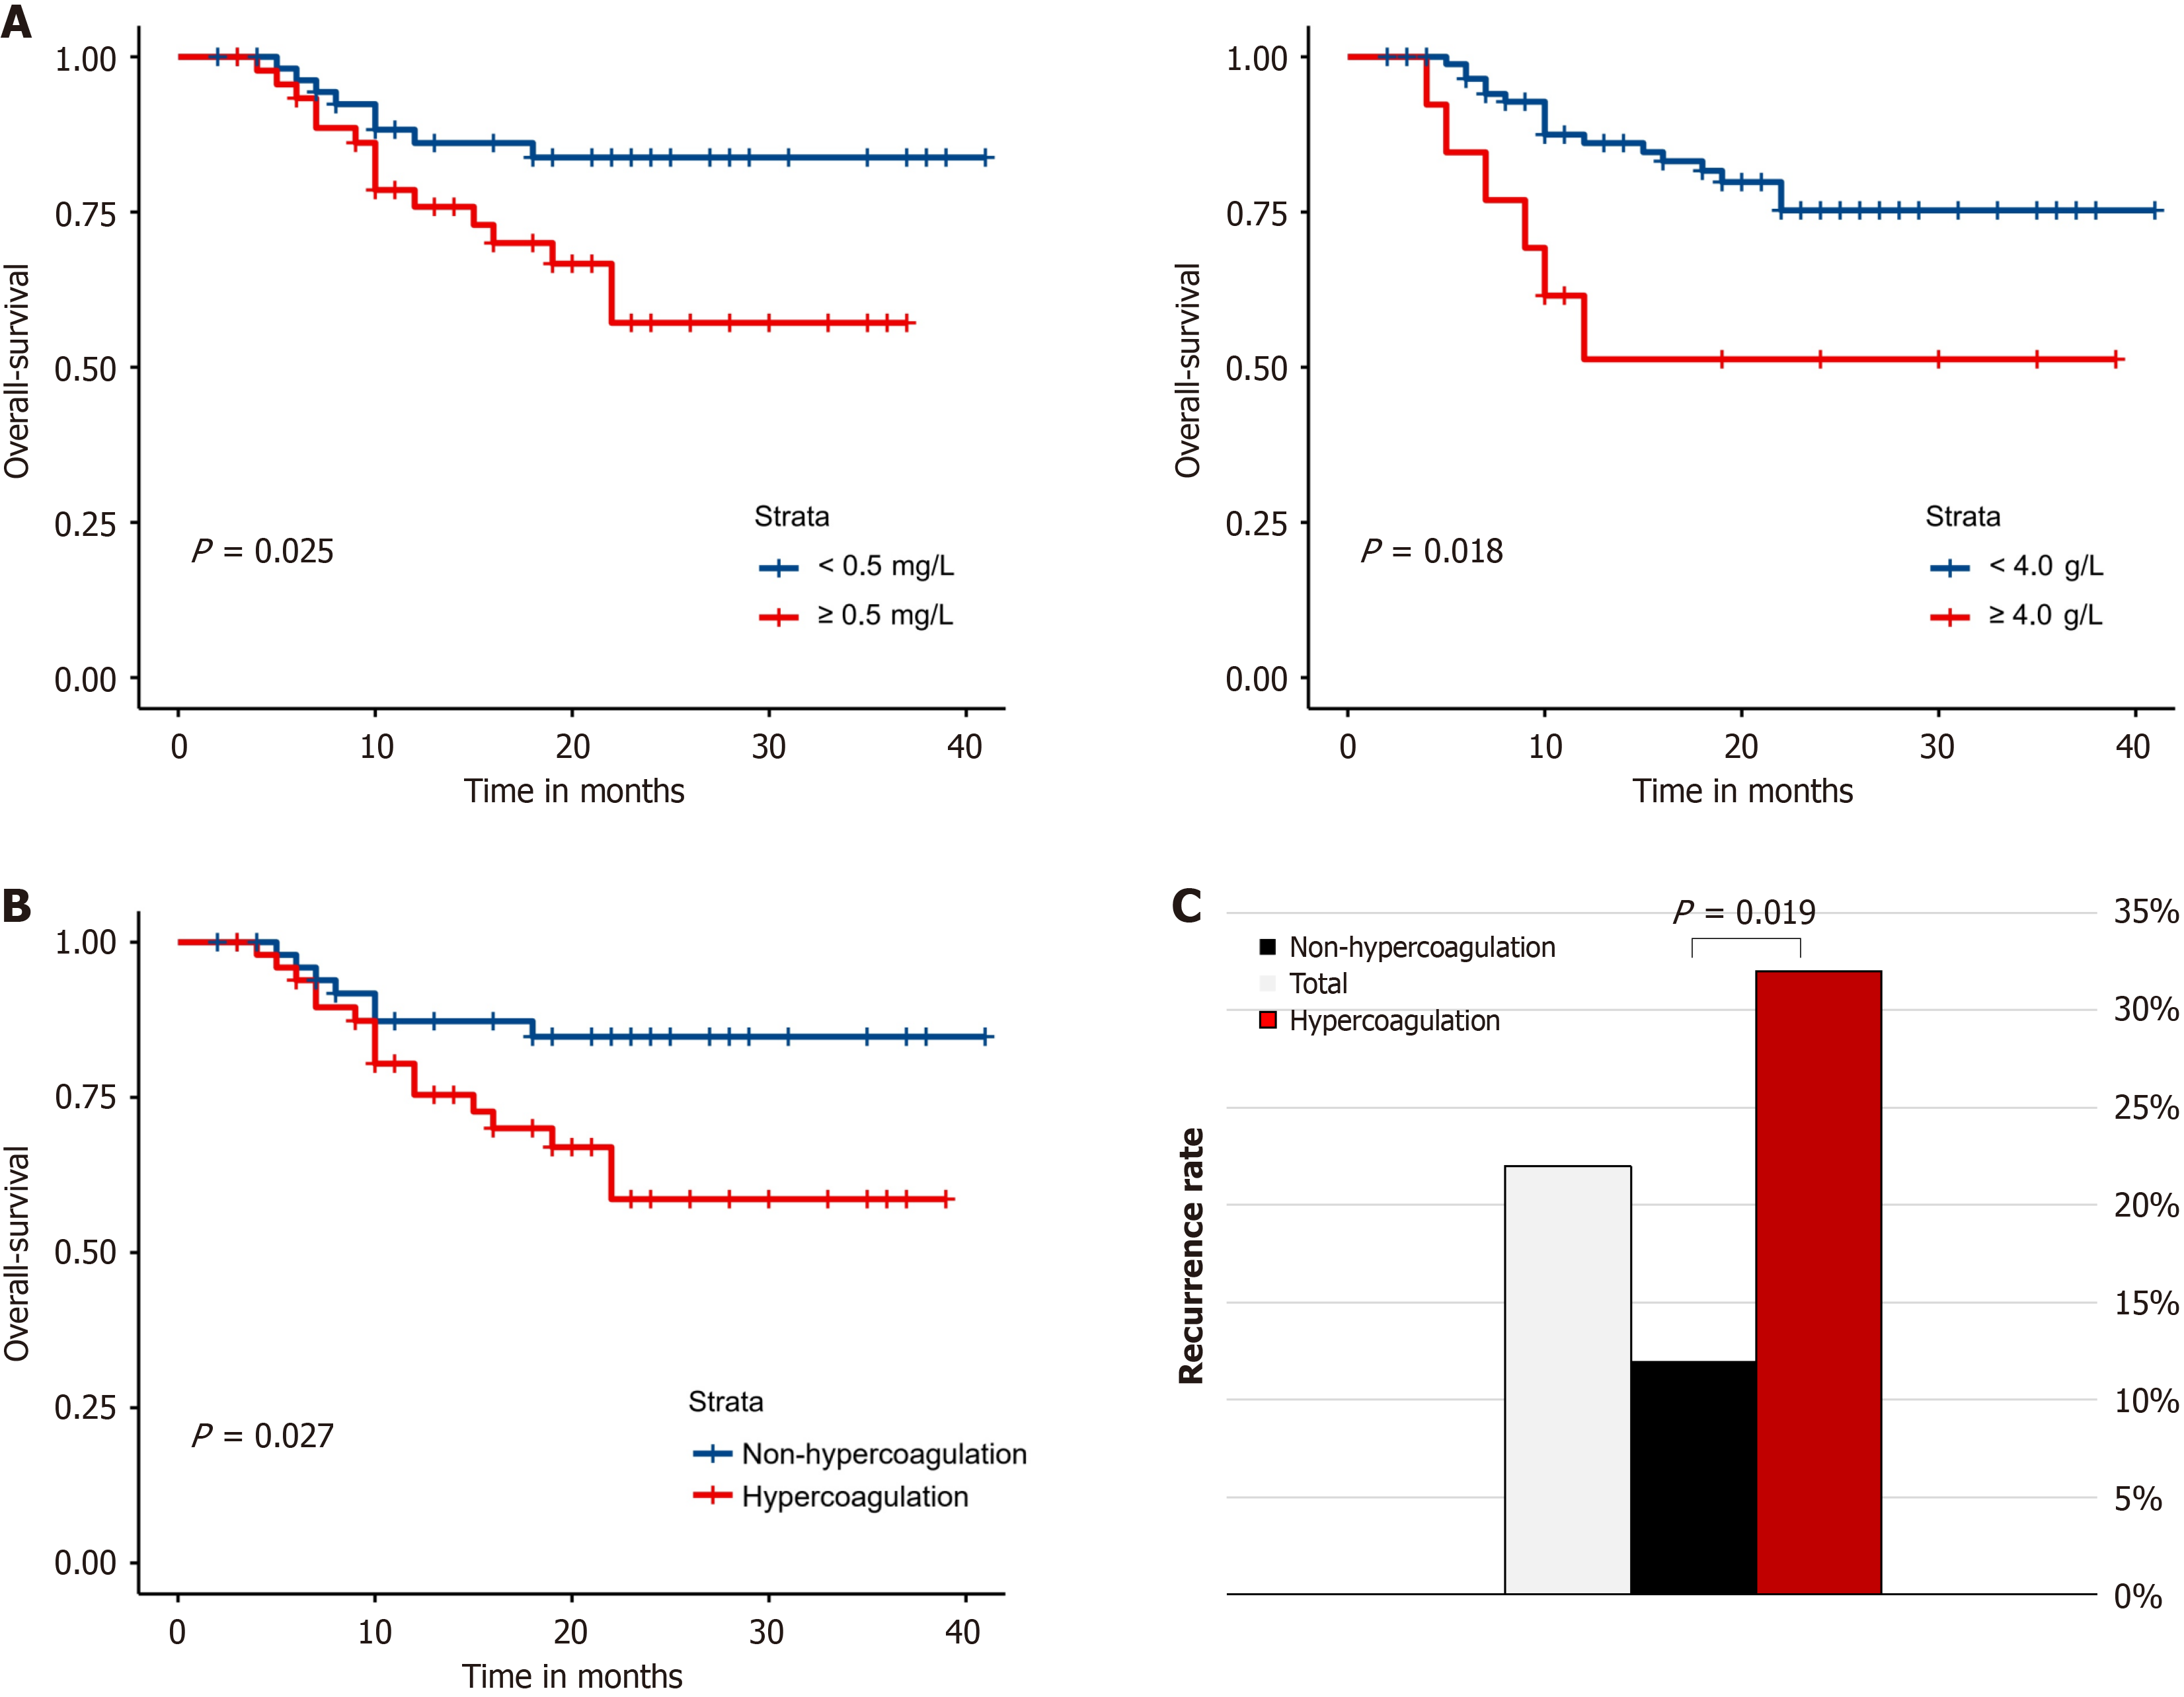
Figure 4 Comparison of recurrence according to levels of preoperative coagulation factors.
A: Disease-free survival (DFS) associated with preoperative D-dimer and fibrinogen concentrations; B: Comparison of DFS between hypercoagulation and non-hypercoagulation; C: Frequency of the recurrences in each coagulation group.
- Citation: Li TH, Sun X, Li CG, Yin YP, Tao KX. Hypercoagulation after neoadjuvant immunochemotherapy as a new prognostic indicator in patients with locally advanced gastric cancer undergoing surgery. World J Gastrointest Oncol 2025; 17(3): 100927
- URL: https://www.wjgnet.com/1948-5204/full/v17/i3/100927.htm
- DOI: https://dx.doi.org/10.4251/wjgo.v17.i3.100927


