©The Author(s) 2025.
World J Gastrointest Oncol. Feb 15, 2025; 17(2): 98808
Published online Feb 15, 2025. doi: 10.4251/wjgo.v17.i2.98808
Published online Feb 15, 2025. doi: 10.4251/wjgo.v17.i2.98808
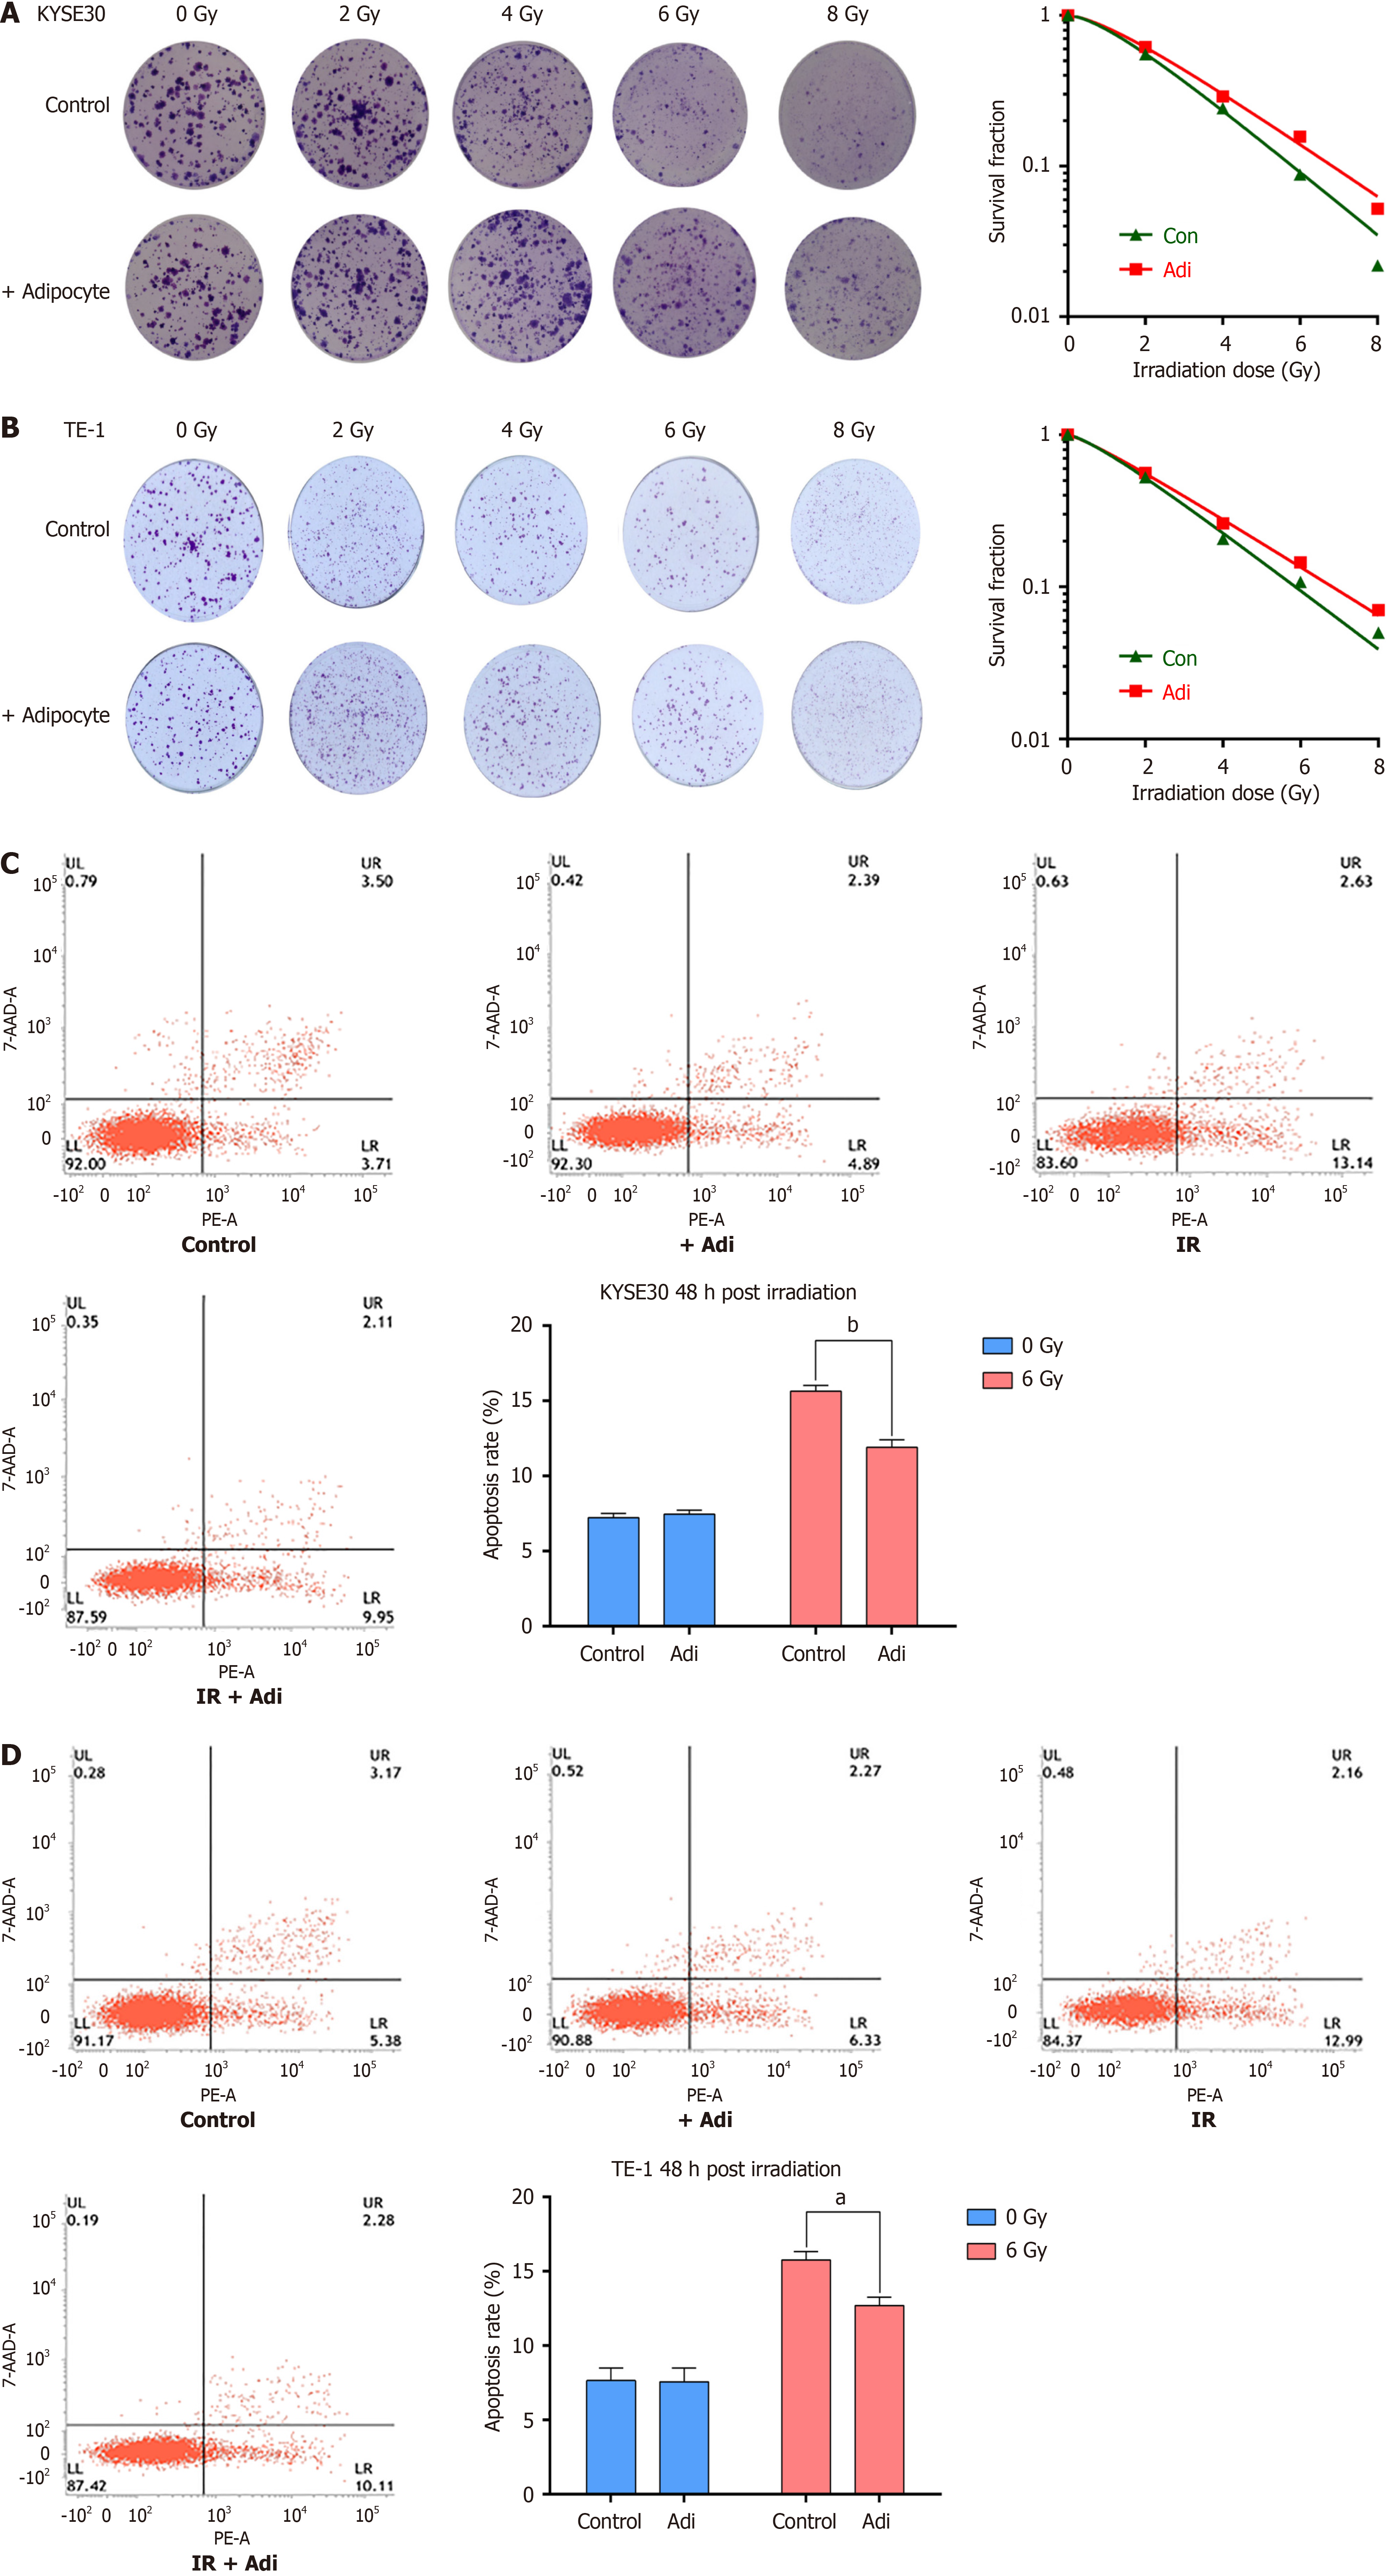
Figure 1 Adipocytes enhance the resistance of esophageal cancer cells to radiation therapy.
A: Representative images of colony formation and corresponding survival curves for KYSE30 cells; B: Representative images of colony formation and corresponding survival curves for TE-1 cells; C: Flow cytometry analysis of apoptosis in KYSE30 cells; D: Flow cytometry analysis of apoptosis in TE-1 cells. Live cells are located in the lower left quadrant, early apoptotic cells in the lower right quadrant, and late apoptotic cells in the upper right quadrant. The total number of apoptotic cells includes both early and late apoptotic cells, and the apoptosis rates of KYSE30 and TE-1 cells were evaluated. Mean values from three independent experiments are presented and analyzed using the t-test. aP < 0.01; bP < 0.001.
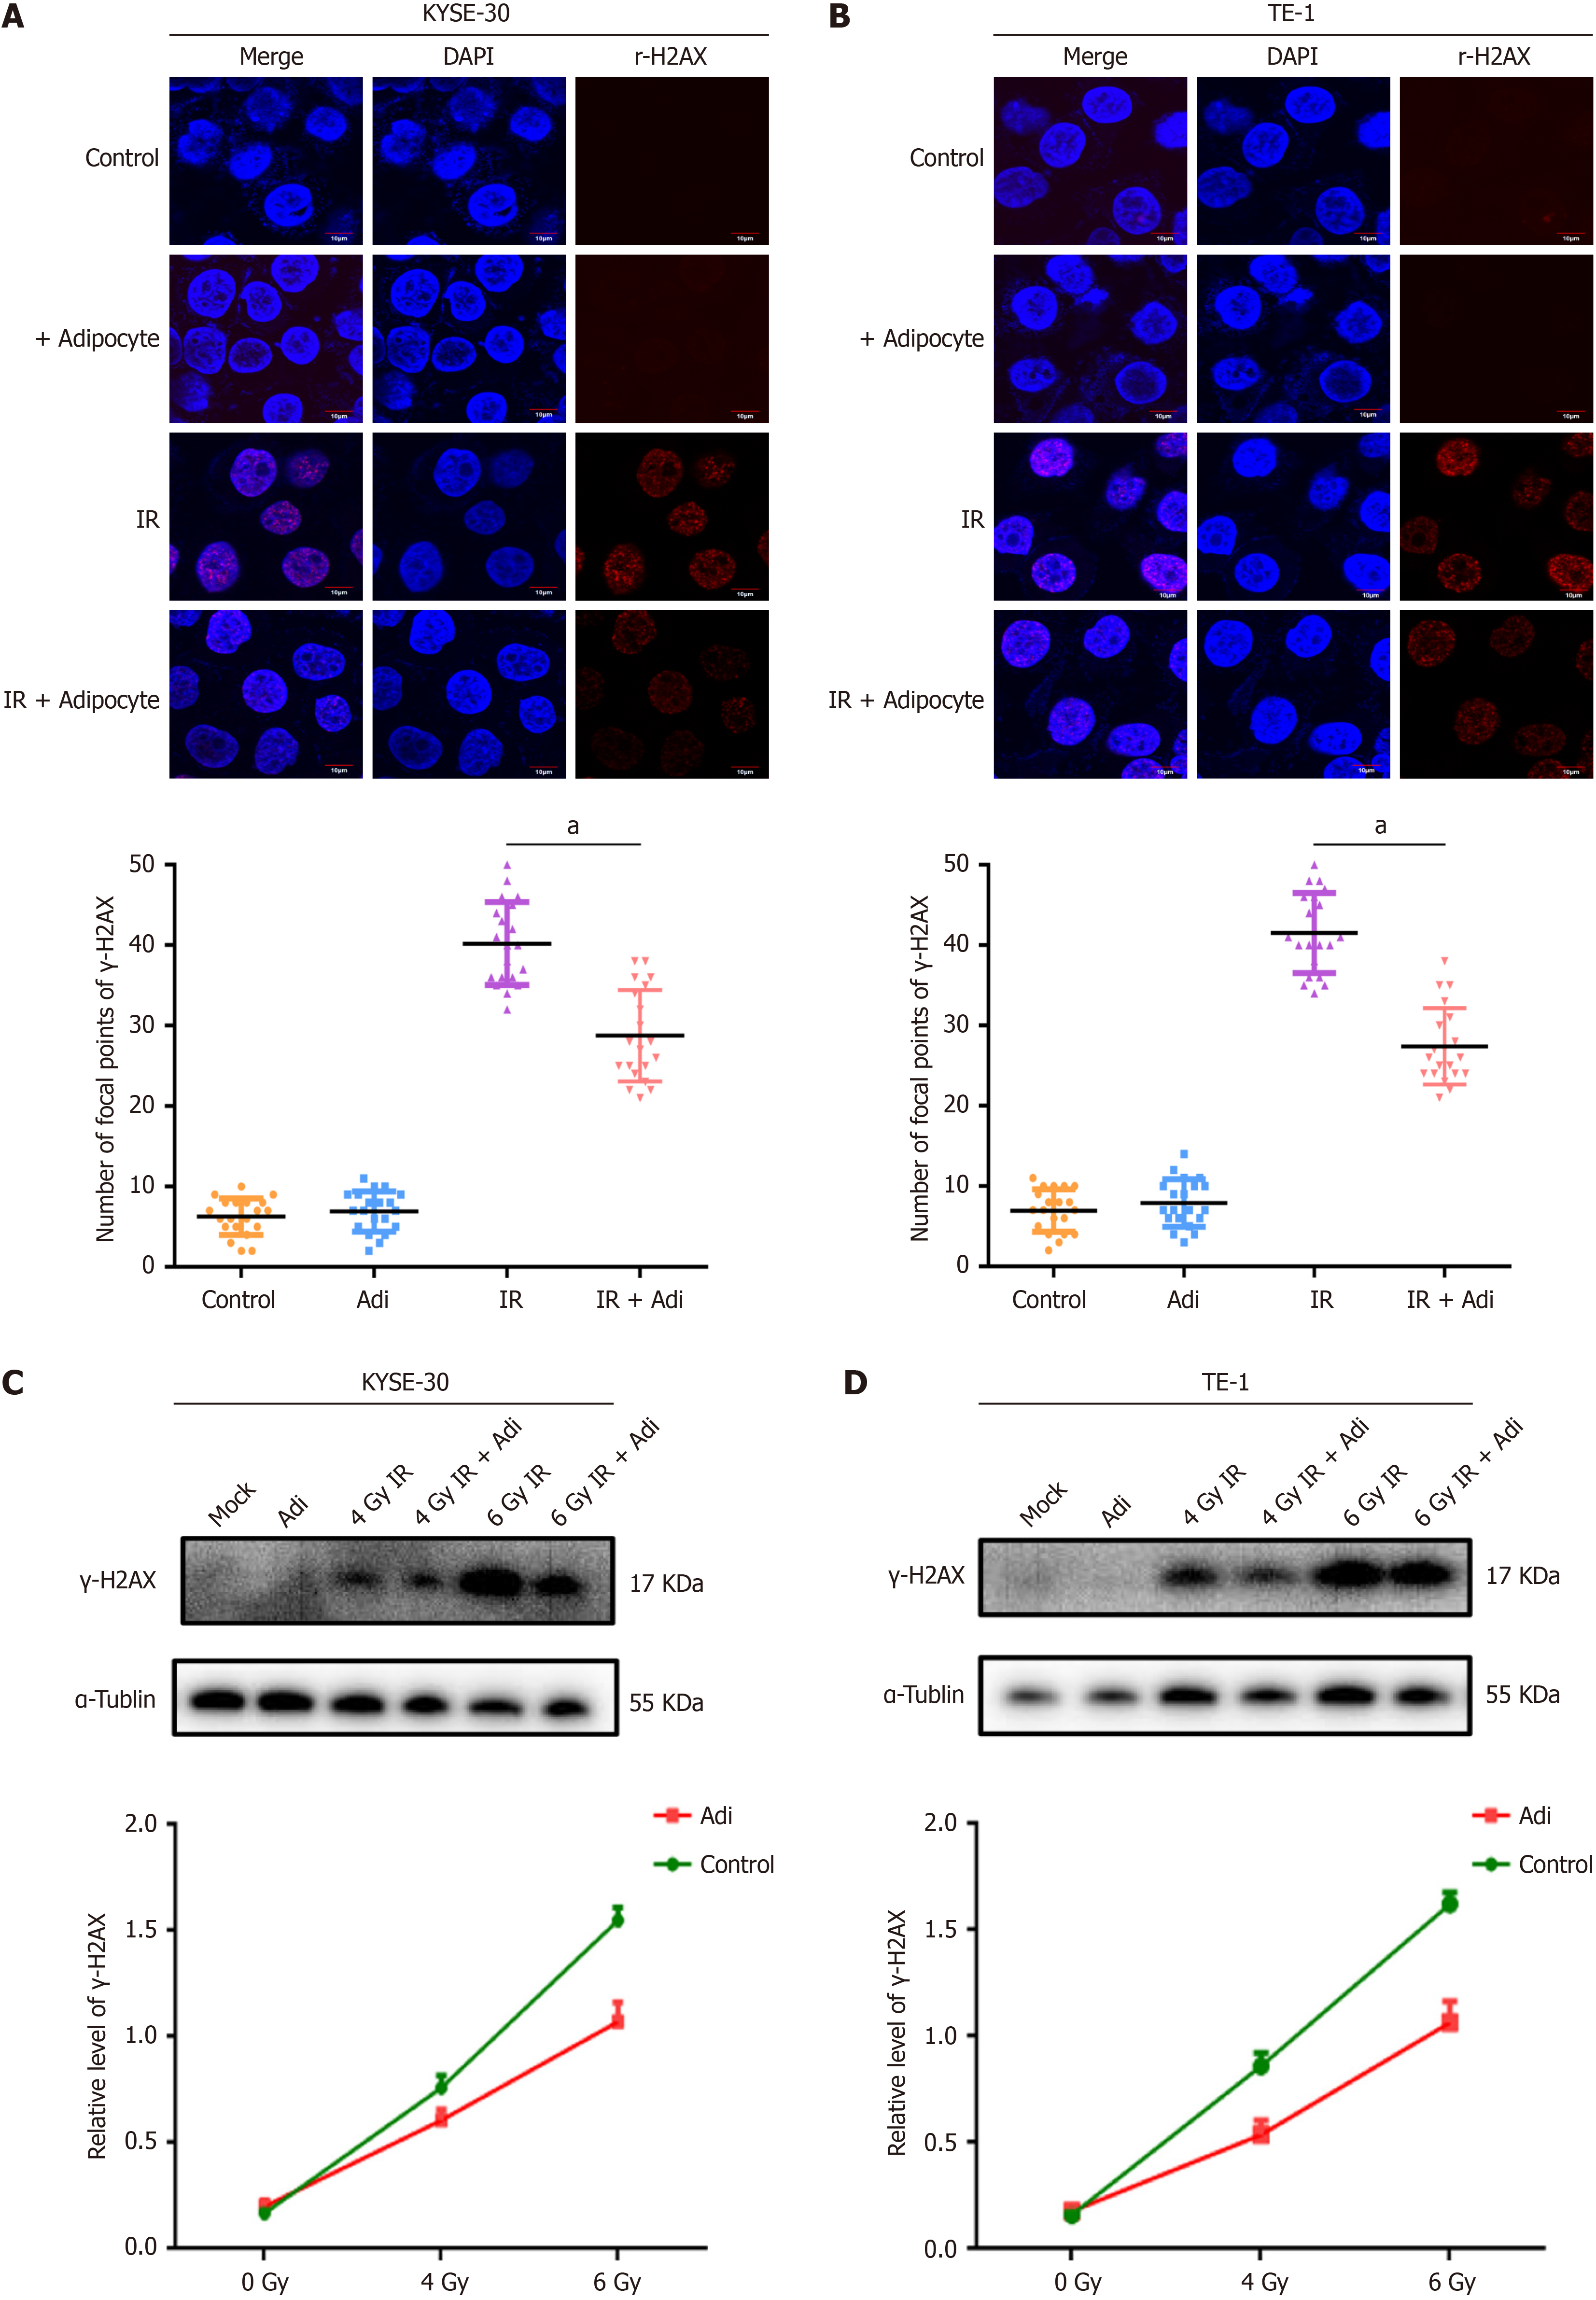
Figure 2 The confocal immunofluorescence staining images of KYSE30 and TE-1 cells (γ-H2AX labeled in red and nuclear staining in blue).
A: KYSE30; B: TE-1 cells. Quantitative analysis of γ-H2AX foci numbers is presented in a scatter plot (aP < 0.01); C and D: Results of Western blot analysis showing γ-H2AX protein levels in KYSE30 (C) and TE-1 cells (D) co-cultured with adipocytes and exposed to radiation, compared to the control group that received only irradiation.
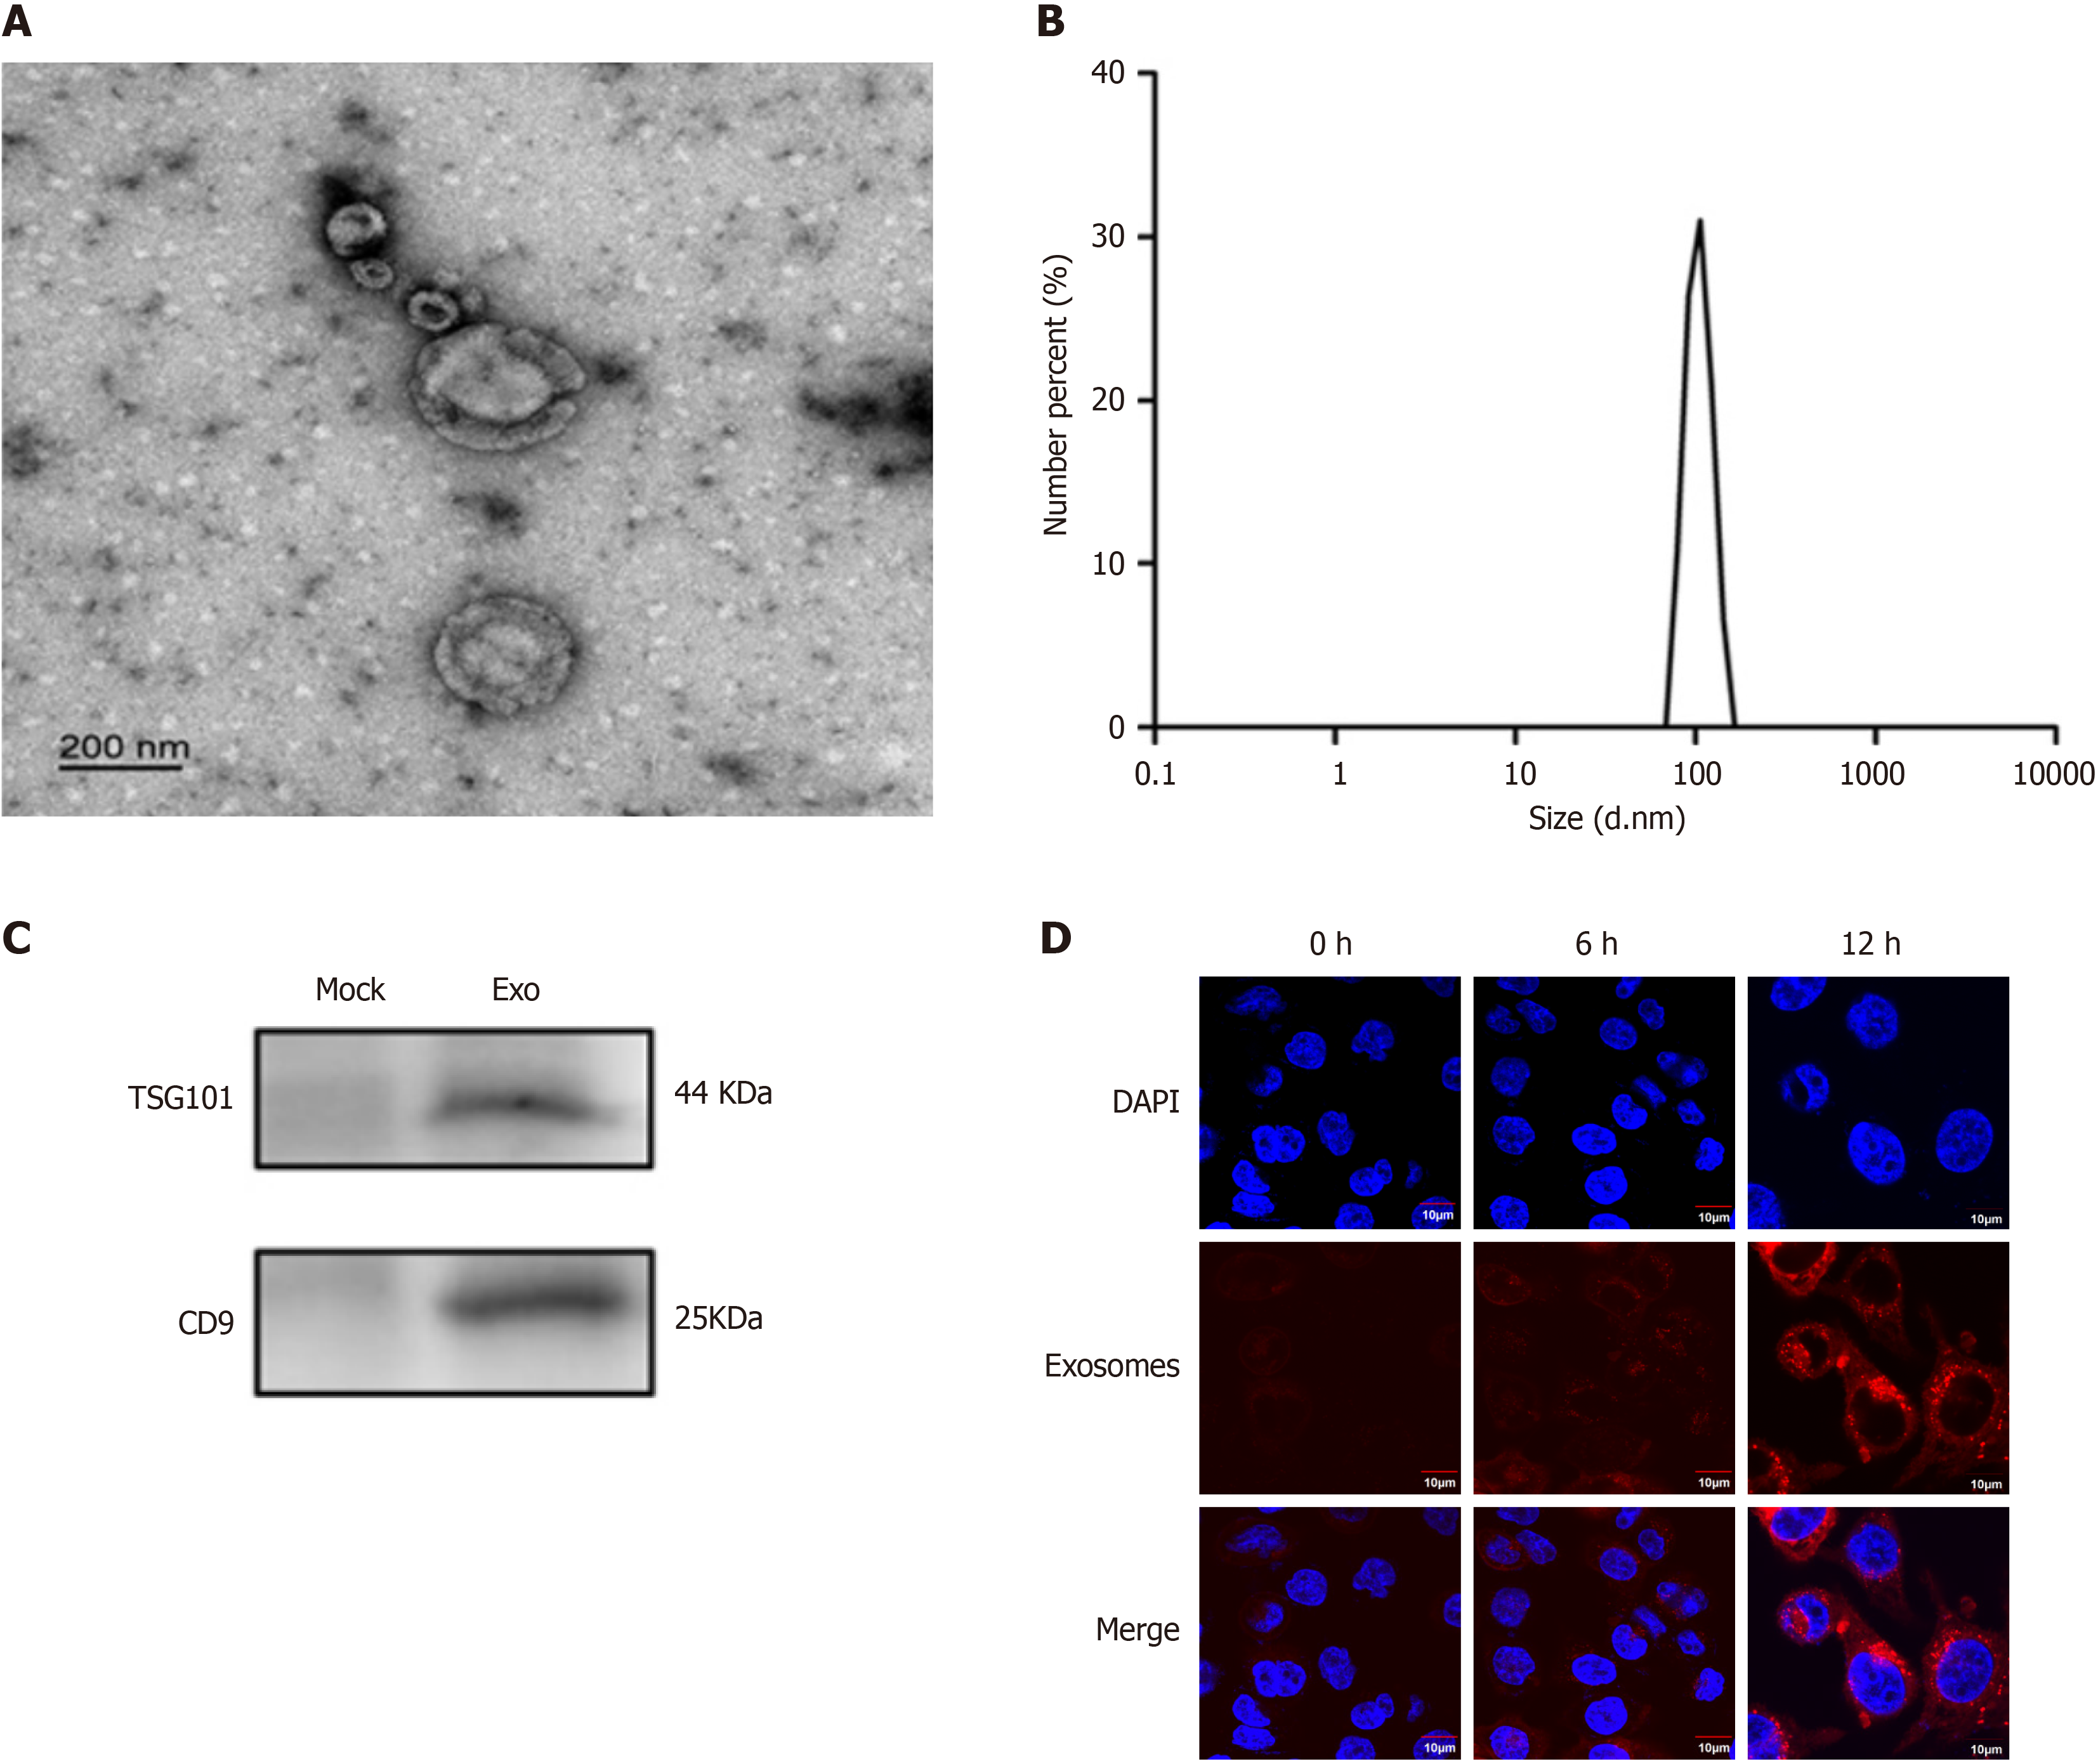
Figure 3 Characterization of extracted exosomes.
A: Transmission electron microscopy image of exosomes (scale bar = 100 nm); B: Nanoparticle tracking analysis of exosome concentration and size; C: Western blot detection of exosomal-specific markers TSG101 and CD9; D: Uptake of exosomes by KYSE30 cells.
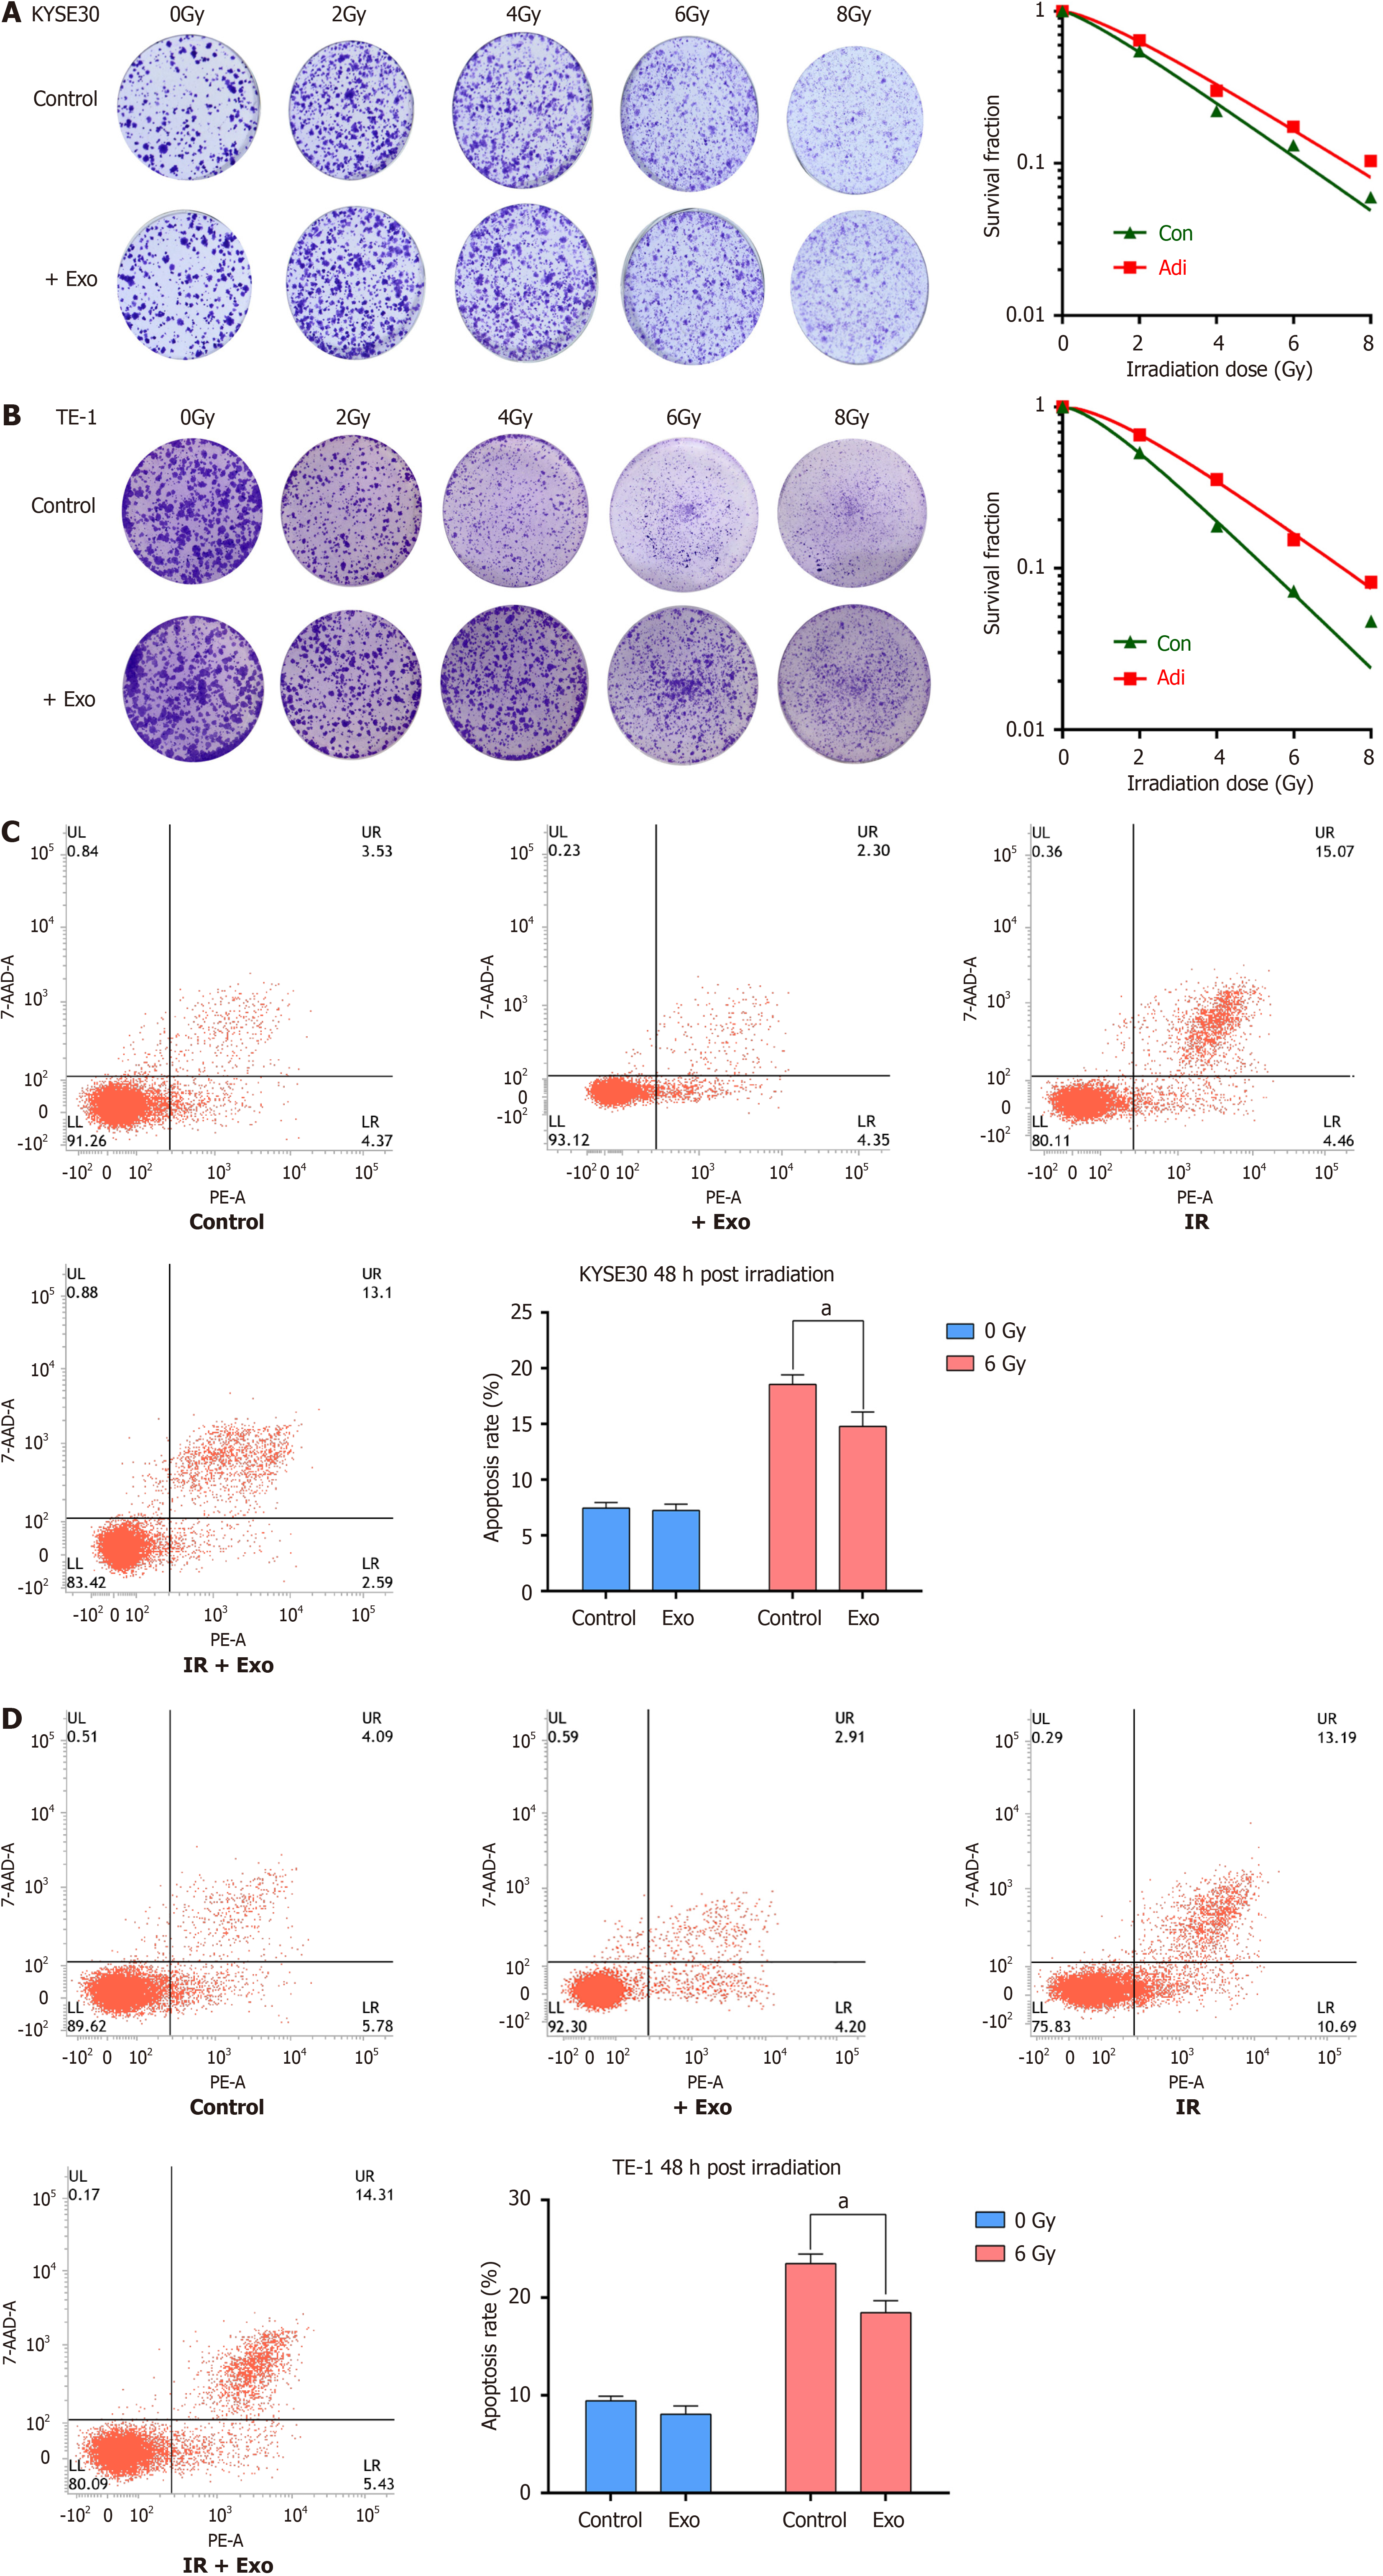
Figure 4 Radiation response and apoptosis in esophageal squamous cell carcinoma cells.
A and B: Radiation response and corresponding survival curves of the colony formation assay for KYSE30 (A) and TE-1 (B) cells; C and D: Flow cytometry analysis of apoptosis in KYSE30 (C) and TE-1 (D) cells, with the lower left quadrant representing live cells, the lower right quadrant representing early apoptosis, and the upper right quadrant representing late apoptosis. Accumulative cell apoptosis includes both early and late stages. Mean values from three independent experiments are presented and analyzed using the t-test. aP < 0.01.
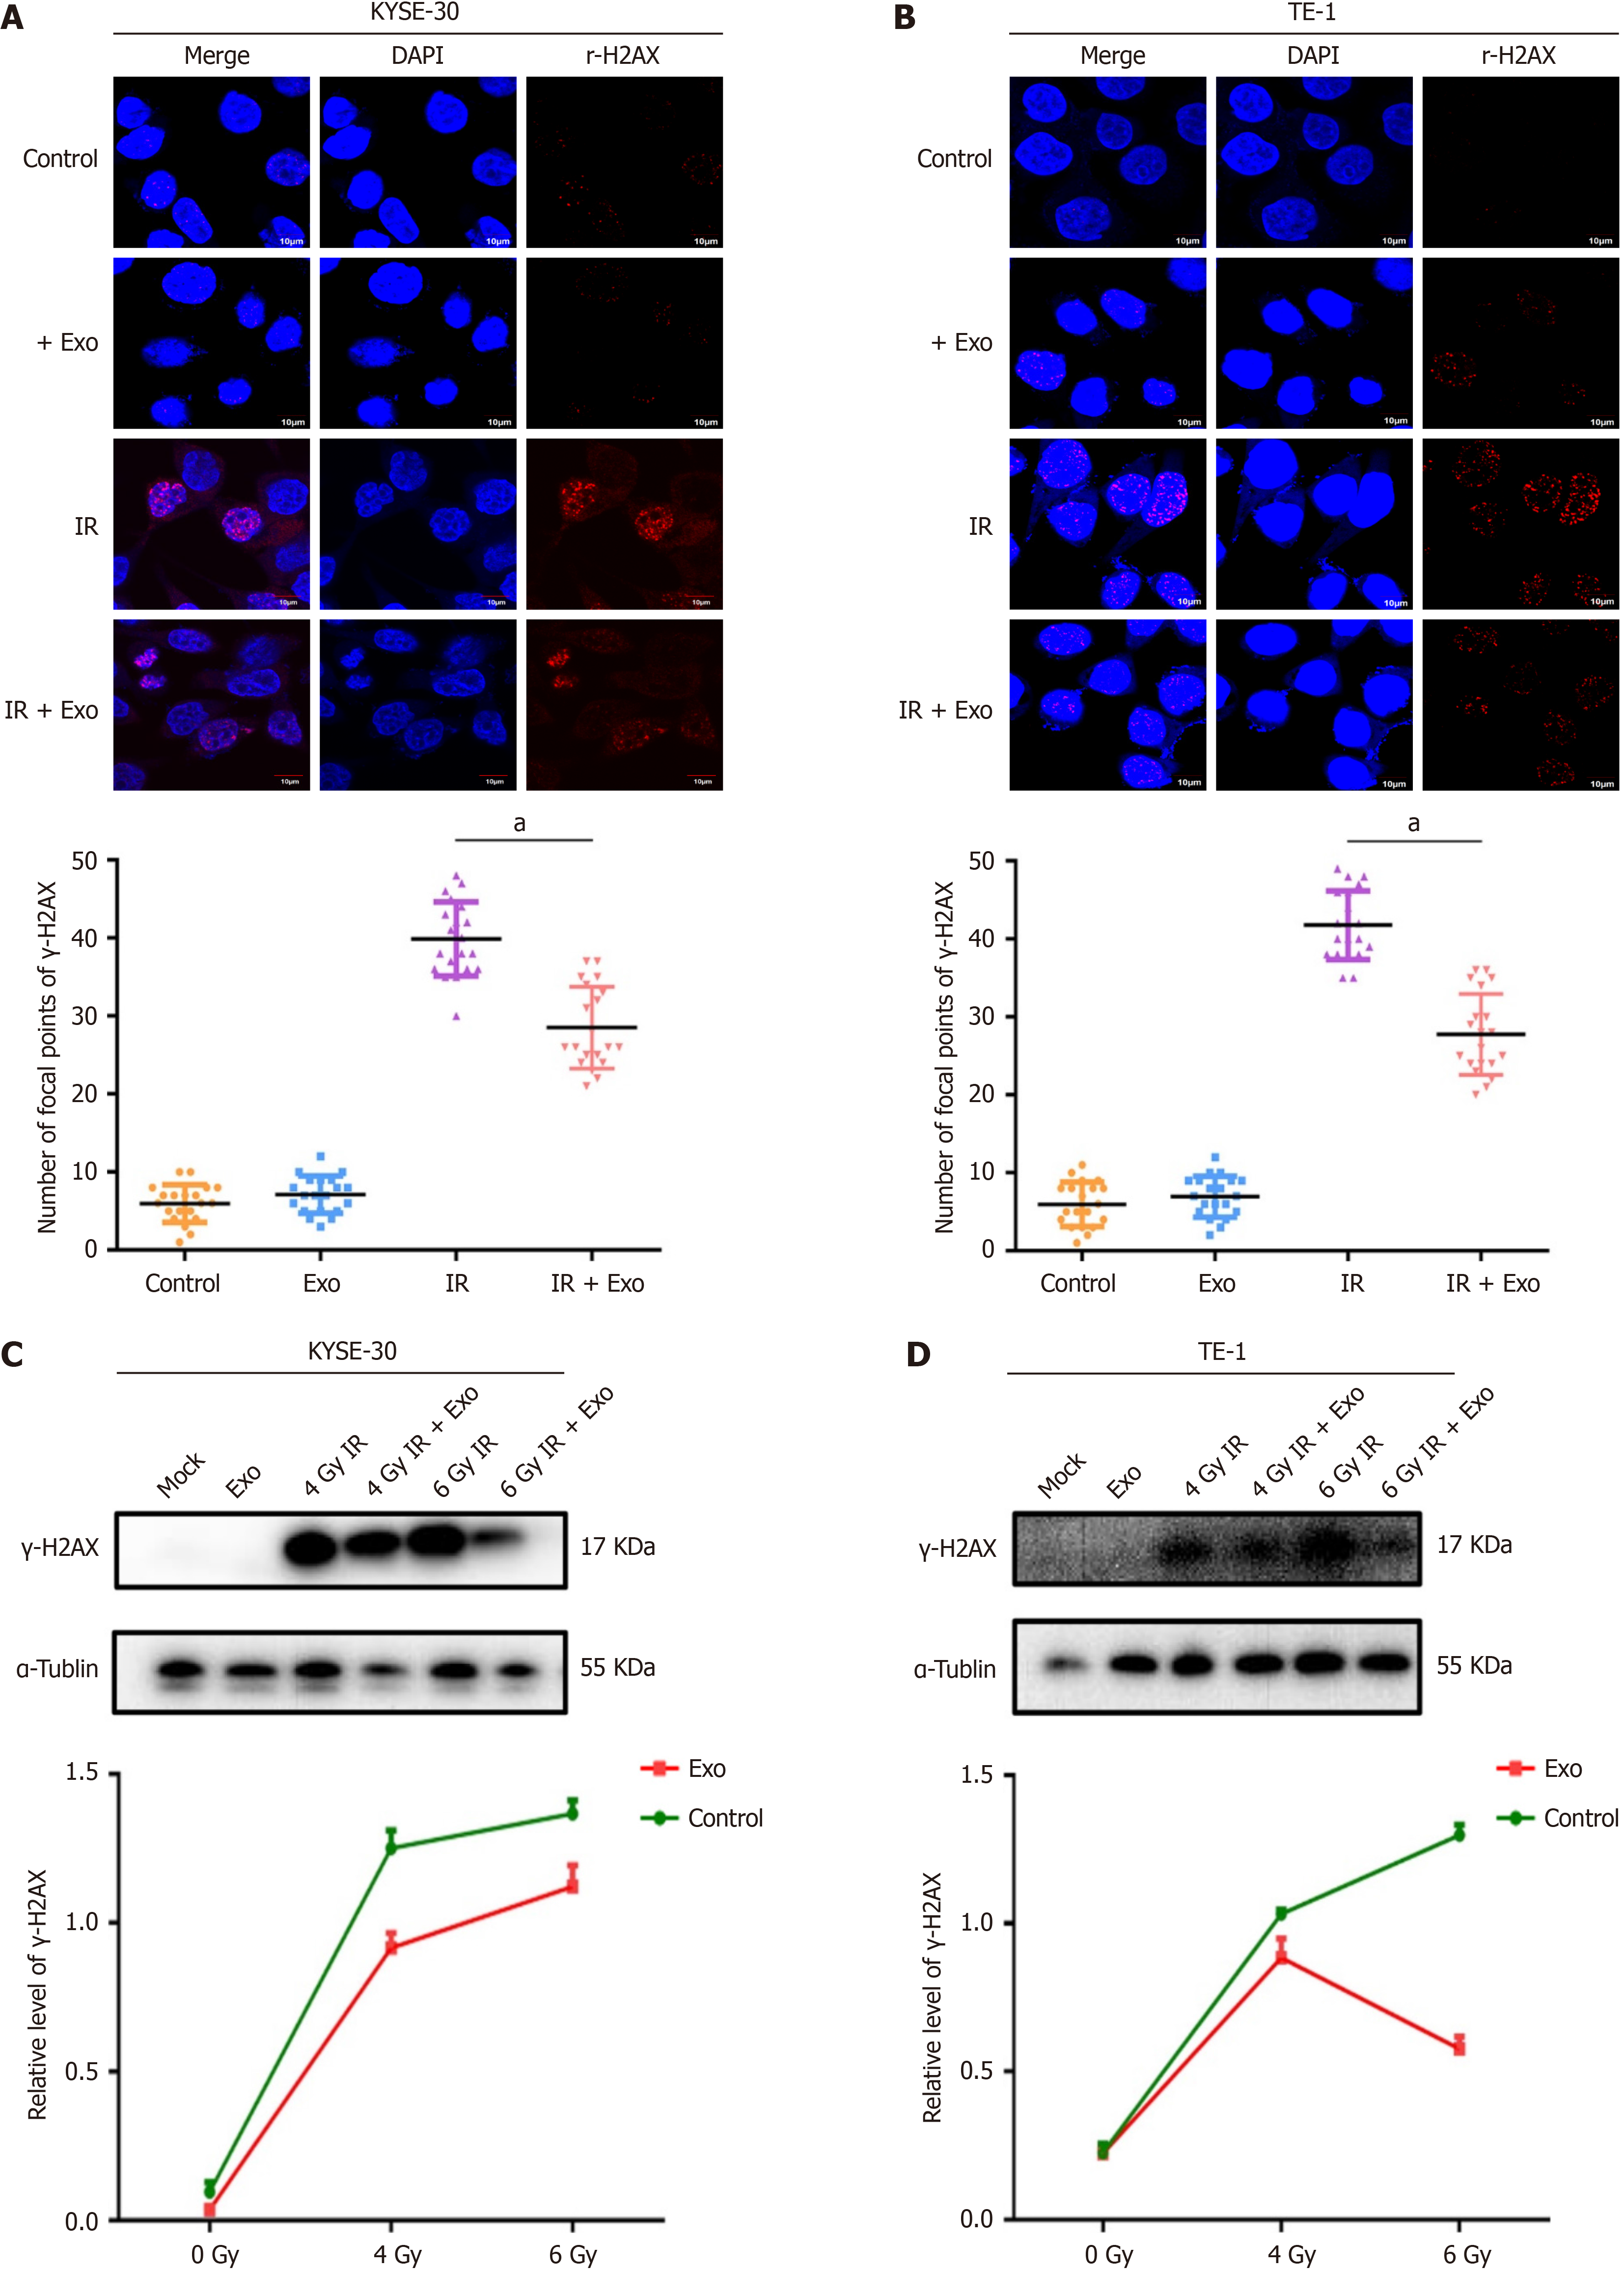
Figure 5 DNA damage in esophageal squamous cell carcinoma cells after radiation.
A: Co-localization immunofluorescence staining of KYSE30; B: TE-1 cells, (γ-H2AX in red and nuclear staining in blue). Scatter plot of quantitative analysis of γ-H2AX foci number (aP < 0.01); C and D: Western blot analysis of γ-H2AX protein levels in irradiated KYSE30 (C) and TE-1 (D) cells, respectively.
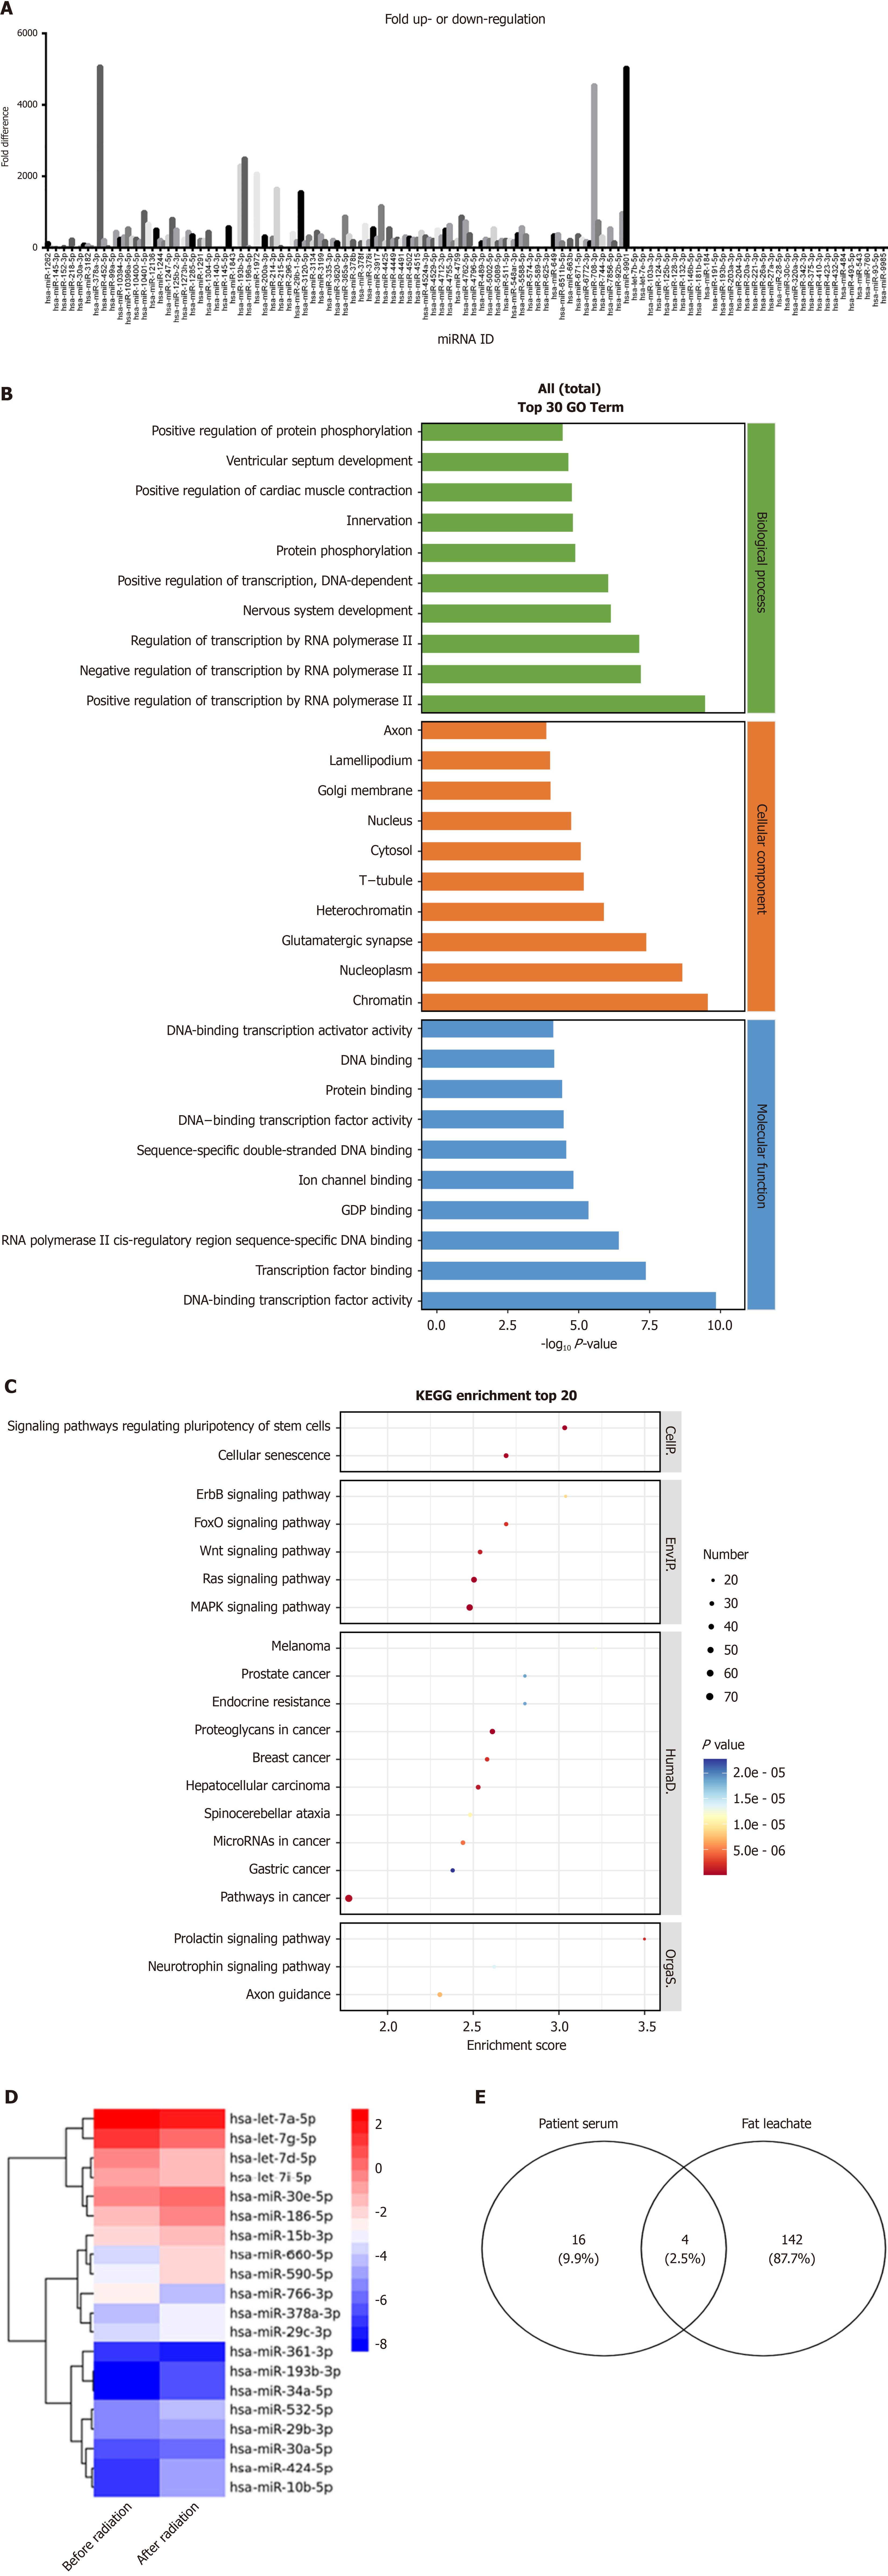
Figure 6 Next-generation sequencing analysis of miRNA expression.
A: Differential expression of miRNAs in adipocyte-derived exosomes; B: Gene Ontology analysis of differentially expressed miRNAs in serum-derived exosomes; C: Kyoto Encyclopedia of Genes and Genomes analysis of differentially expressed miRNAs in serum-derived exosomes; D: Heat map of differentially expressed miRNAs in serum-derived exosomes from esophageal cancer patients before and after radiotherapy; E: Venn diagram illustrating overlapping differentially expressed miRNAs in adipocyte-derived exosomes and serum-derived exosomes from esophageal cancer patients before and after radiotherapy.
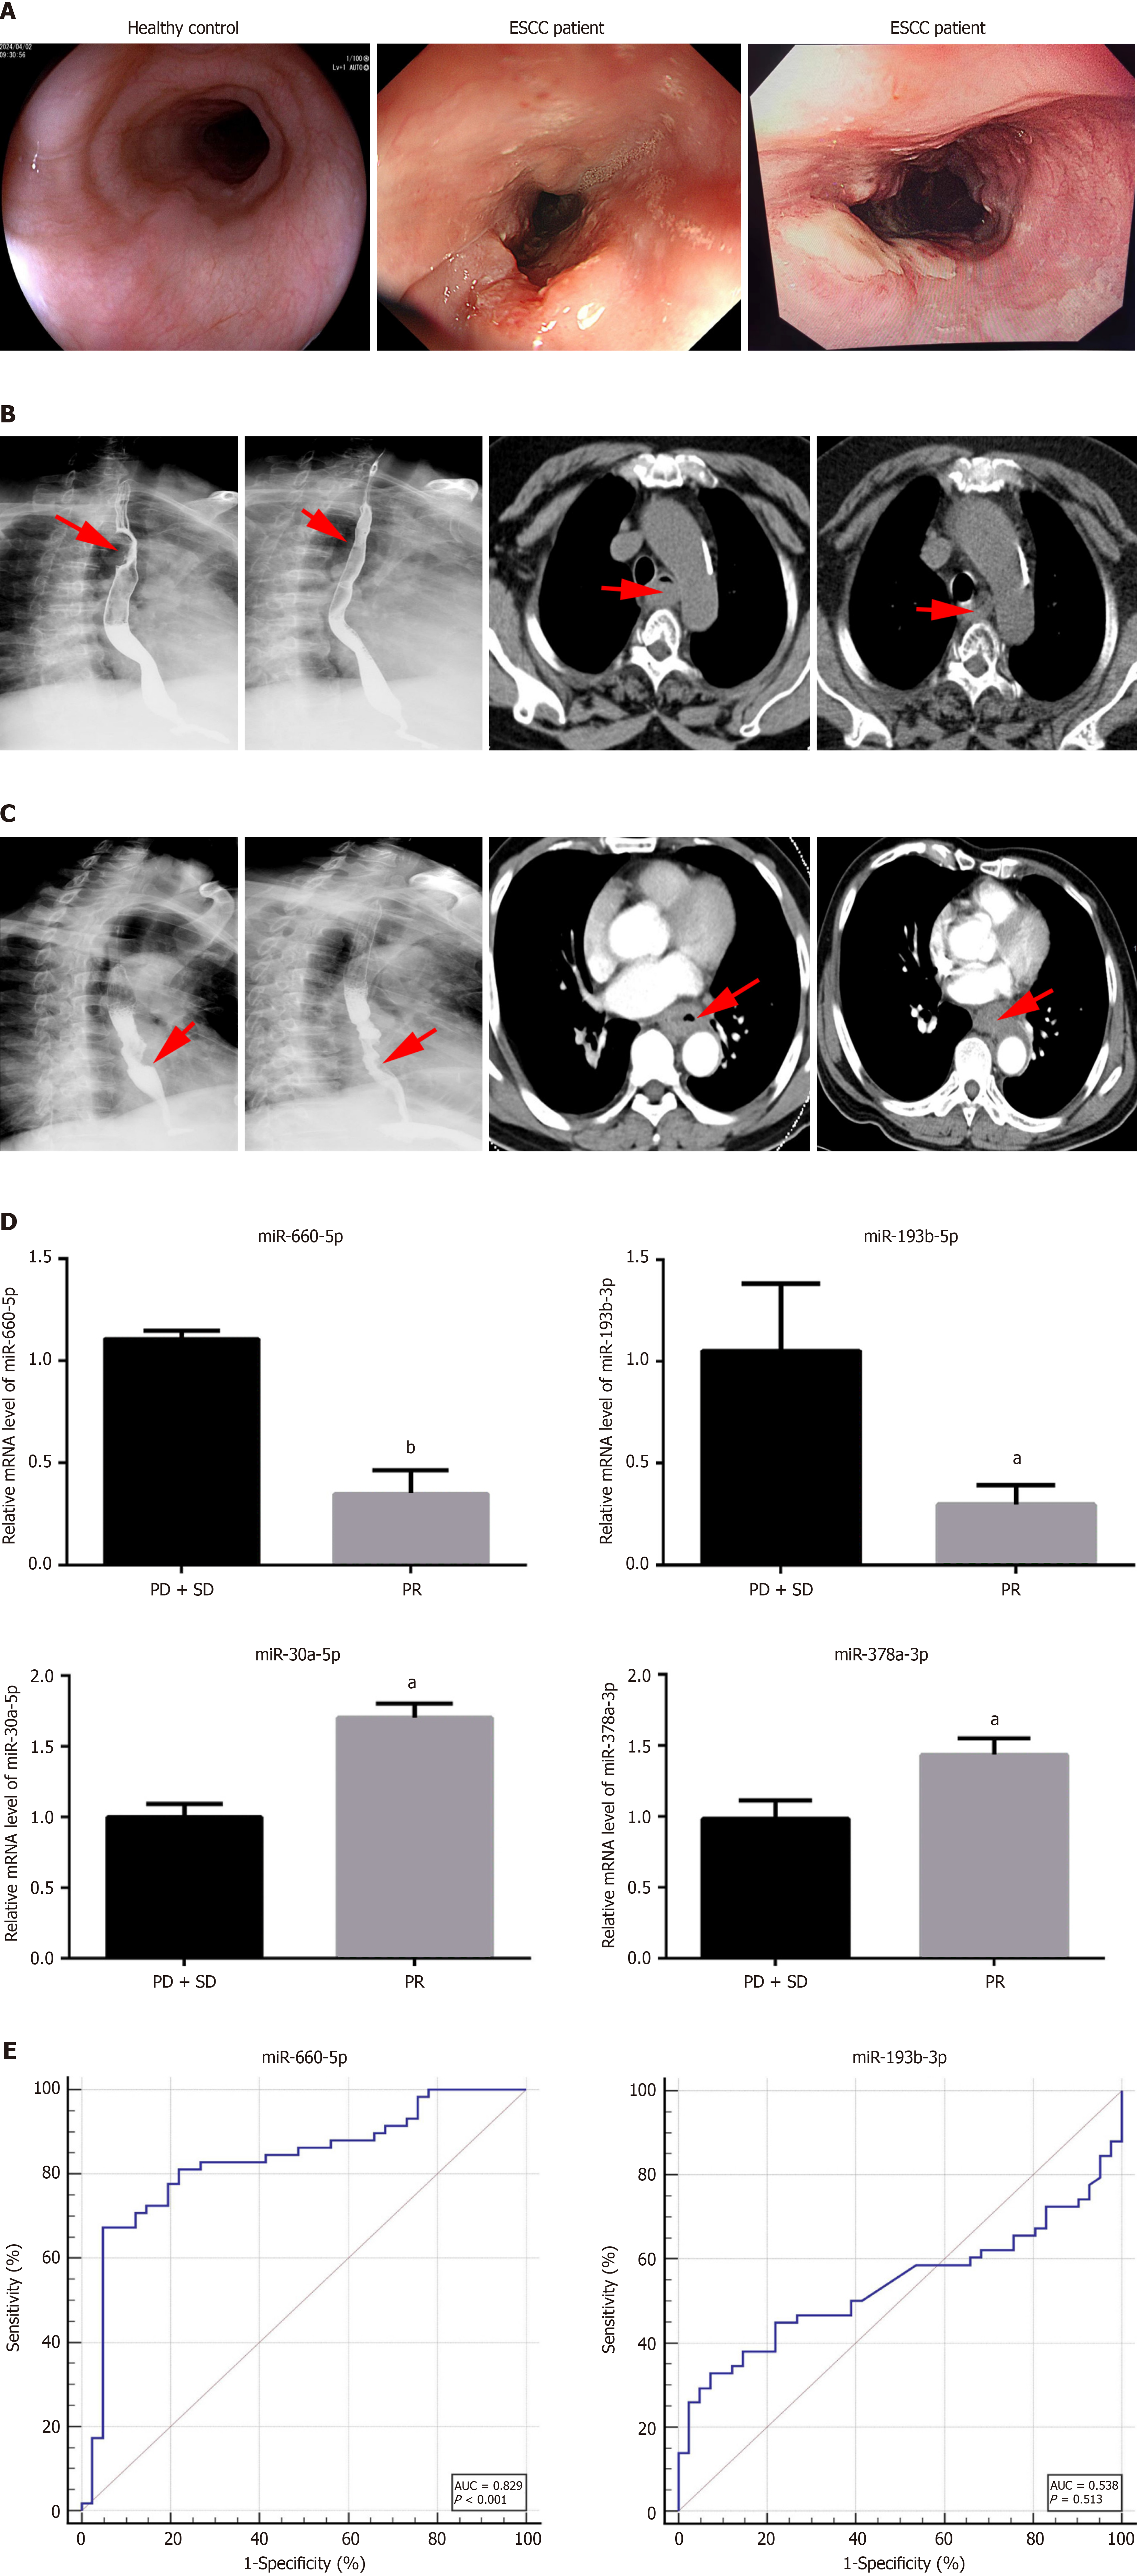
Figure 7 Exo-miR-660-5p as a potential biomarker for predicting radiotherapeutic efficacy in esophageal squamous cell carcinoma.
A: Representative findings of Controls and patients with esophageal squamous cell carcinoma (ESCC); B: Esophageal and computed tomography (CT) examination findings before and after radiotherapy in responsive esophageal cancer patients; C: Esophageal and CT examination findings before and after radiotherapy in non-responsive esophageal cancer patients; D: Real-time quantitative polymerase chain reaction validation of selected miRNAs. Four upregulated miRNAs (miR-30a-5p, miR-378a-3p, miR-193b-3p, miR-660-5p) were validated in the sample set. MiR-193b-3p and miR-660-5p showed significant differential expression (aP < 0.05; bP < 0.01); E: Receiver operating characteristic curve analysis to assess the predictive ability of miR-193b-3p and miR-660-5p for radiochemotherapy sensitivity in ESCC. Serum exosomal miR-660-5p exhibited a statistically significant difference, suggesting its potential role as a biomarker for predicting radiotherapy sensitivity in ESCC. ESCC: Esophageal squamous cell carcinoma.
- Citation: Ge YY, Xia XC, Wu AQ, Ma CY, Yu LH, Zhou JY. Identifying adipocyte-derived exosomal miRNAs as potential novel prognostic markers for radiotherapy of esophageal squamous cell carcinoma. World J Gastrointest Oncol 2025; 17(2): 98808
- URL: https://www.wjgnet.com/1948-5204/full/v17/i2/98808.htm
- DOI: https://dx.doi.org/10.4251/wjgo.v17.i2.98808


