Copyright
©The Author(s) 2025.
World J Gastrointest Oncol. Oct 15, 2025; 17(10): 111971
Published online Oct 15, 2025. doi: 10.4251/wjgo.v17.i10.111971
Published online Oct 15, 2025. doi: 10.4251/wjgo.v17.i10.111971
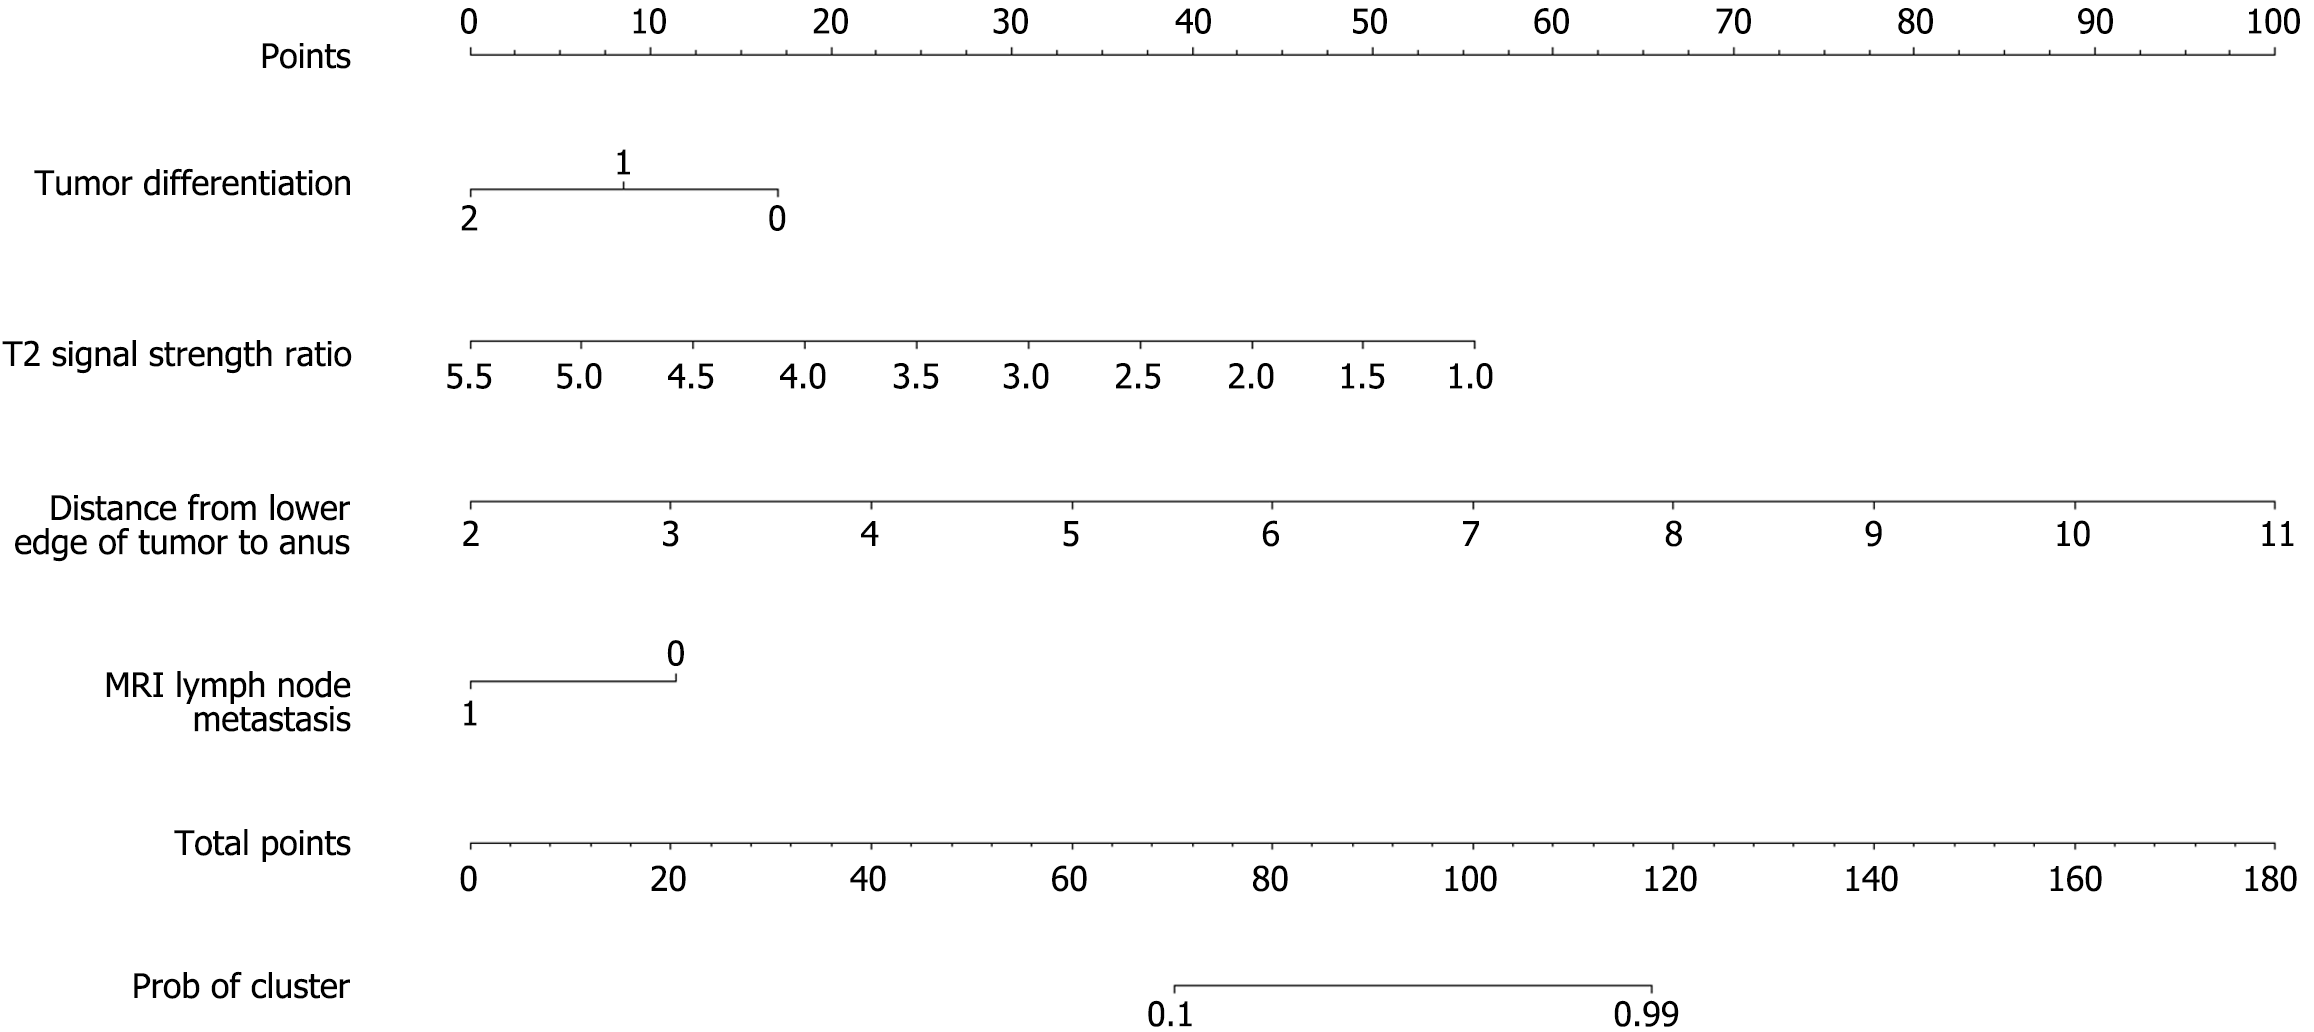
Figure 1 Nomogram model for quantifying efficacy of chemotherapy in patients with colorectal cancer carrying gene mutations.
MRI: Magnetic resonance imaging.
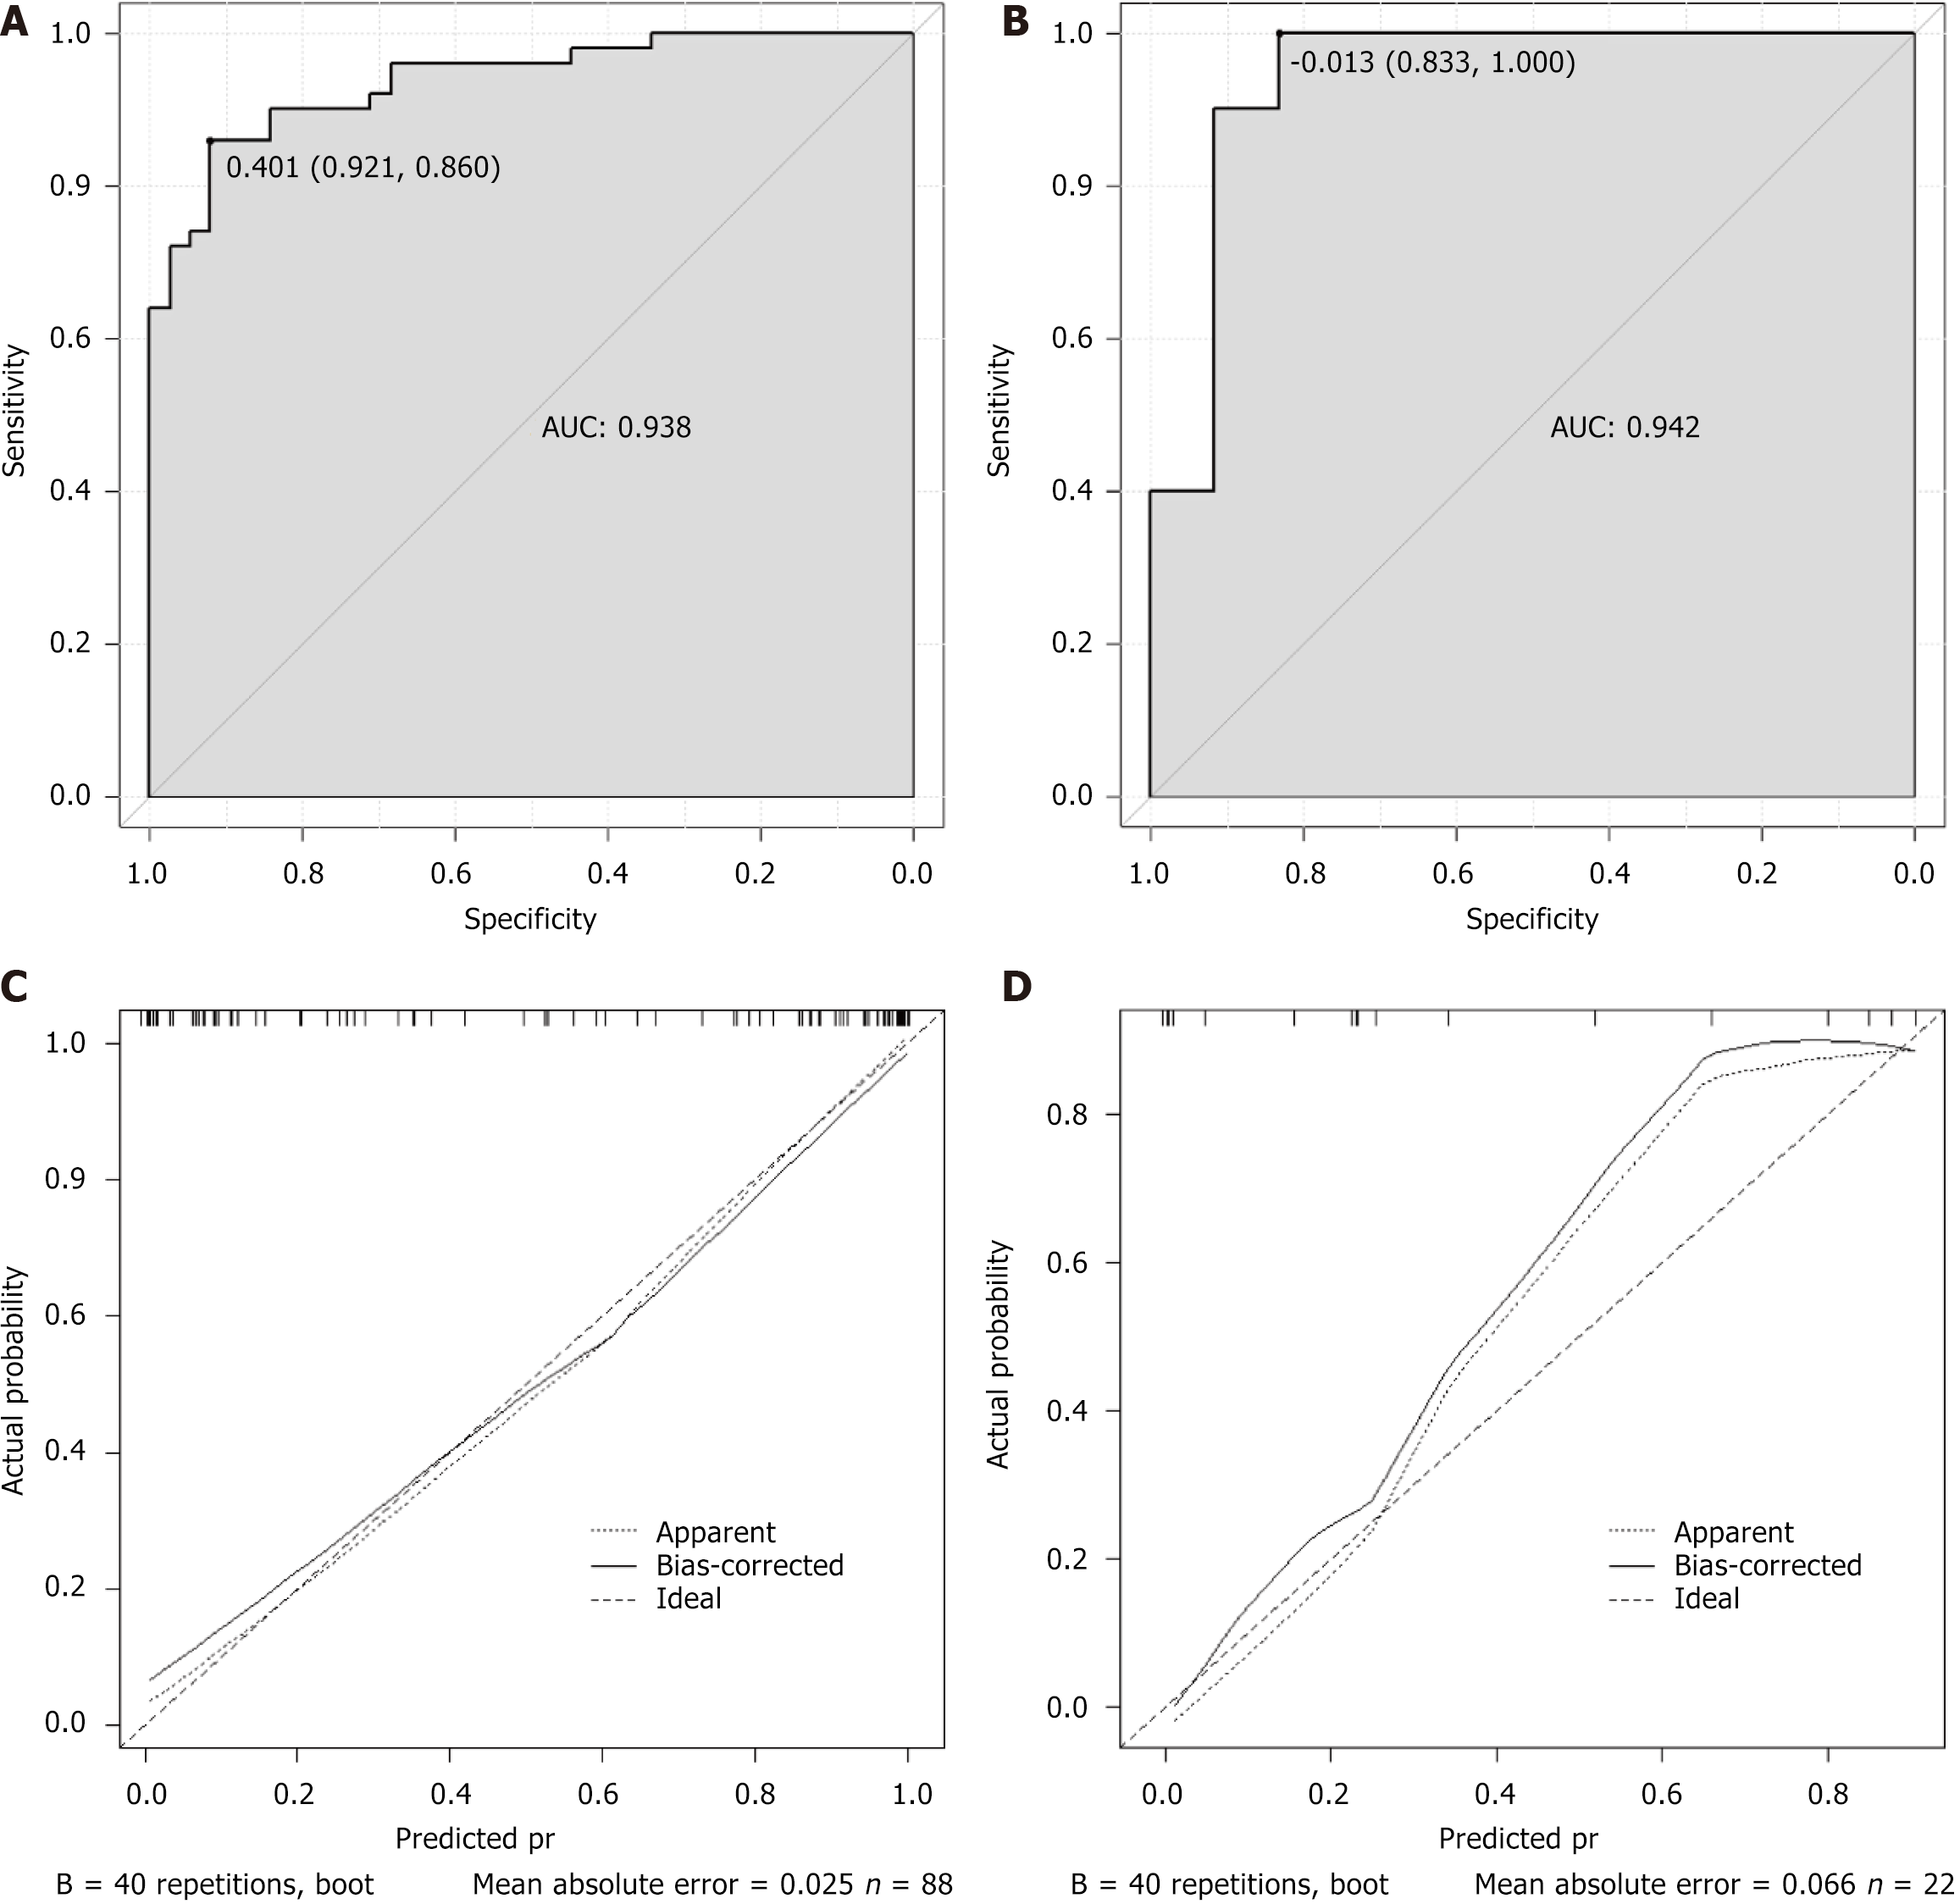
Figure 2 Prediction performance of the model.
A: Receiver operating characteristic (ROC) curve plot in the training set; B: ROC curve plot in the verification set; C: Calibration curve plot in the training set; D: Calibration curve plot in the verification set. AUC: Area under the curve.
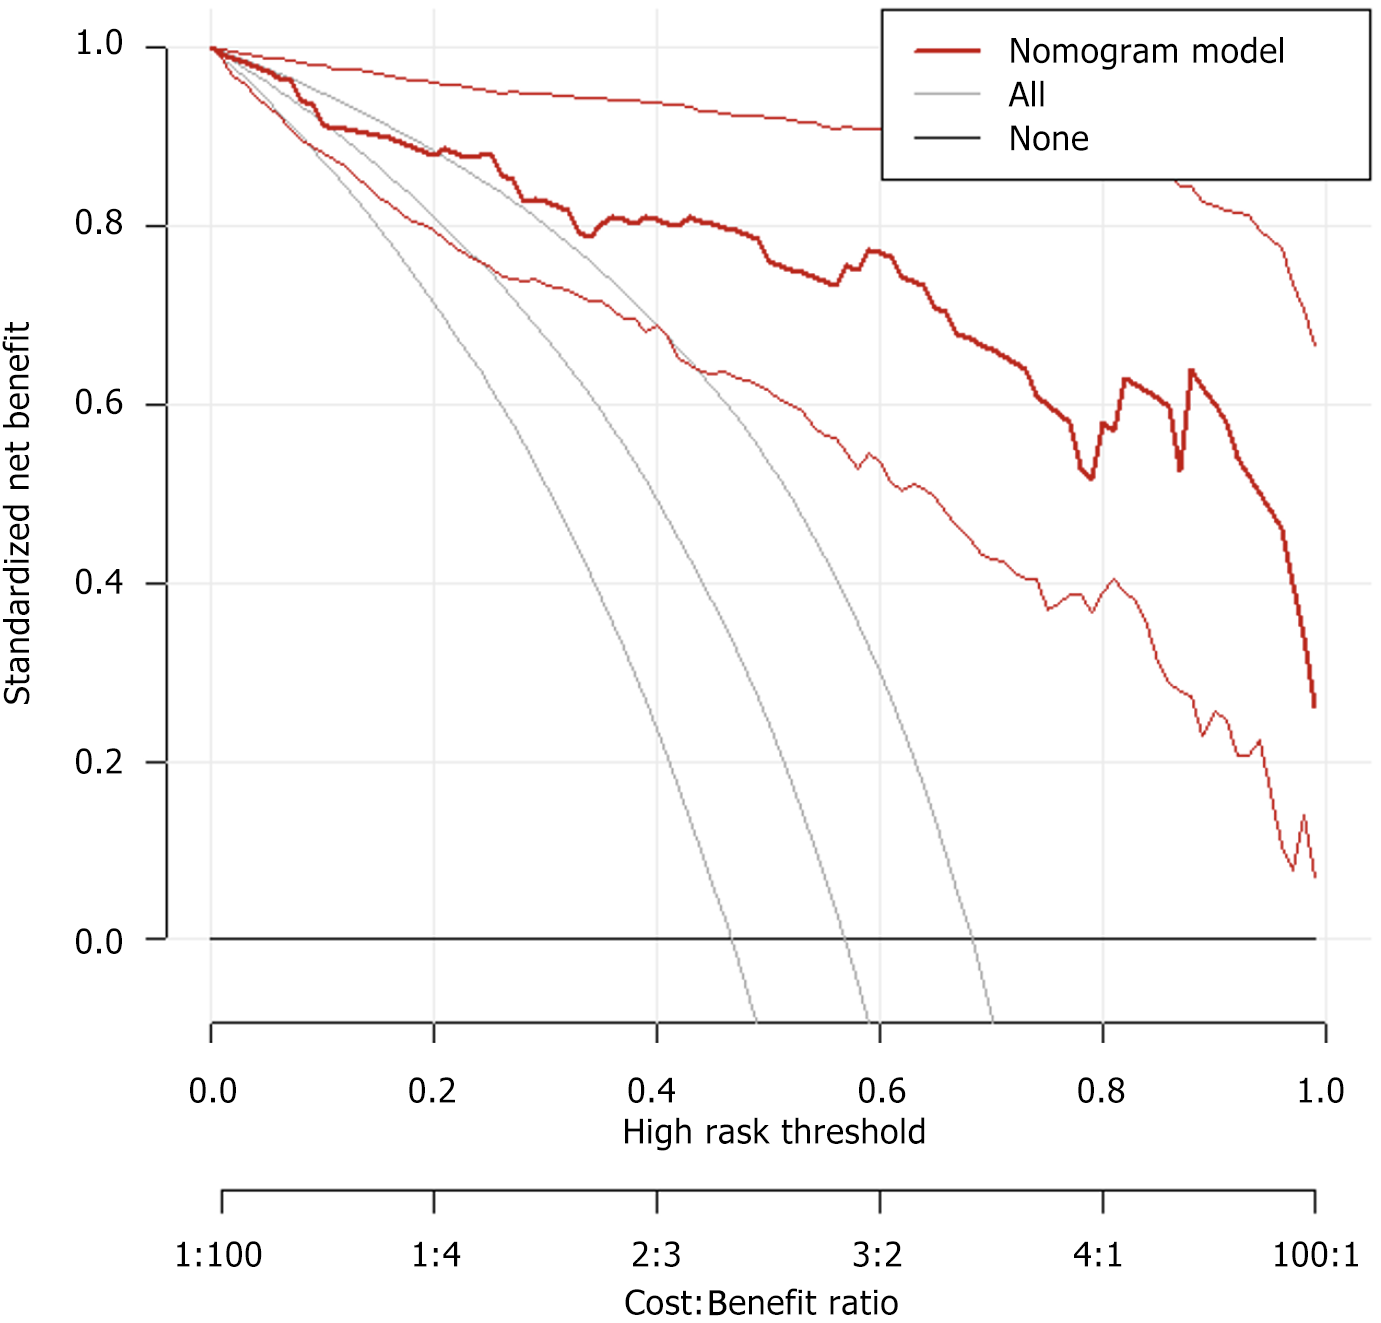
Figure 3 Decision curve analysis to evaluate the clinical utility of the model in predicting efficacy of chemotherapy.
- Citation: Kang WY, Deng WM, Ye XQ, Zhong YH, Li XJ, Feng LL, Luo DH. Multiparametric magnetic resonance imaging-based predictive model for chemotherapy response in colorectal cancer patients with gene mutations. World J Gastrointest Oncol 2025; 17(10): 111971
- URL: https://www.wjgnet.com/1948-5204/full/v17/i10/111971.htm
- DOI: https://dx.doi.org/10.4251/wjgo.v17.i10.111971


