Copyright
©The Author(s) 2024.
World J Gastrointest Oncol. Aug 15, 2024; 16(8): 3687-3704
Published online Aug 15, 2024. doi: 10.4251/wjgo.v16.i8.3687
Published online Aug 15, 2024. doi: 10.4251/wjgo.v16.i8.3687
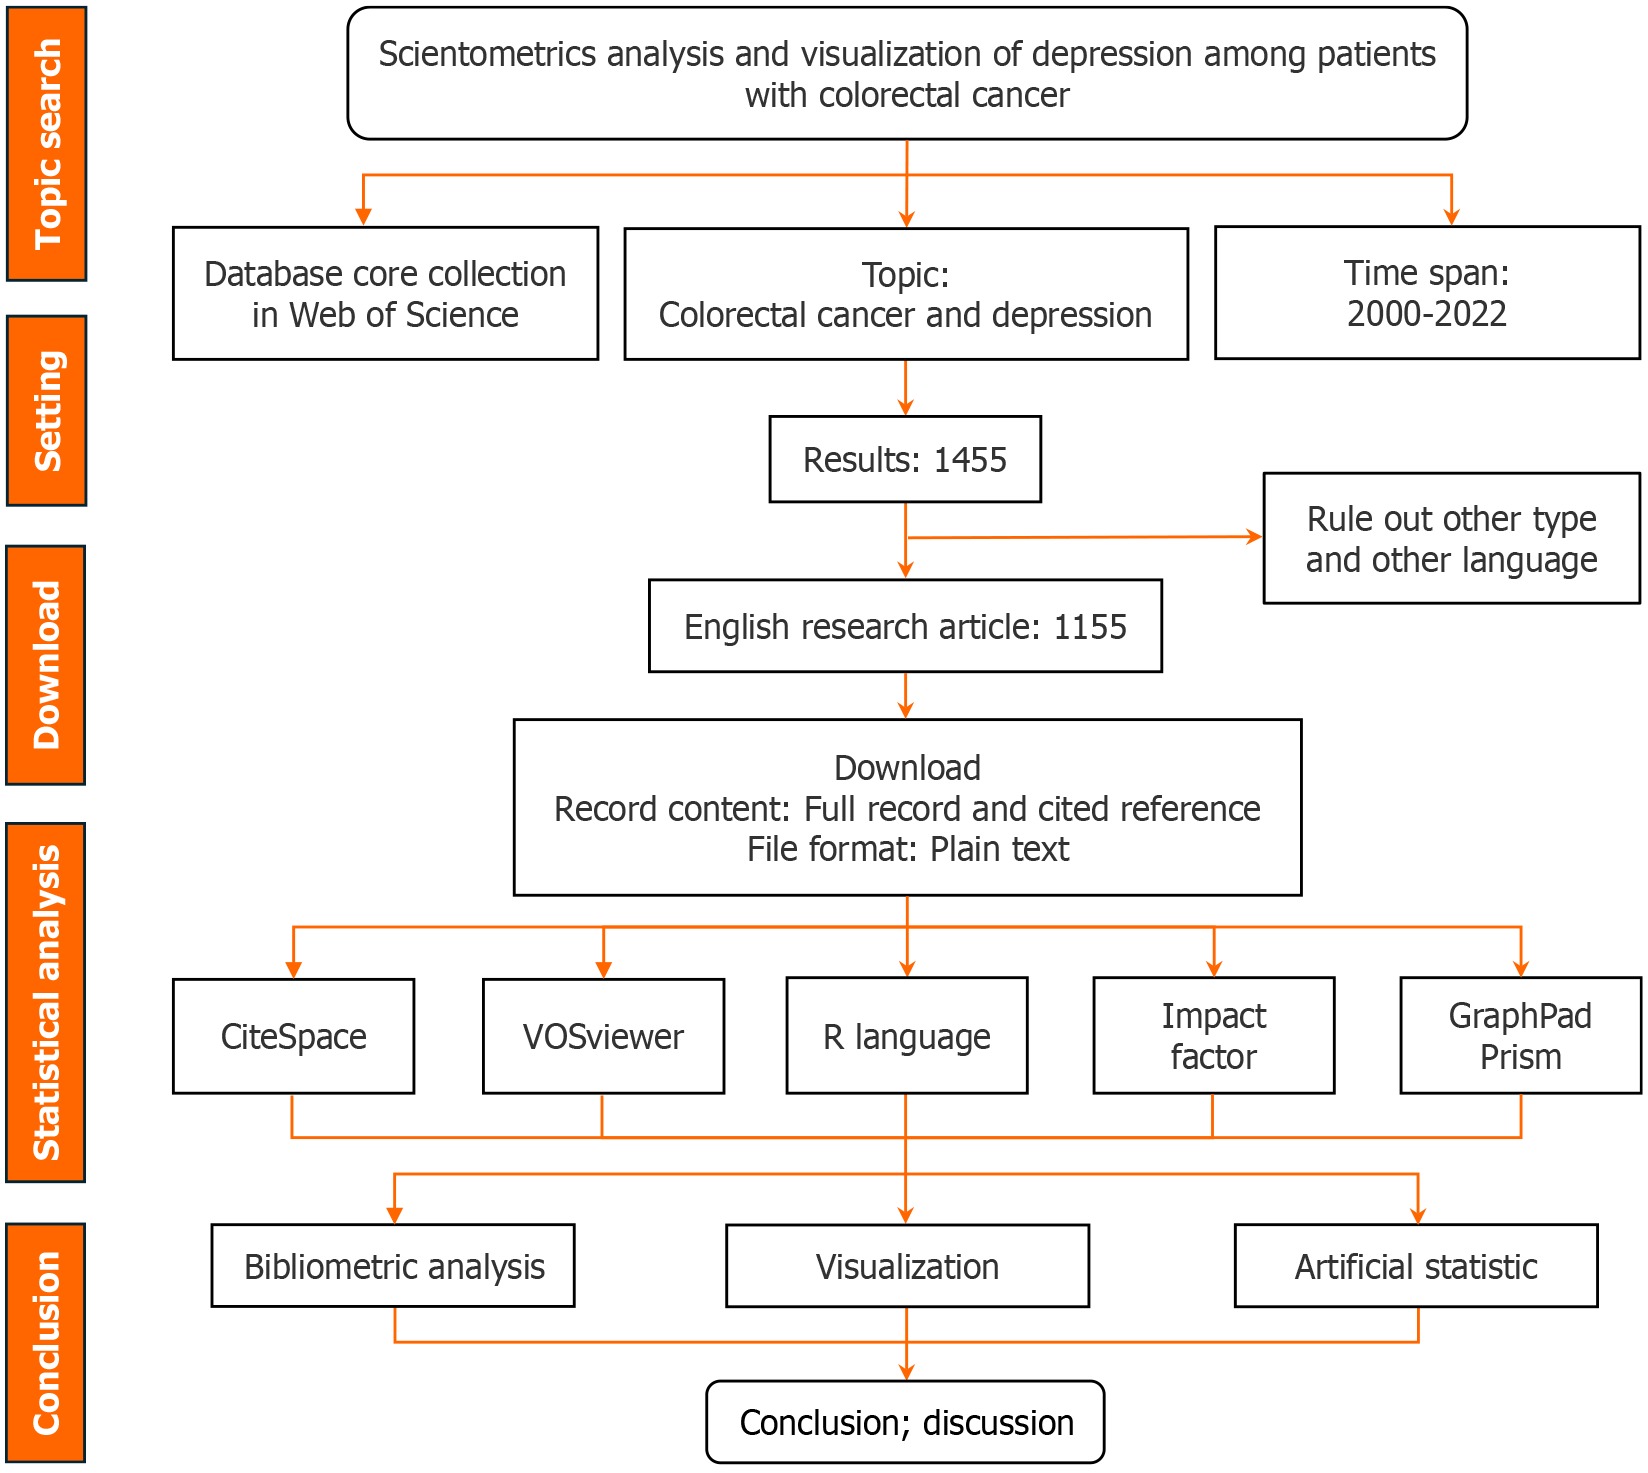
Figure 1
Flow chart of the scientometric analysis.
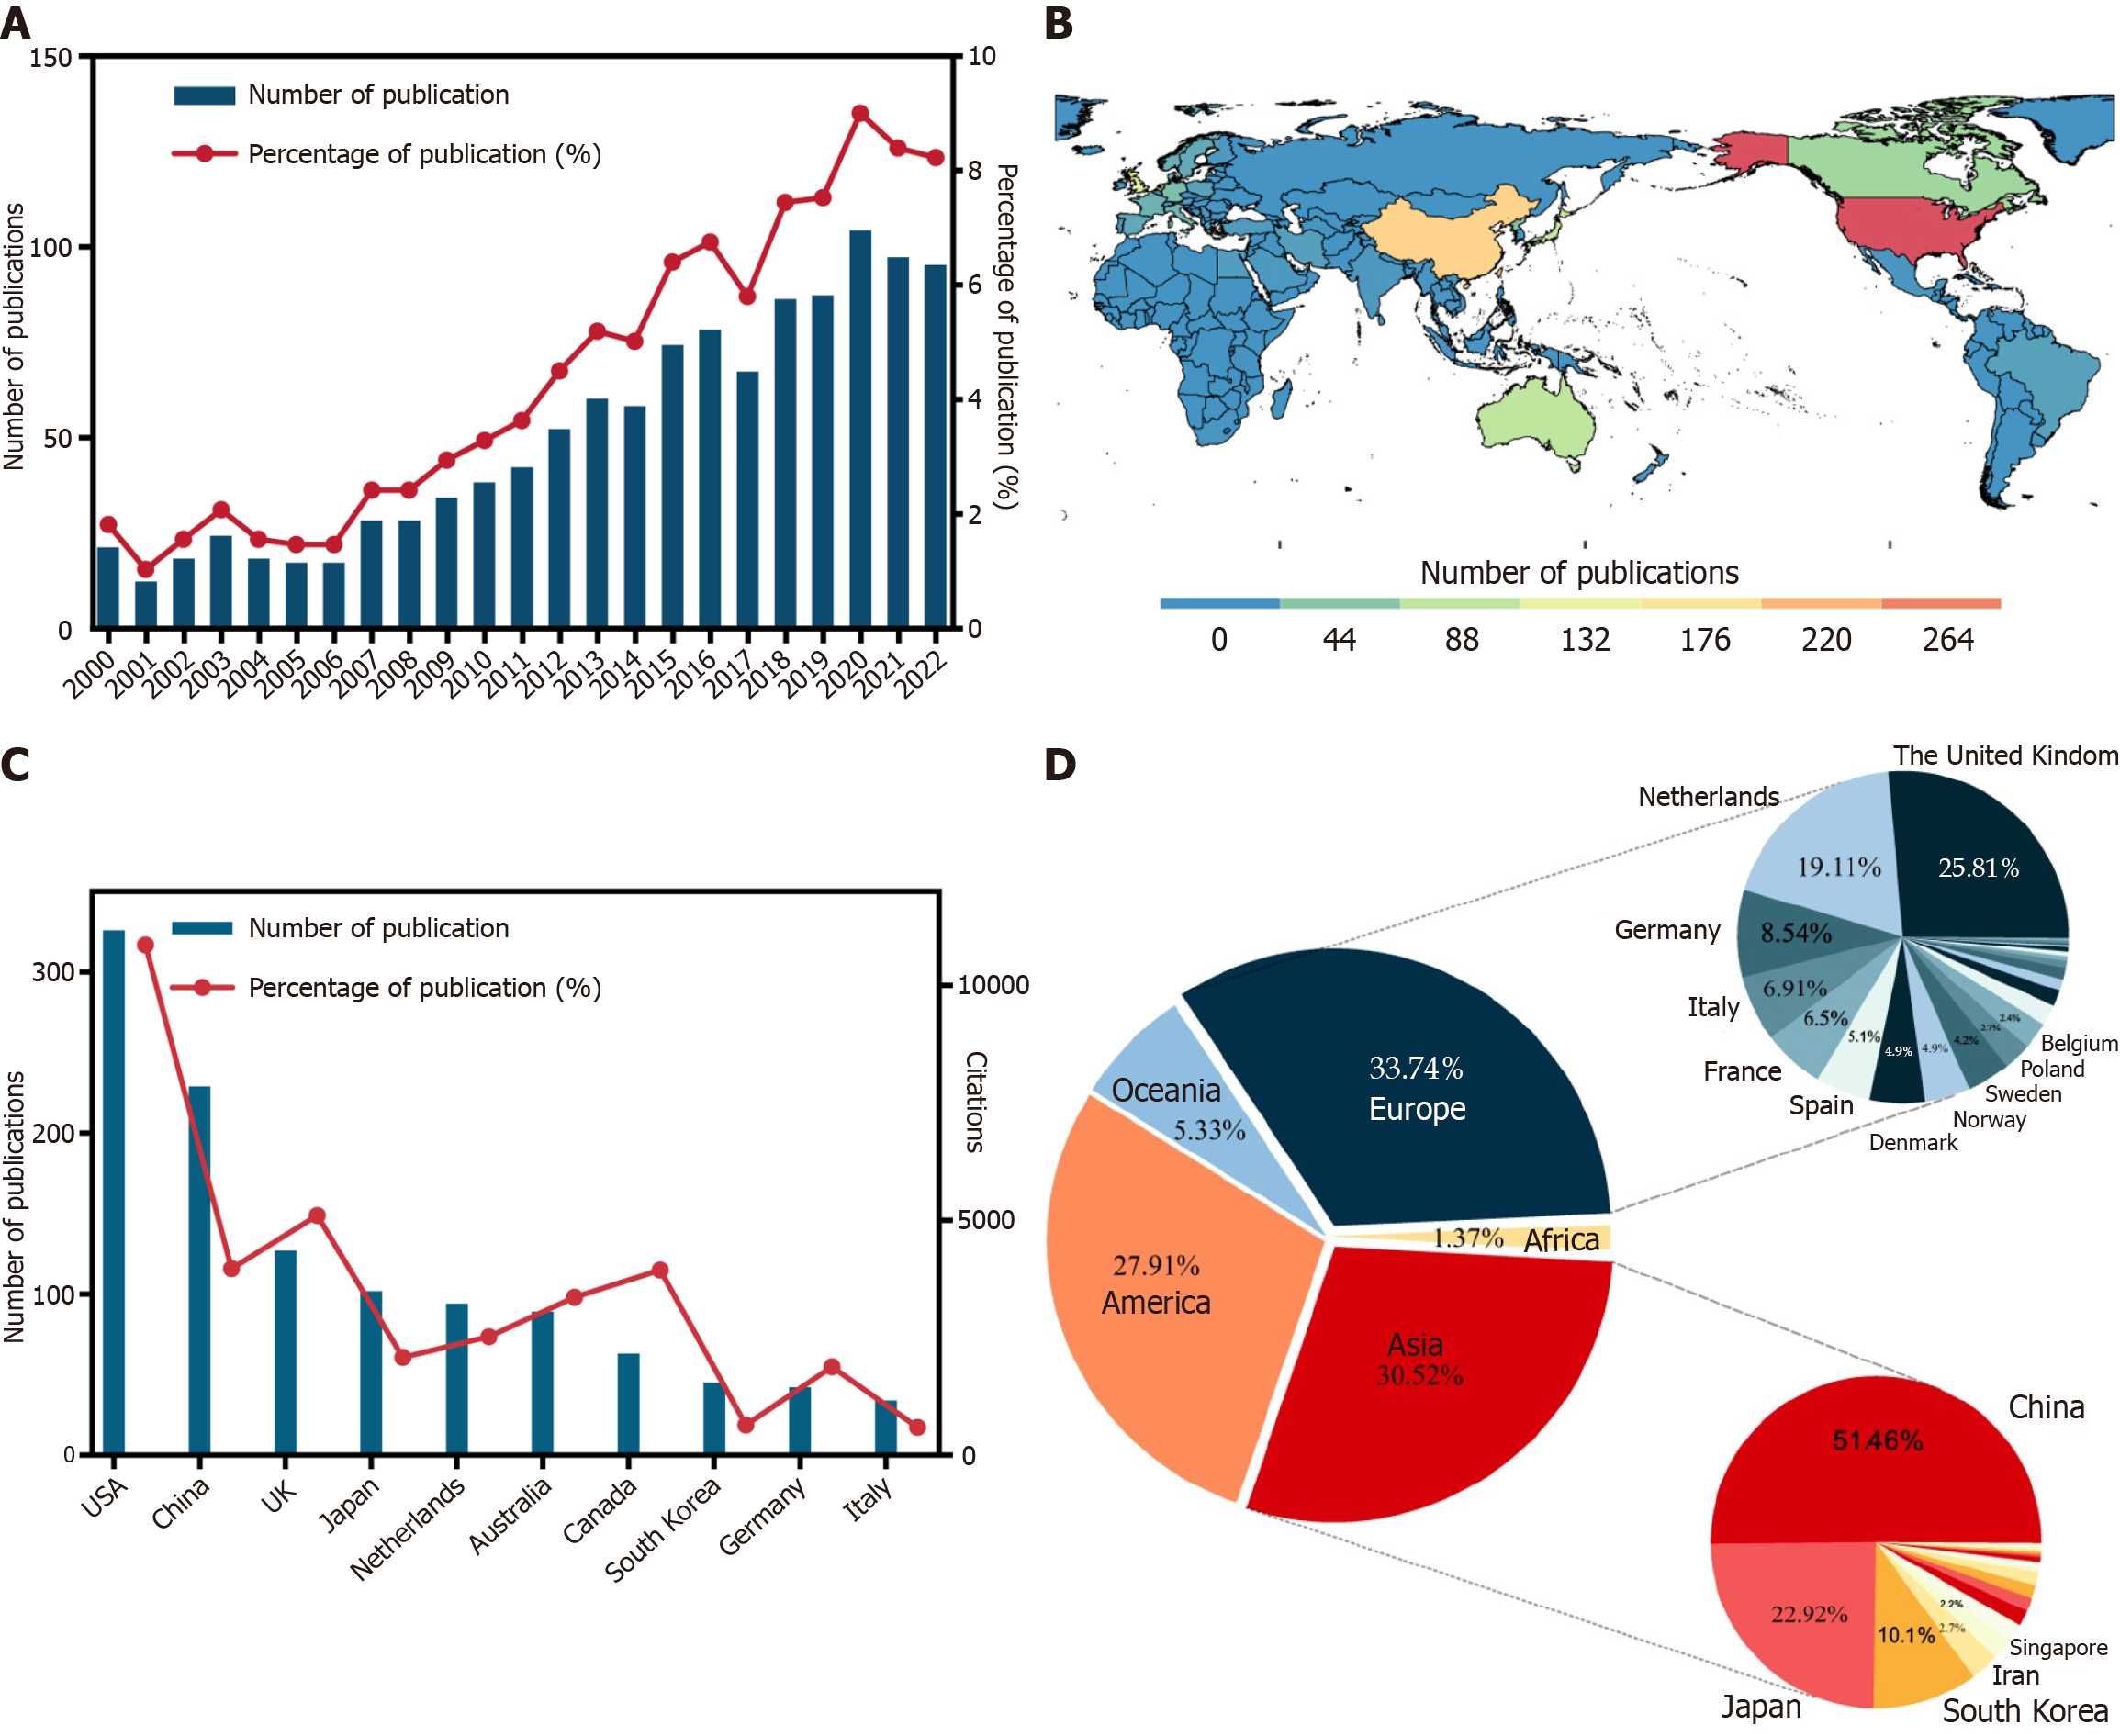
Figure 2 Global publication trend from 2000 to 2021.
A: Annual publications between 2000-2021; B: Global map of publications, 2000-2021 (by country of the corresponding author); C: Continent and country distribution; D: Top 10 countries and their citations.
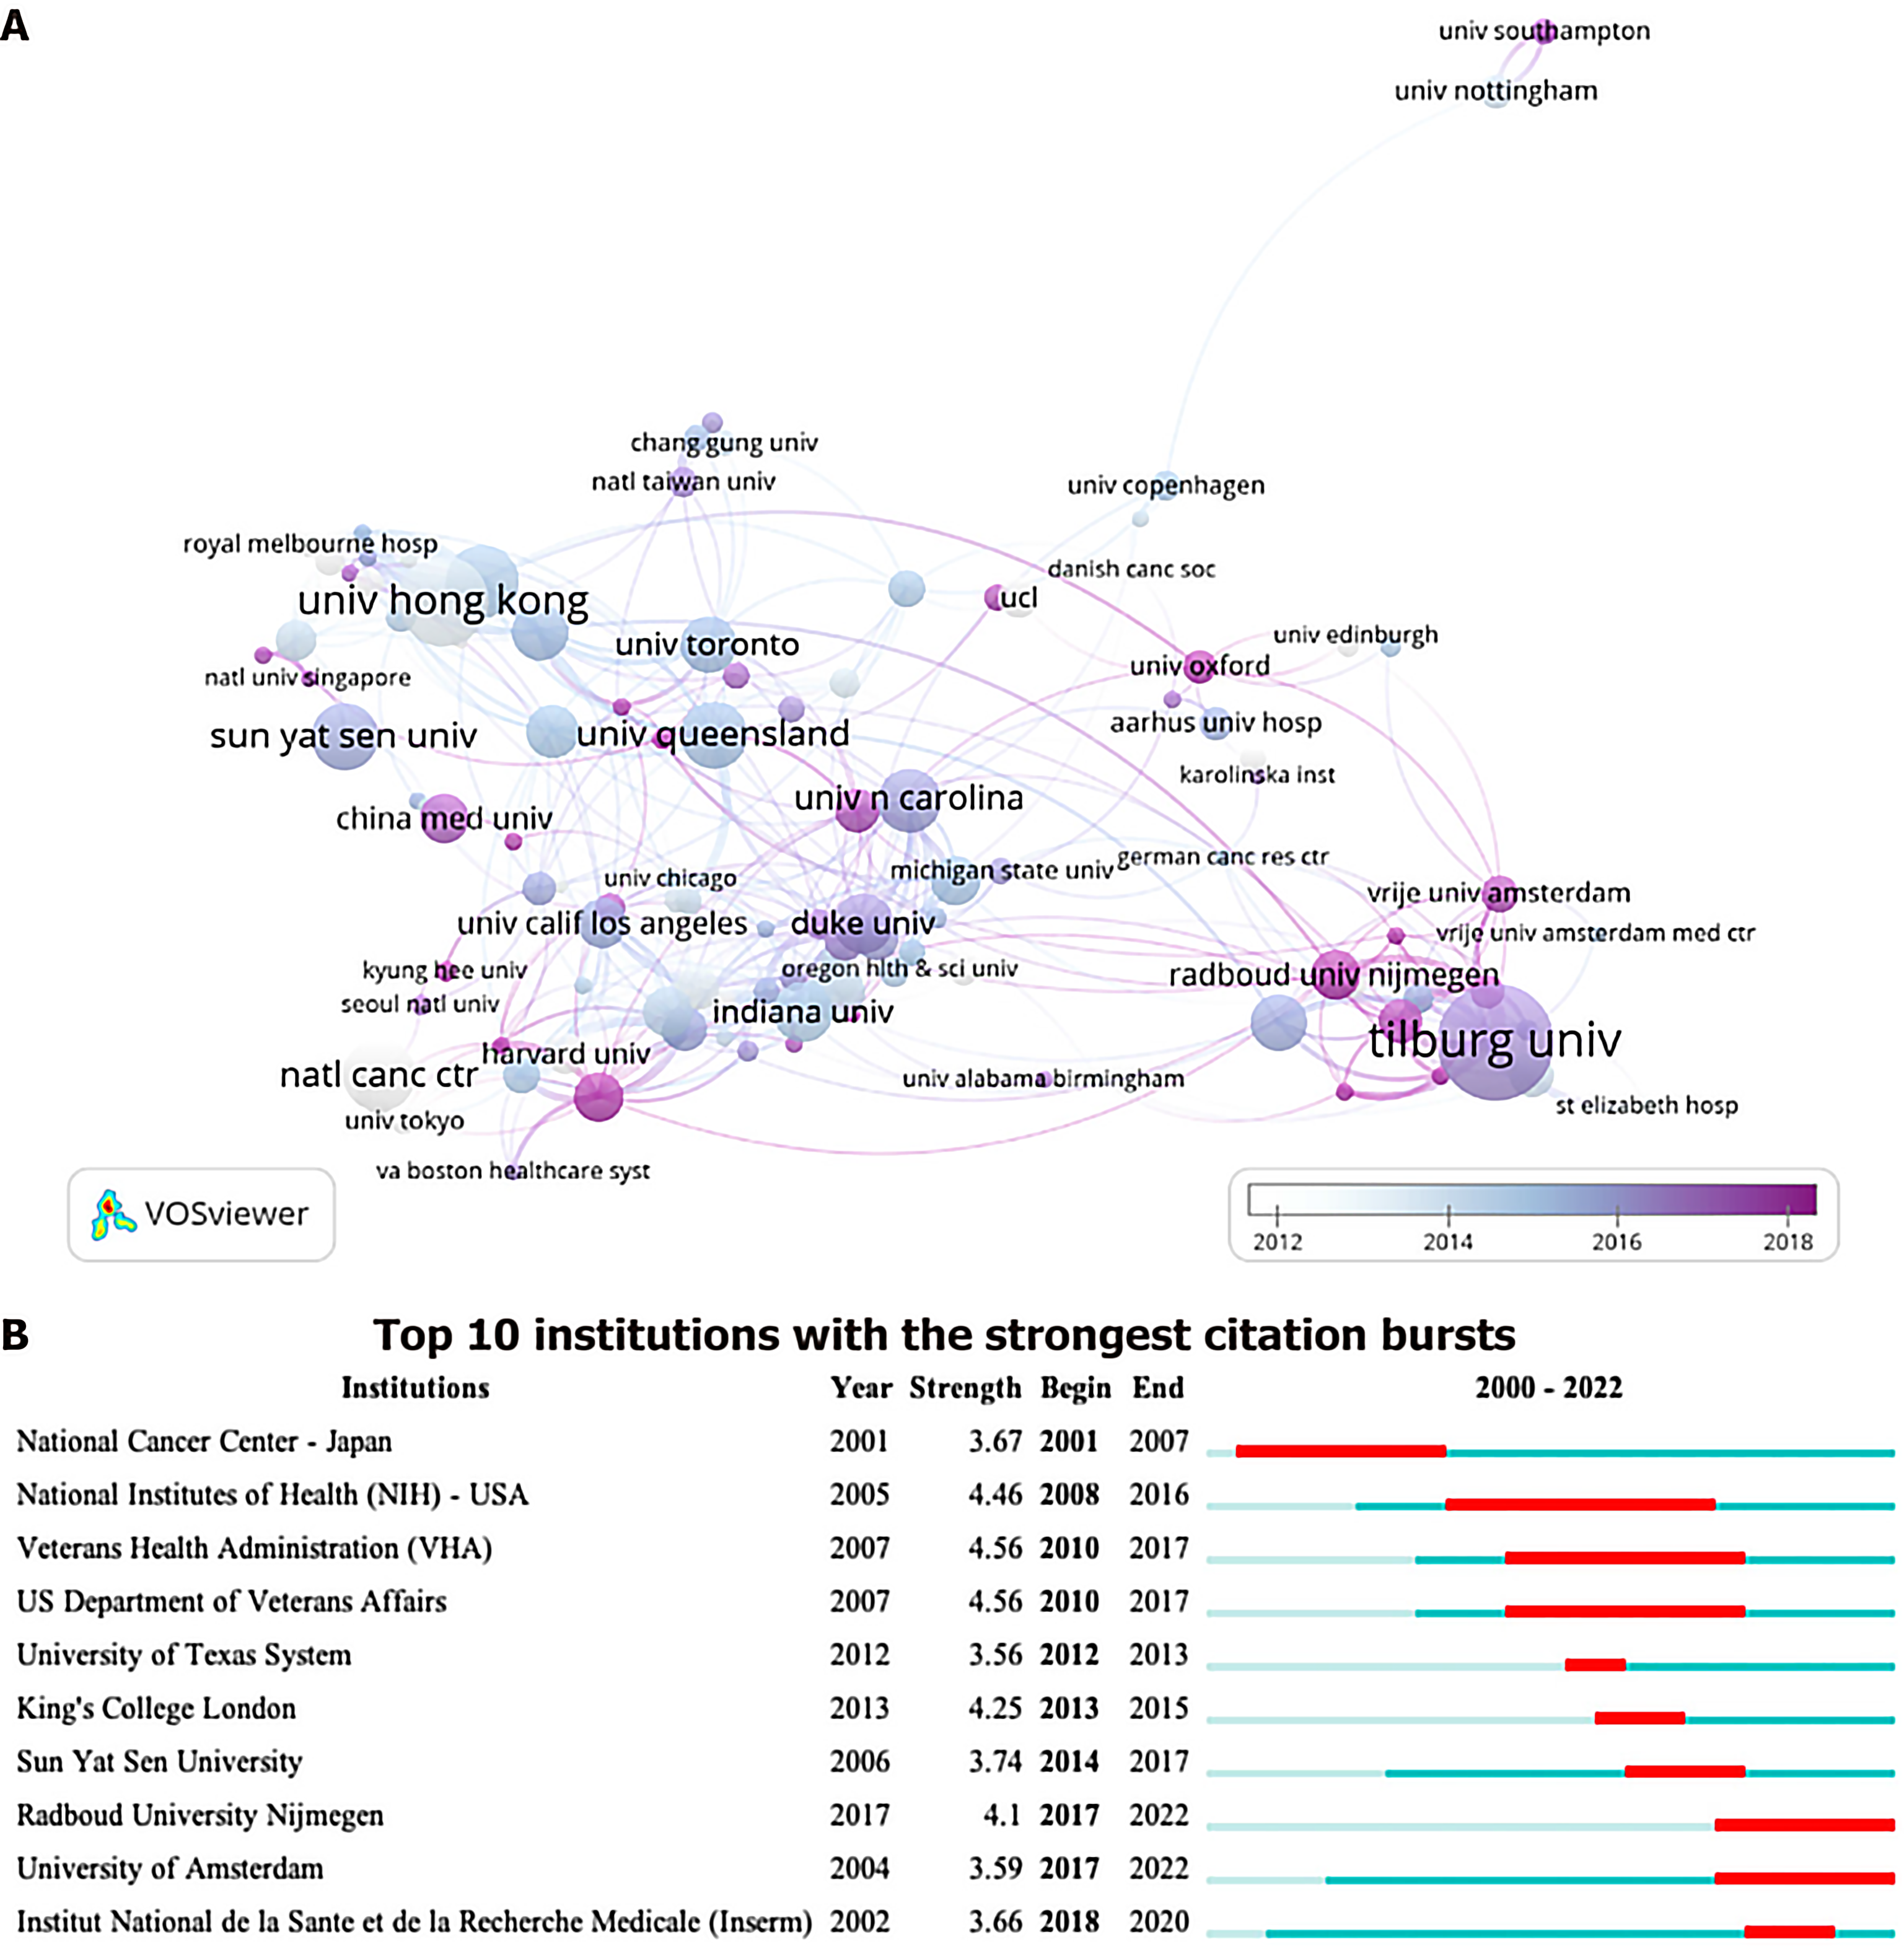
Figure 3 Cooperation map of institutes.
A: VOSviewer visualization map of the co-authorship network of institutions. The visualization map of publications for 121 institutions; a node represents one institution, the node size represents the number of publications, a link shows collaboration, and the distance and the thickness of the link between nodes show the relative strength of the relation. The color of each circle is determined by the year of publication, the darker the color, the more recent the publication; B: CiteSpace visualization map of top 10 institutions with strongest citation bursts. Red bars mean that some institutions are cited frequently in a certain period.
Figure 4 Cooperation map of journals.
A: VOSviewer visualization map of the co-authorship network of journals. Visualization map of publications in 90 journals; a node represents one journal, the node size represents the number of publications, a link shows collaboration, and the distance and the thickness of the link between nodes show the relative strength of the relation. The color of each circle is determined by the year of publication; the darker the color, the more recent the publication; B: A dual map overlay of the science mapping literature. A dual map overlay of journals shows the distribution of relationships between journals, citing journals on the left and cited journals on the right, with colored paths connecting them indicating citation relationships and their thickness indicating co-citation strength. The color corresponds to the time when the node was first co-cited.
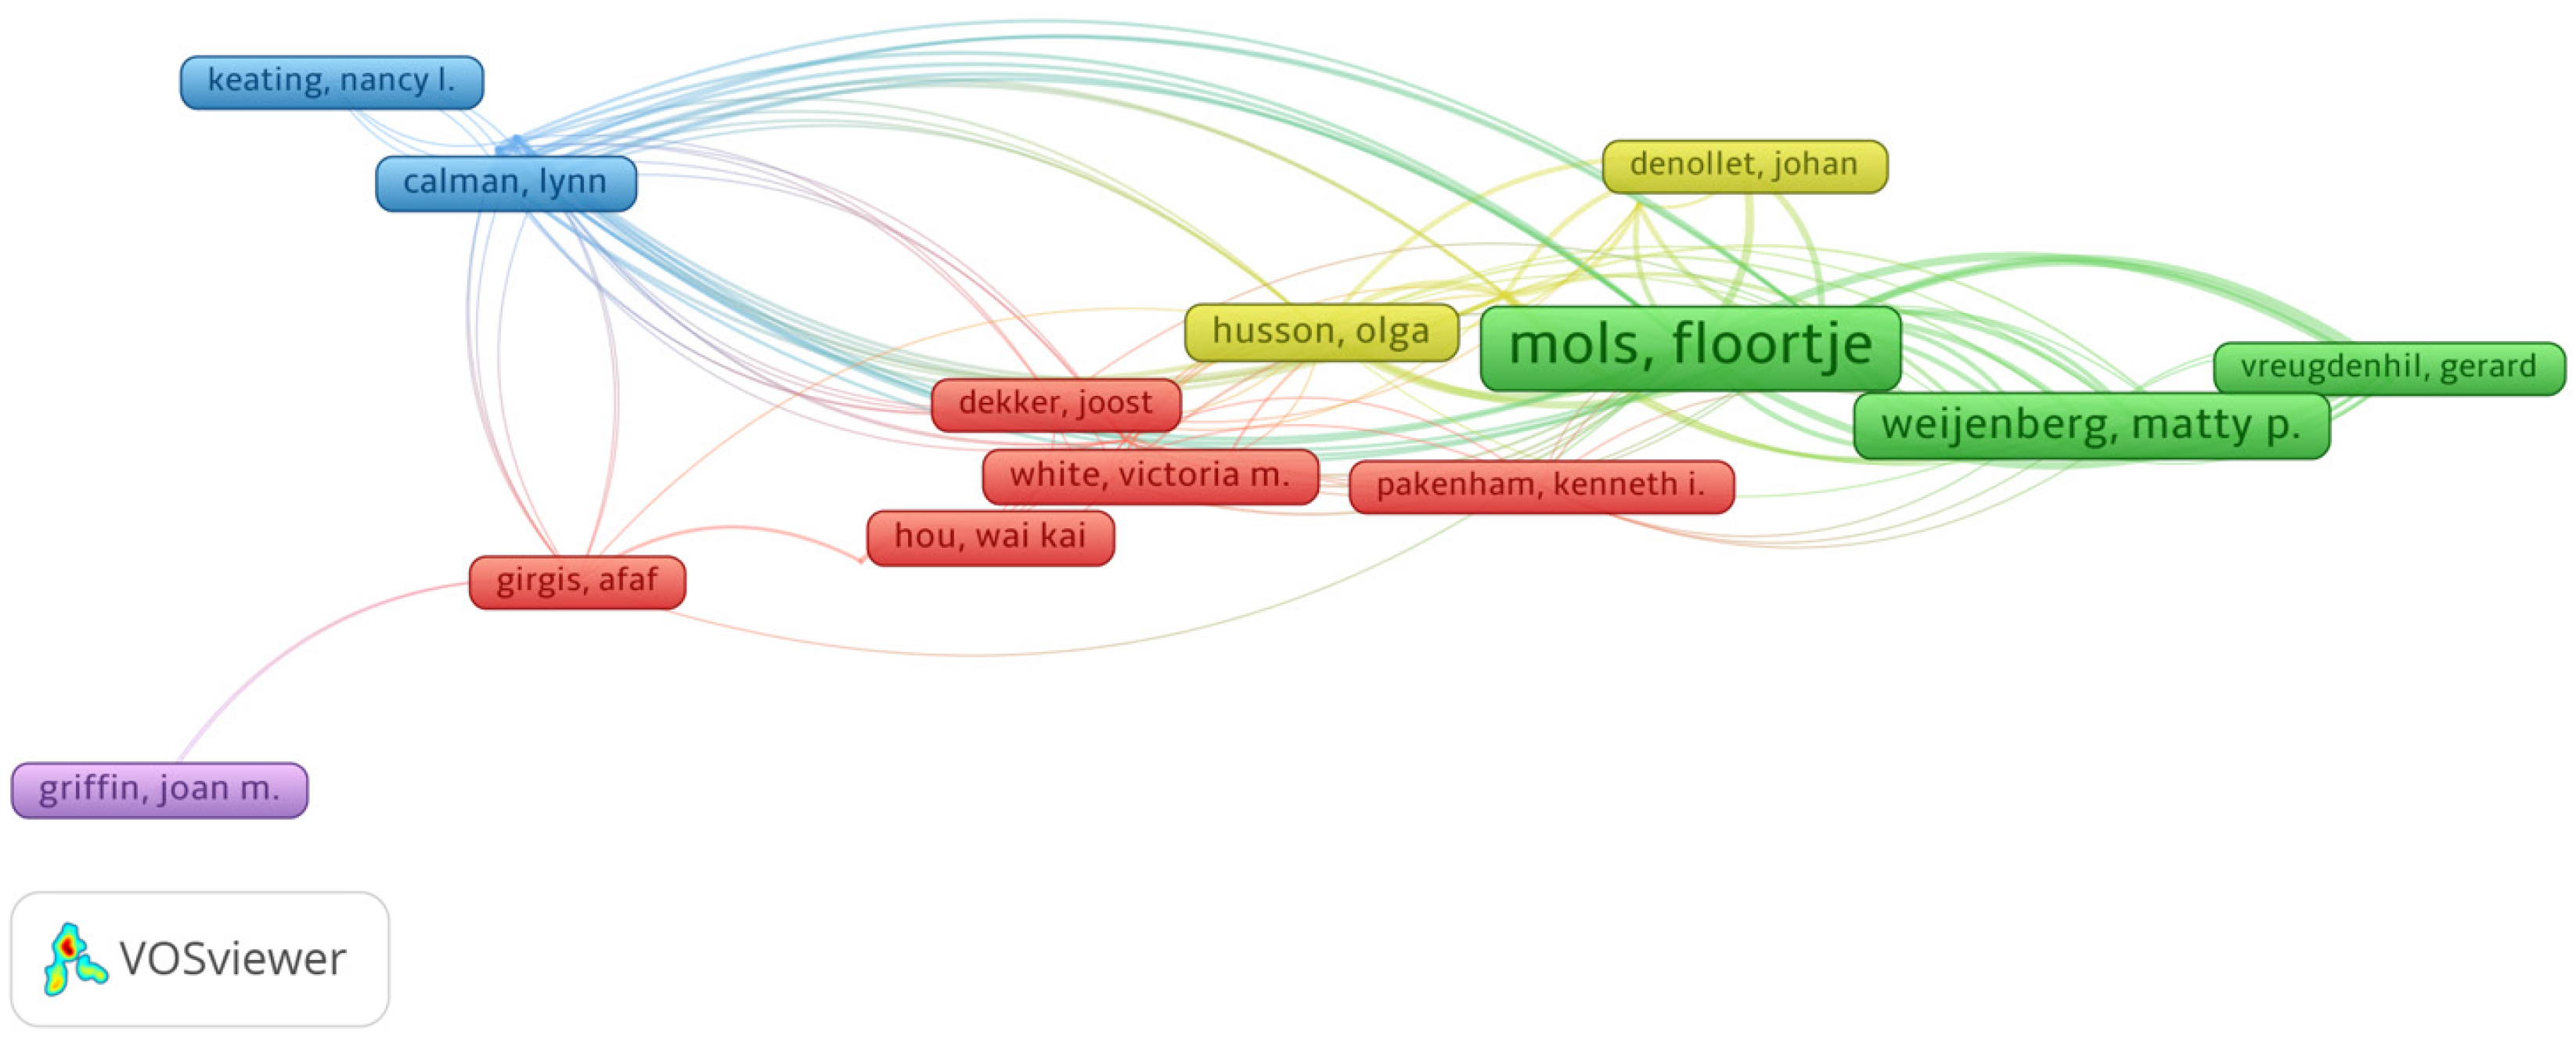
Figure 5 VOSviewer visualization map of the co-authorship network.
Cluster maps of the authors who appeared at least three times. Visualization map of publications of 199 authors forming five collaborating clusters (nodes with the same color). A node represents an author, the size of the node represents the number of publications, a link shows collaboration, and the distance and the thickness of the link between nodes show the relative strength of the relation.
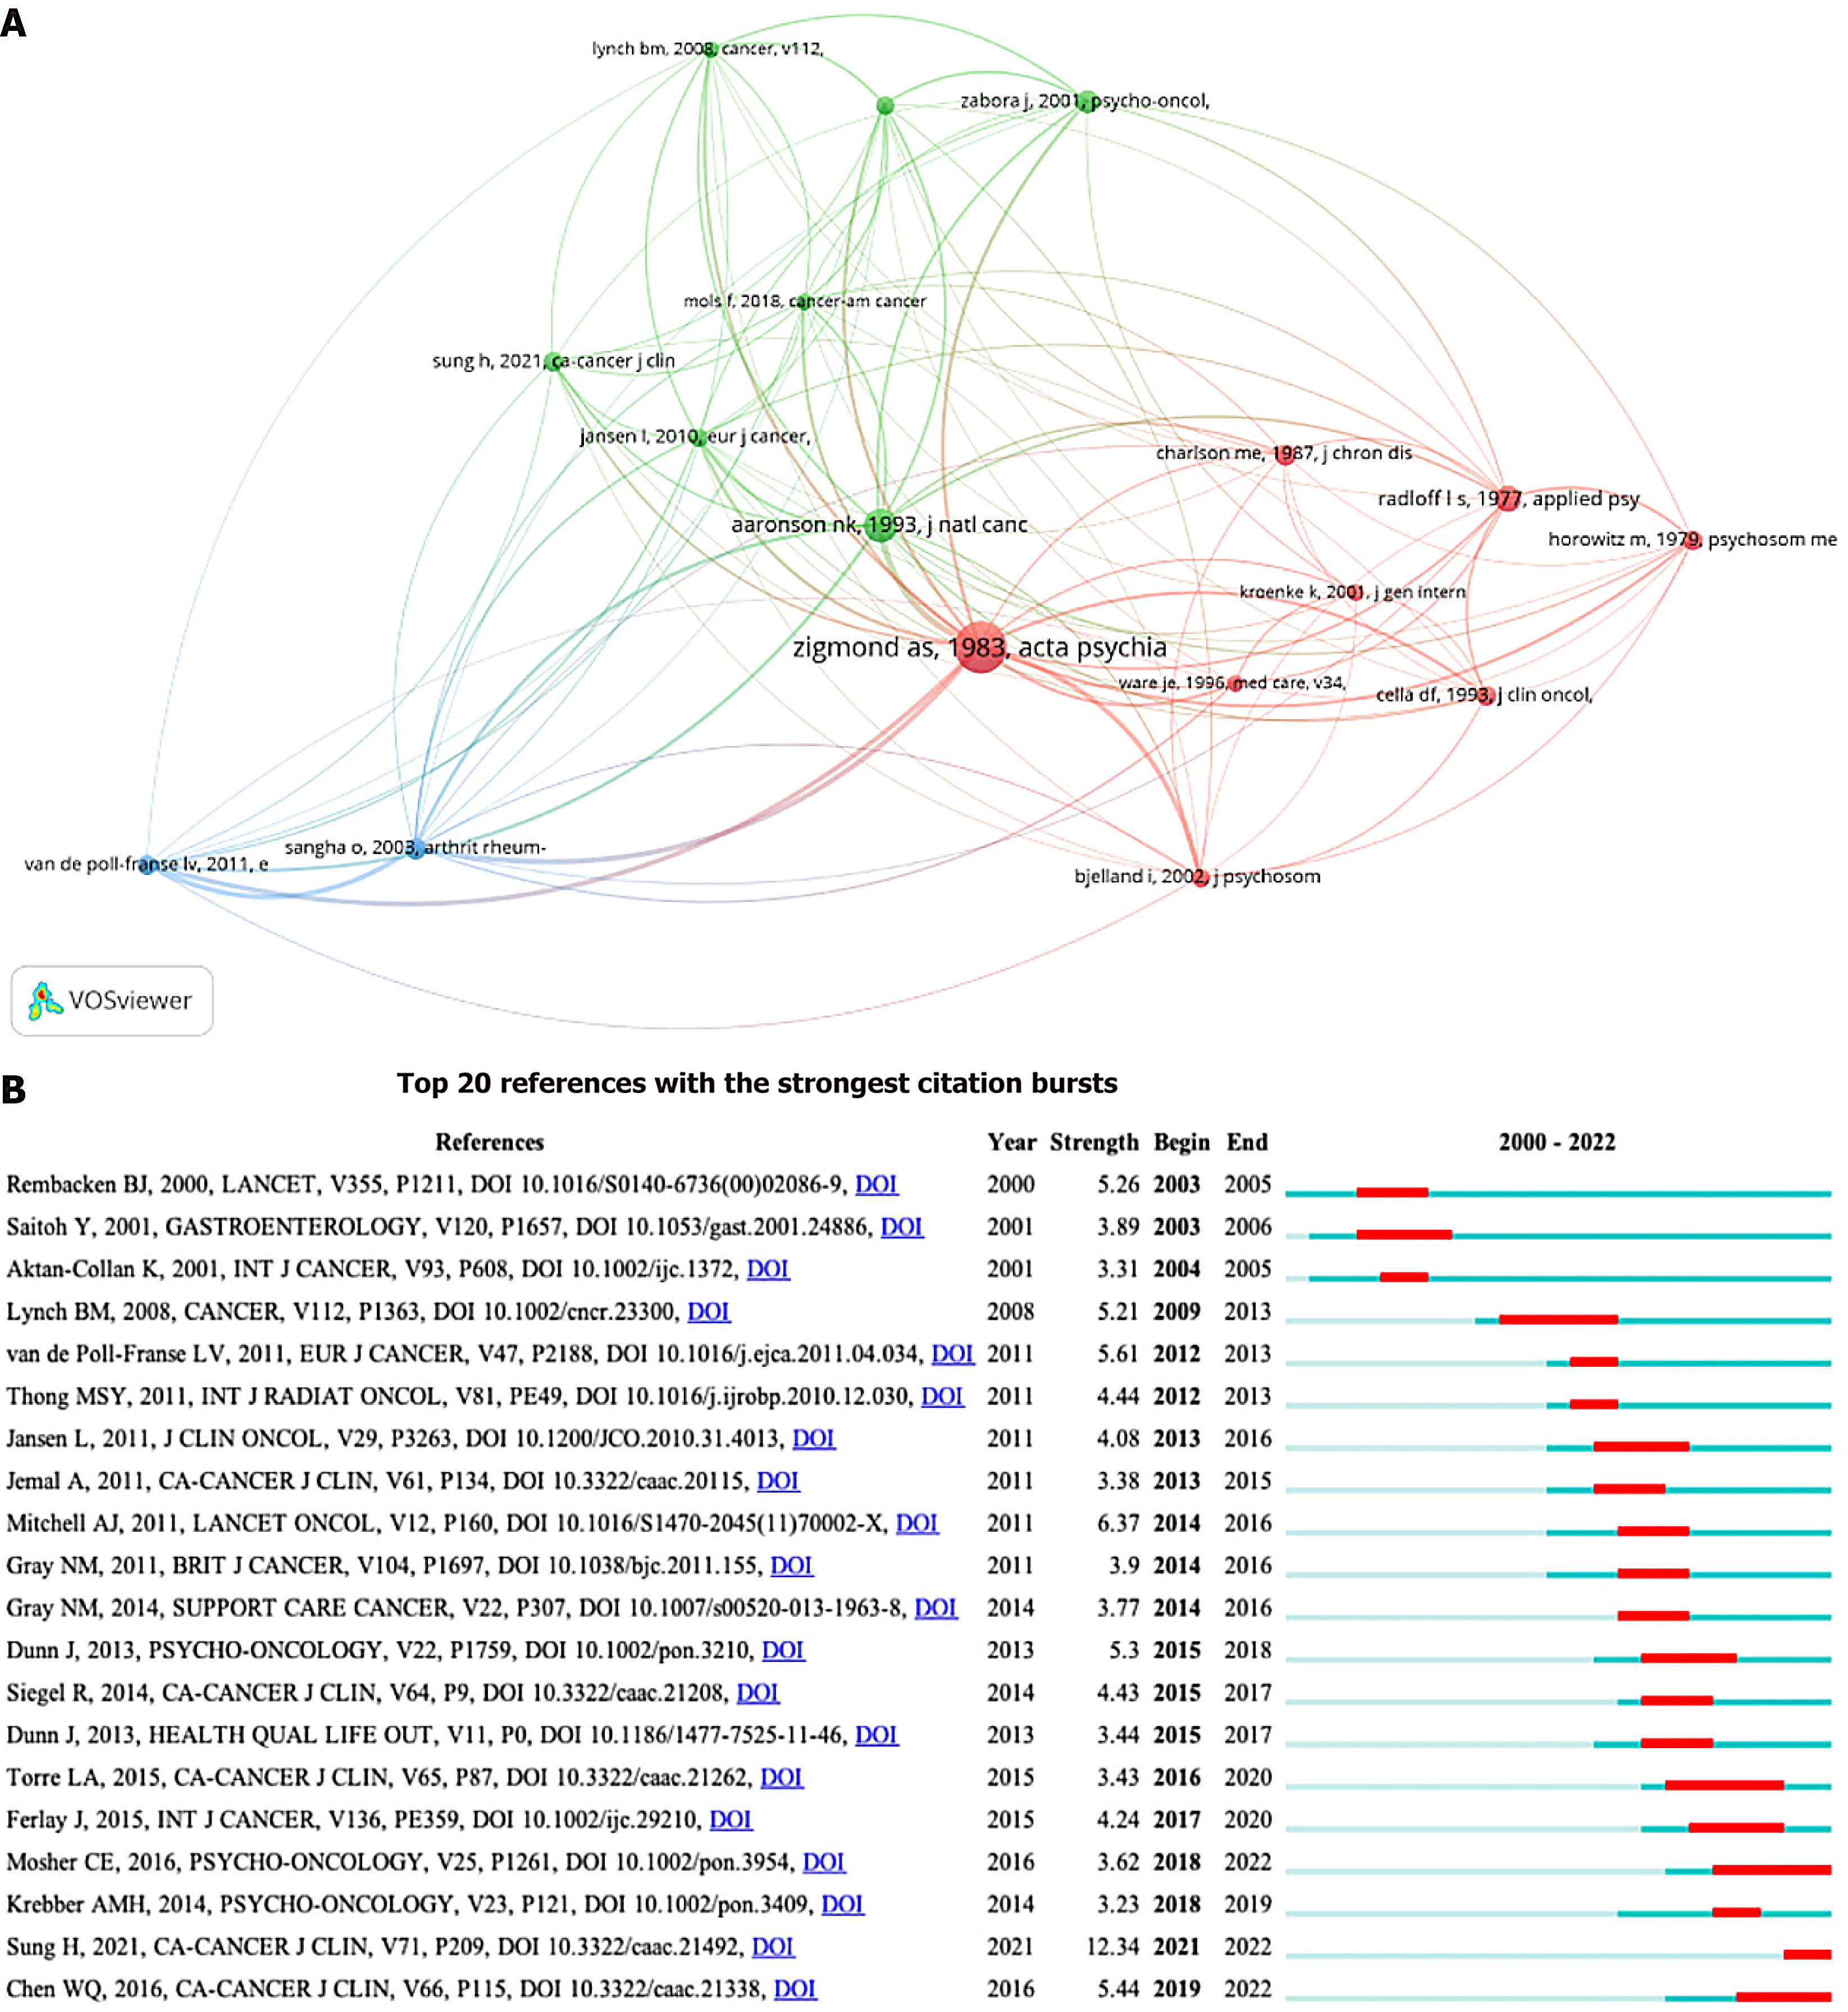
Figure 6 Cluster map of references.
A: VOSviewer visualization map of the co-citation network of references. The cooperative network consists of 12 articles divided into four clusters represented by different colors. The node size indicates the number of citations, and the connecting line indicates a cooperative relationship between the two articles; B: CiteSpace visualization map of top 30 references with strongest citation bursts. Red bars indicate references that were cited frequently in a certain period.
Figure 7 Cluster map of keywords.
A: Co-occurrence cluster analysis of the top 414 Keywords. Cluster map of authors who appeared at least five times. Visualization map of publications by 414 authors forming nine collaborating clusters (nodes with the same color). The node labels show the keywords, and the size of each node refers to the frequency of the keywords. A link connecting two nodes represents a co-occurrence relationship between two keywords. Circles and labels form a cell, and cells of different colors form different clusters; B: The main keywords contained in the red cluster and their occurrences; C: CiteSpace visualization map of top 30 keywords with strongest citation bursts. Red bars mean that some keywords are cited frequently in a certain period.
- Citation: Yan ZW, Liu YN, Xu Q, Yuan Y. Current trends and hotspots of depressive disorders with colorectal cancer: A bibliometric and visual study. World J Gastrointest Oncol 2024; 16(8): 3687-3704
- URL: https://www.wjgnet.com/1948-5204/full/v16/i8/3687.htm
- DOI: https://dx.doi.org/10.4251/wjgo.v16.i8.3687


