©The Author(s) 2024.
World J Gastrointest Oncol. Jun 15, 2024; 16(6): 2826-2841
Published online Jun 15, 2024. doi: 10.4251/wjgo.v16.i6.2826
Published online Jun 15, 2024. doi: 10.4251/wjgo.v16.i6.2826
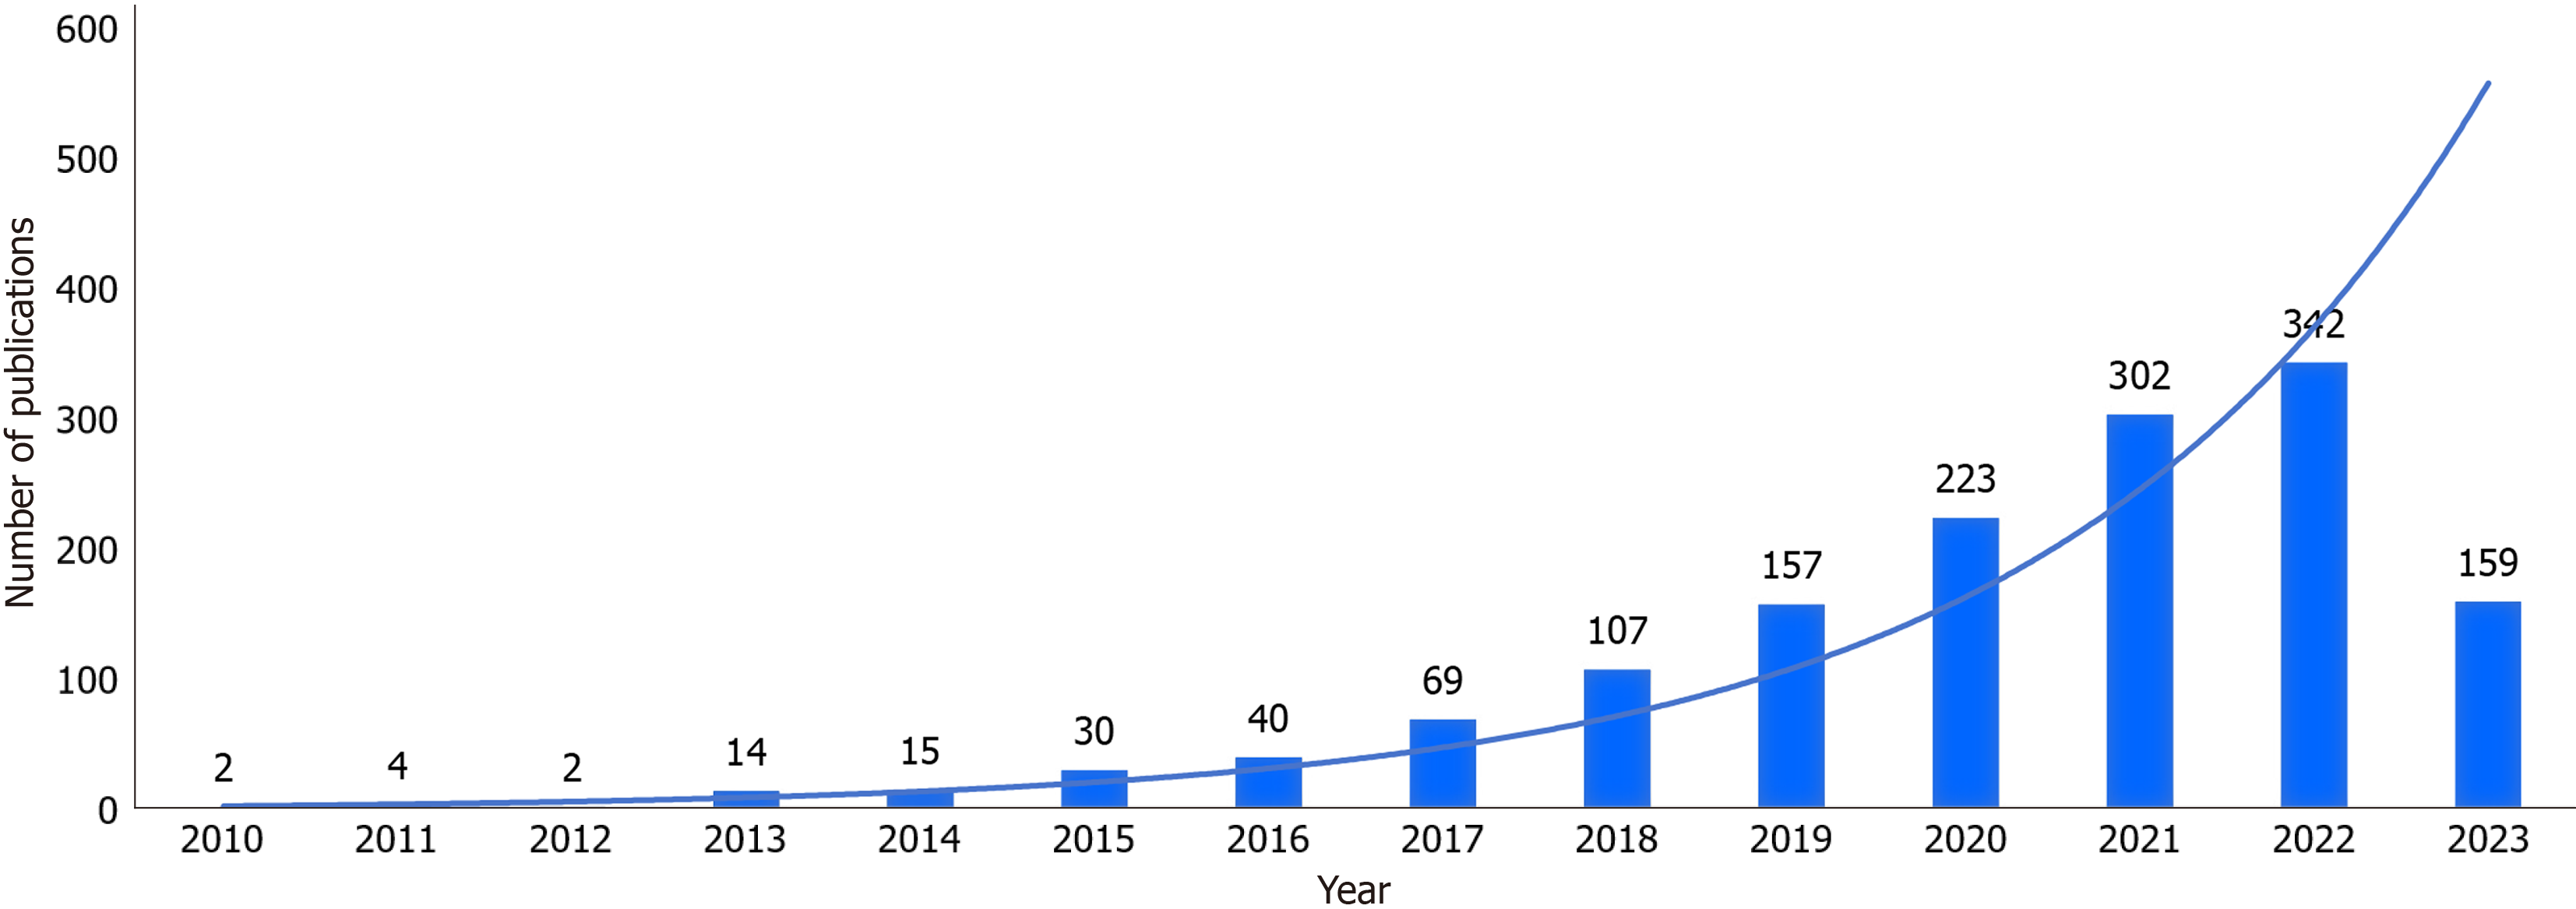
Figure 1 Trends in global publications in the field of gastrointestinal tumor organoids.
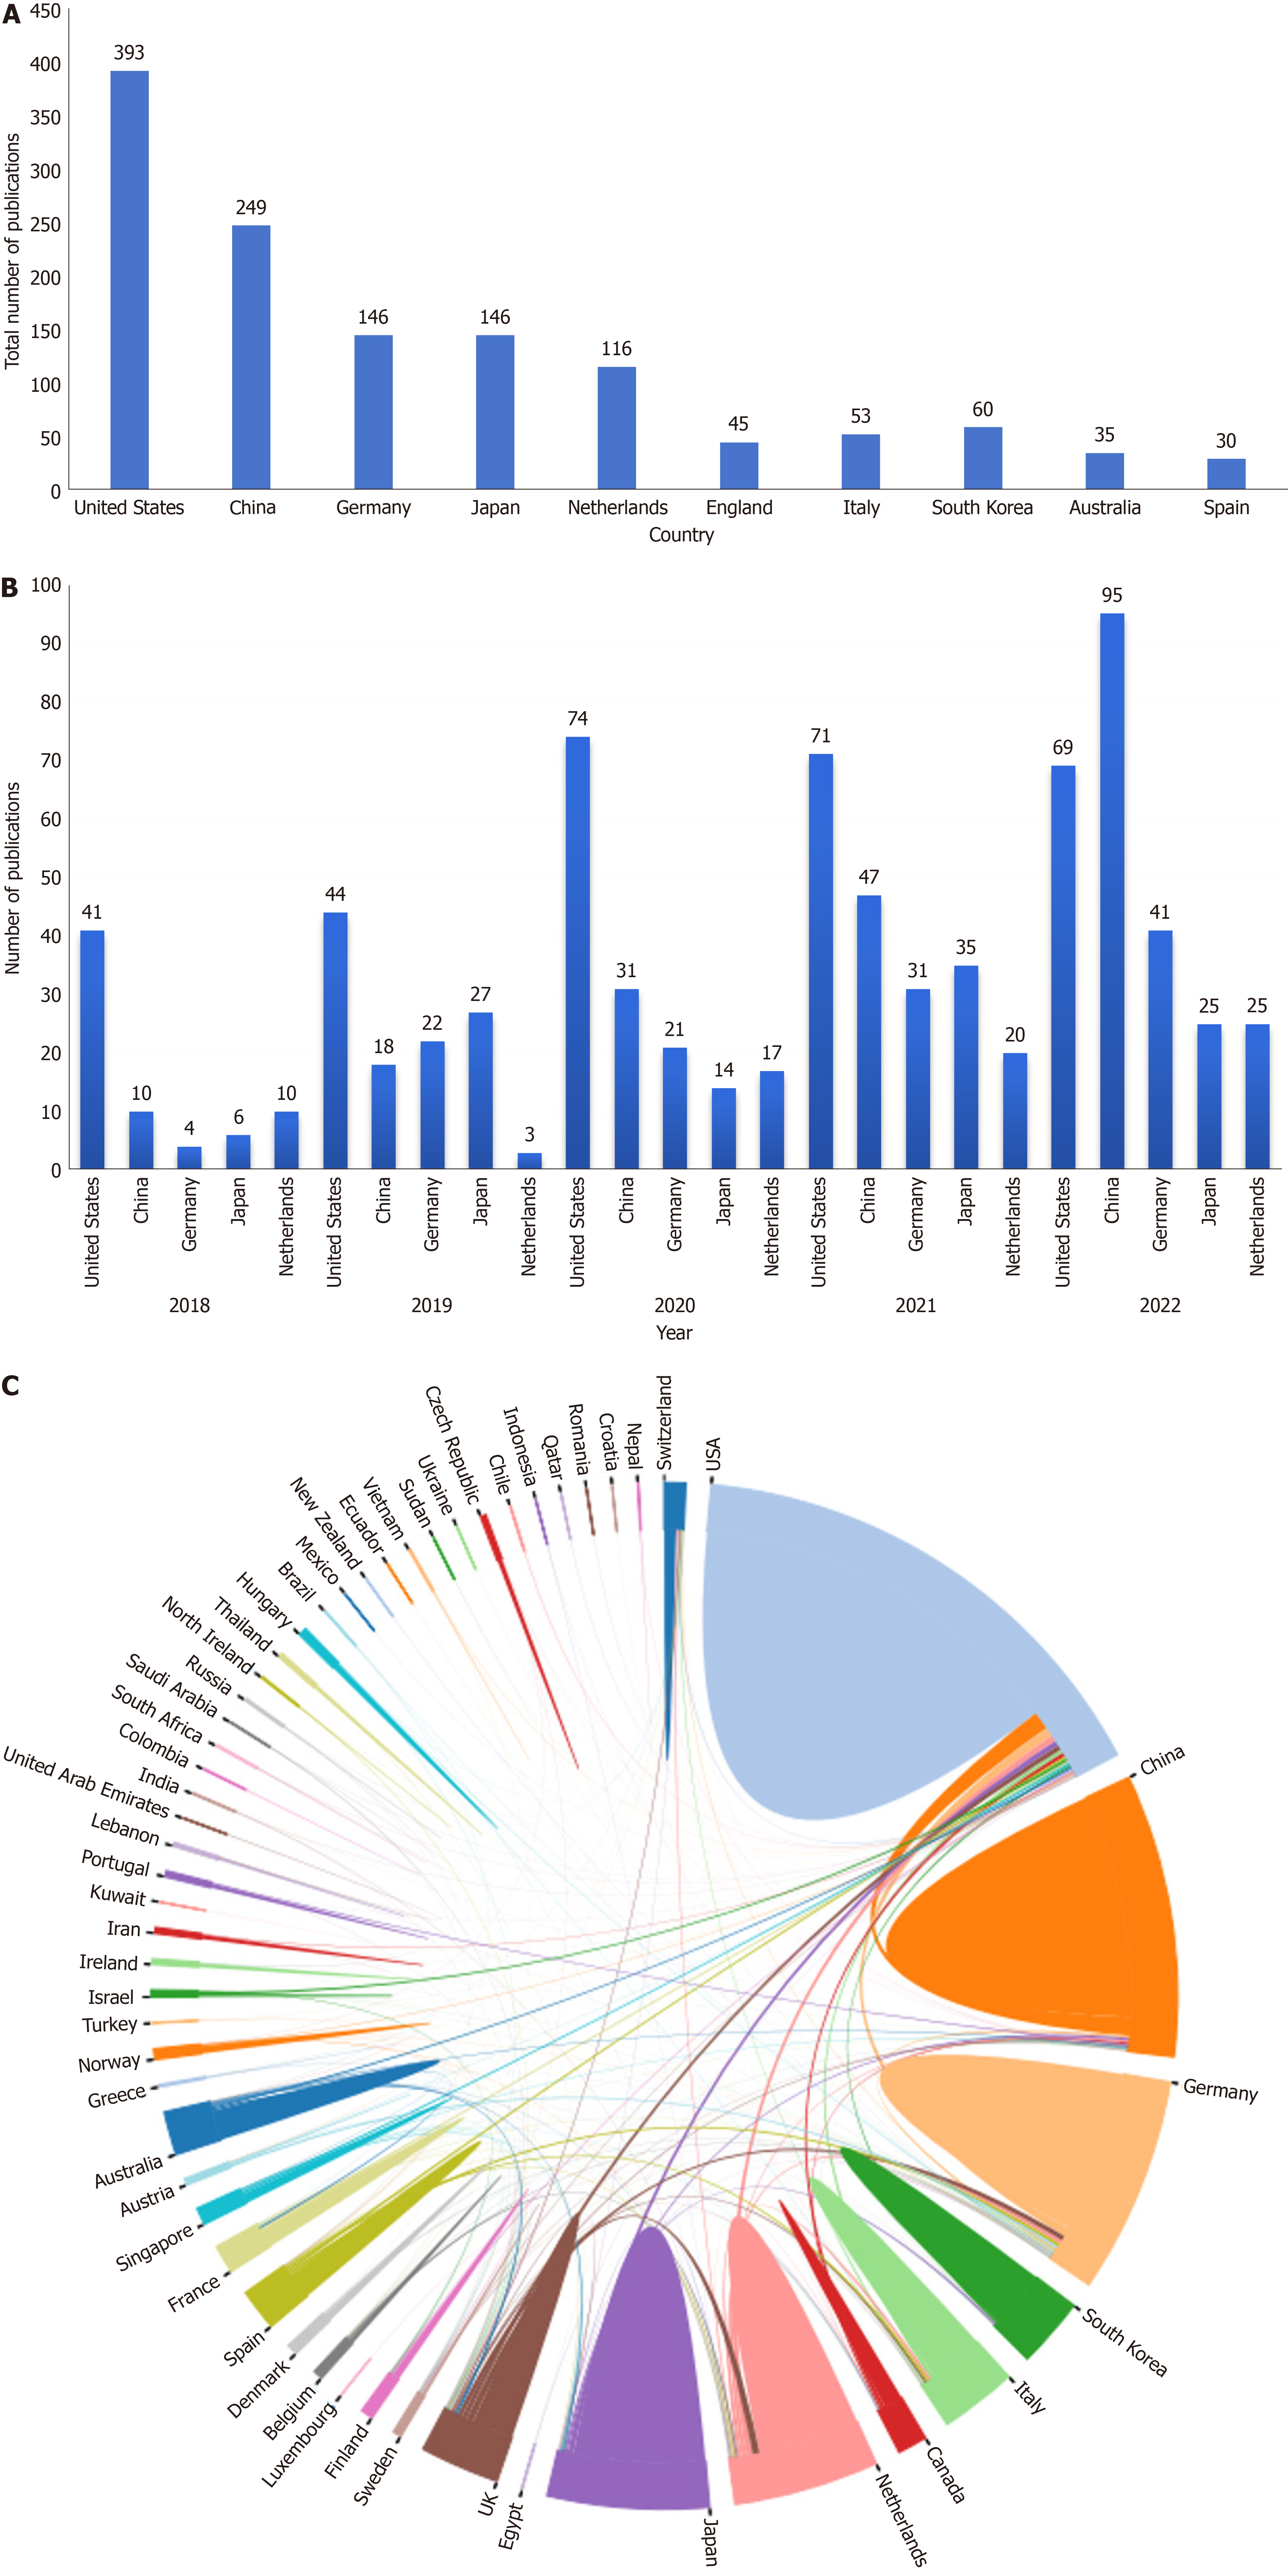
Figure 2 Countries/regions contributing to gastrointestinal tumor organoid research.
A: Top ten countries with the highest number of publications research on gastrointestinal tumor organoids; B: Trend chart of publications in the top five countries with the highest number of published articles over the past five years; C: Collaborative diagram between different countries in the field of gastrointestinal tumor organoids.
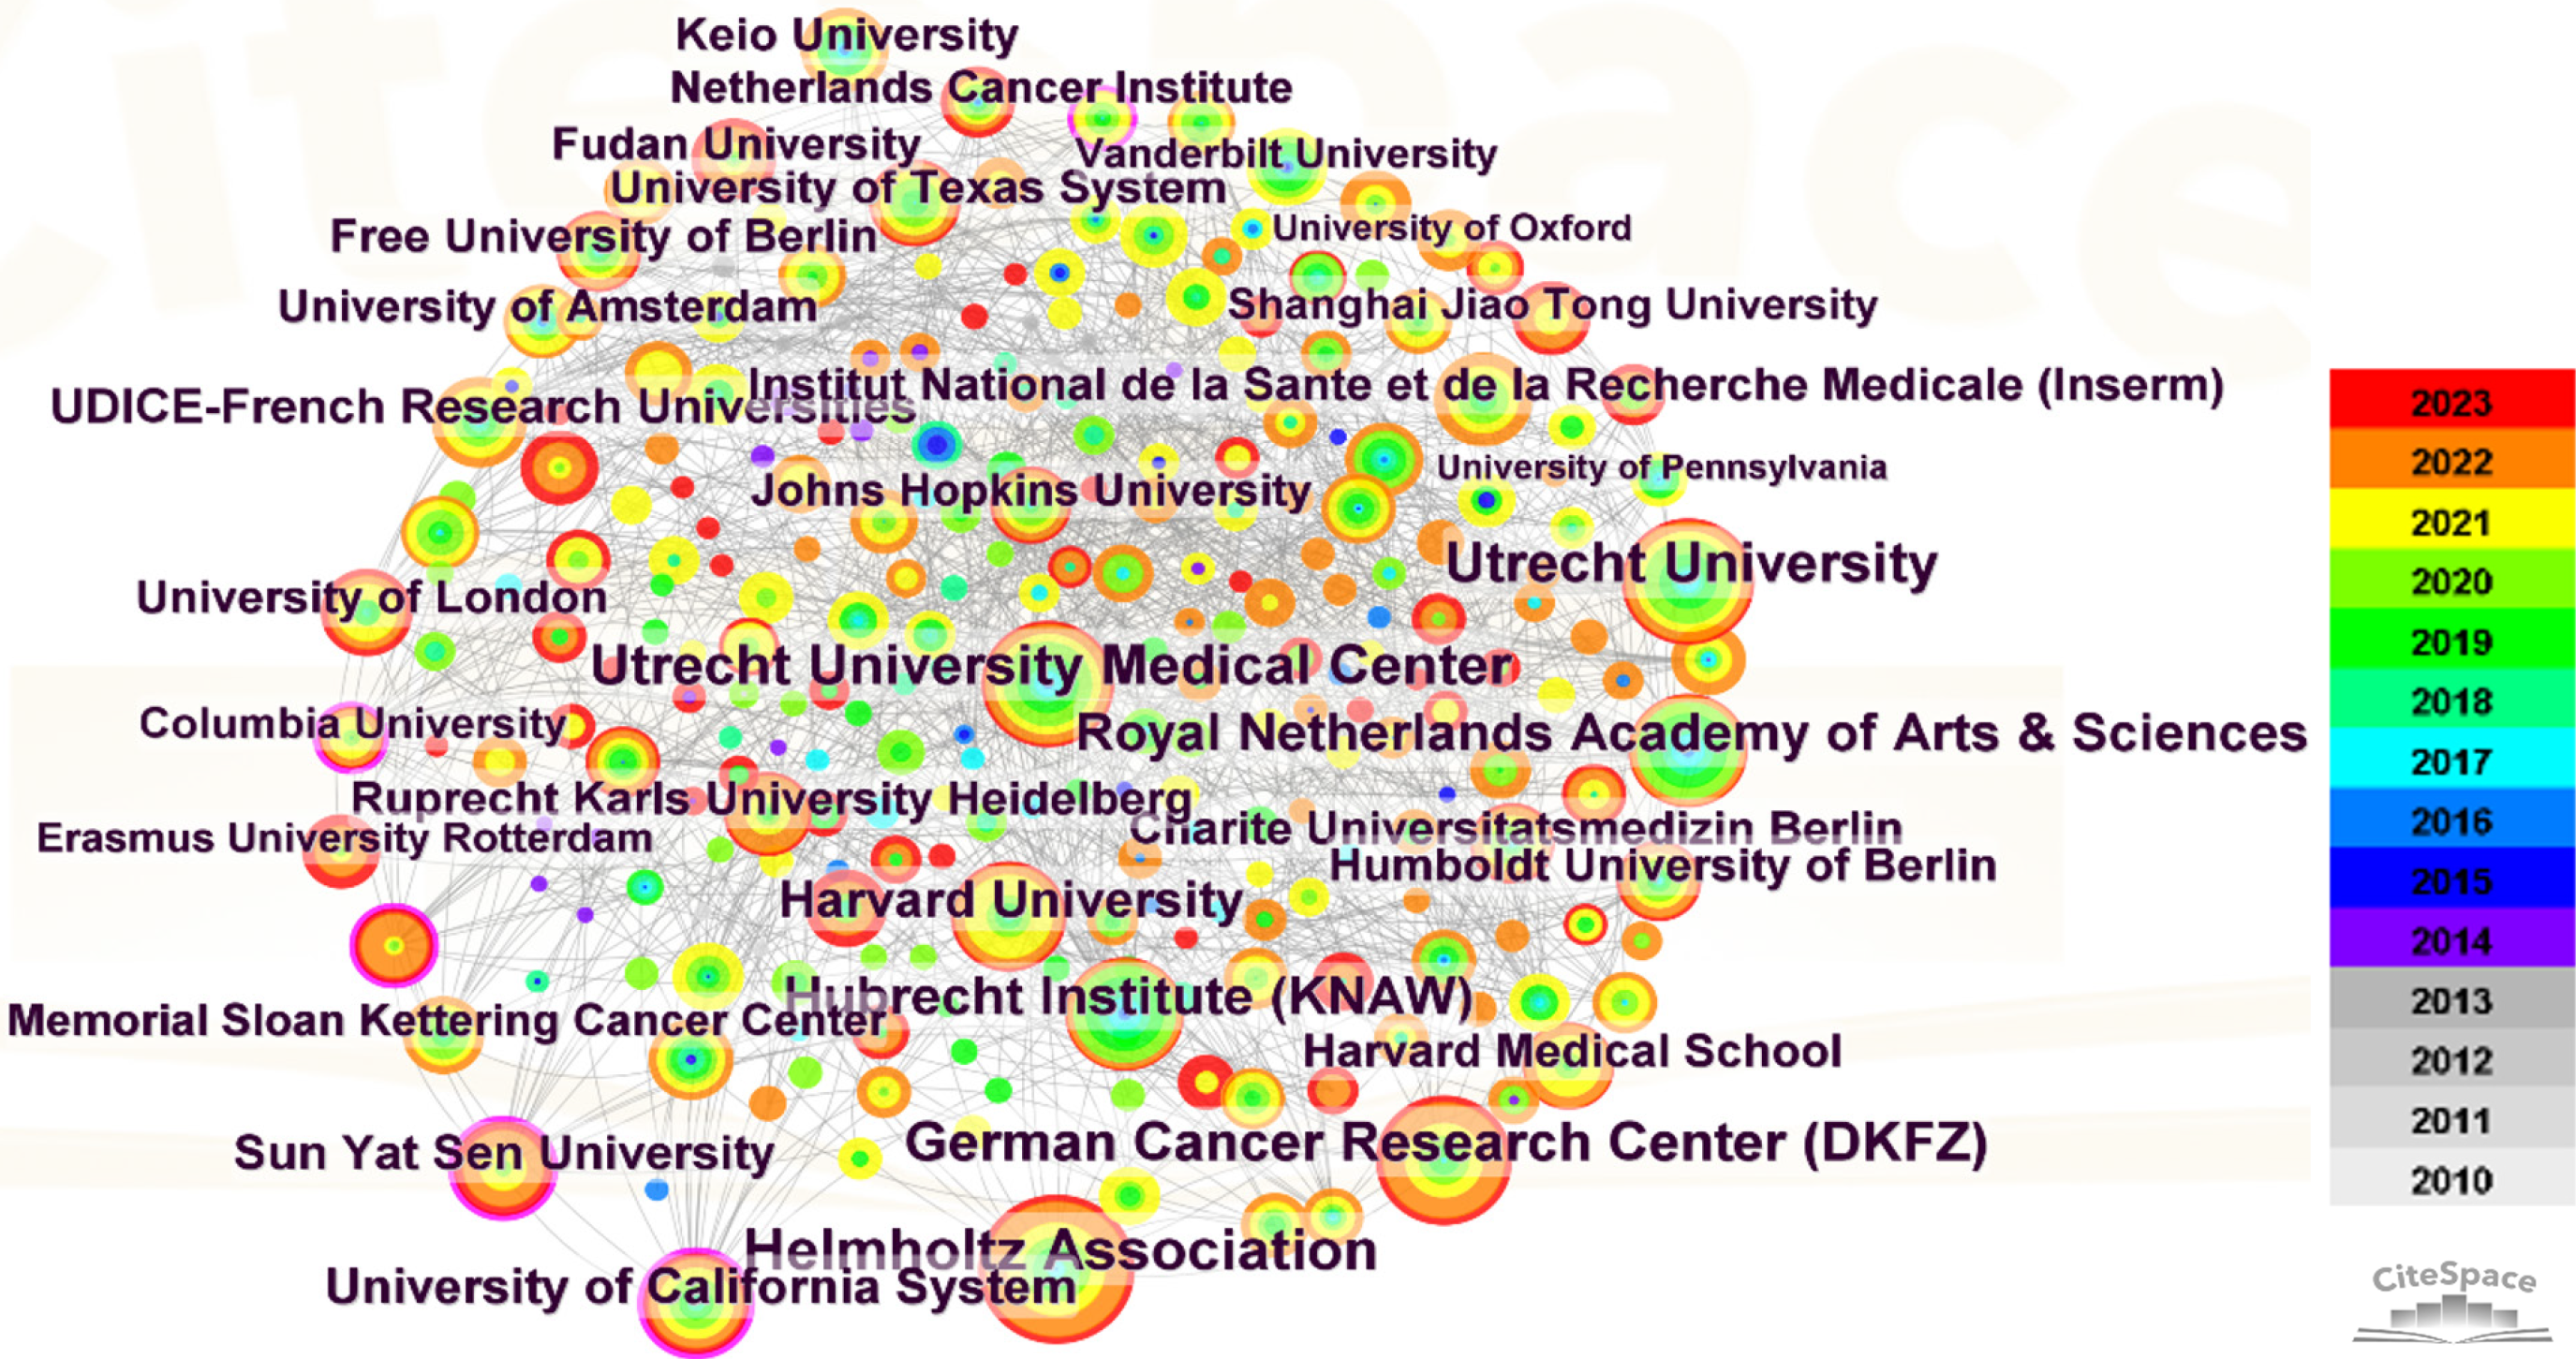
Figure 3 Visualization of the relationship between institutions in the field of gastrointestinal tumor organoids.
The nodes in the figure represent different institutions, and the size of the nodes represents the number of research achievements of the institutions. Different colors represent different years, and the lines between the circles represent cooperative relationships between institutions.
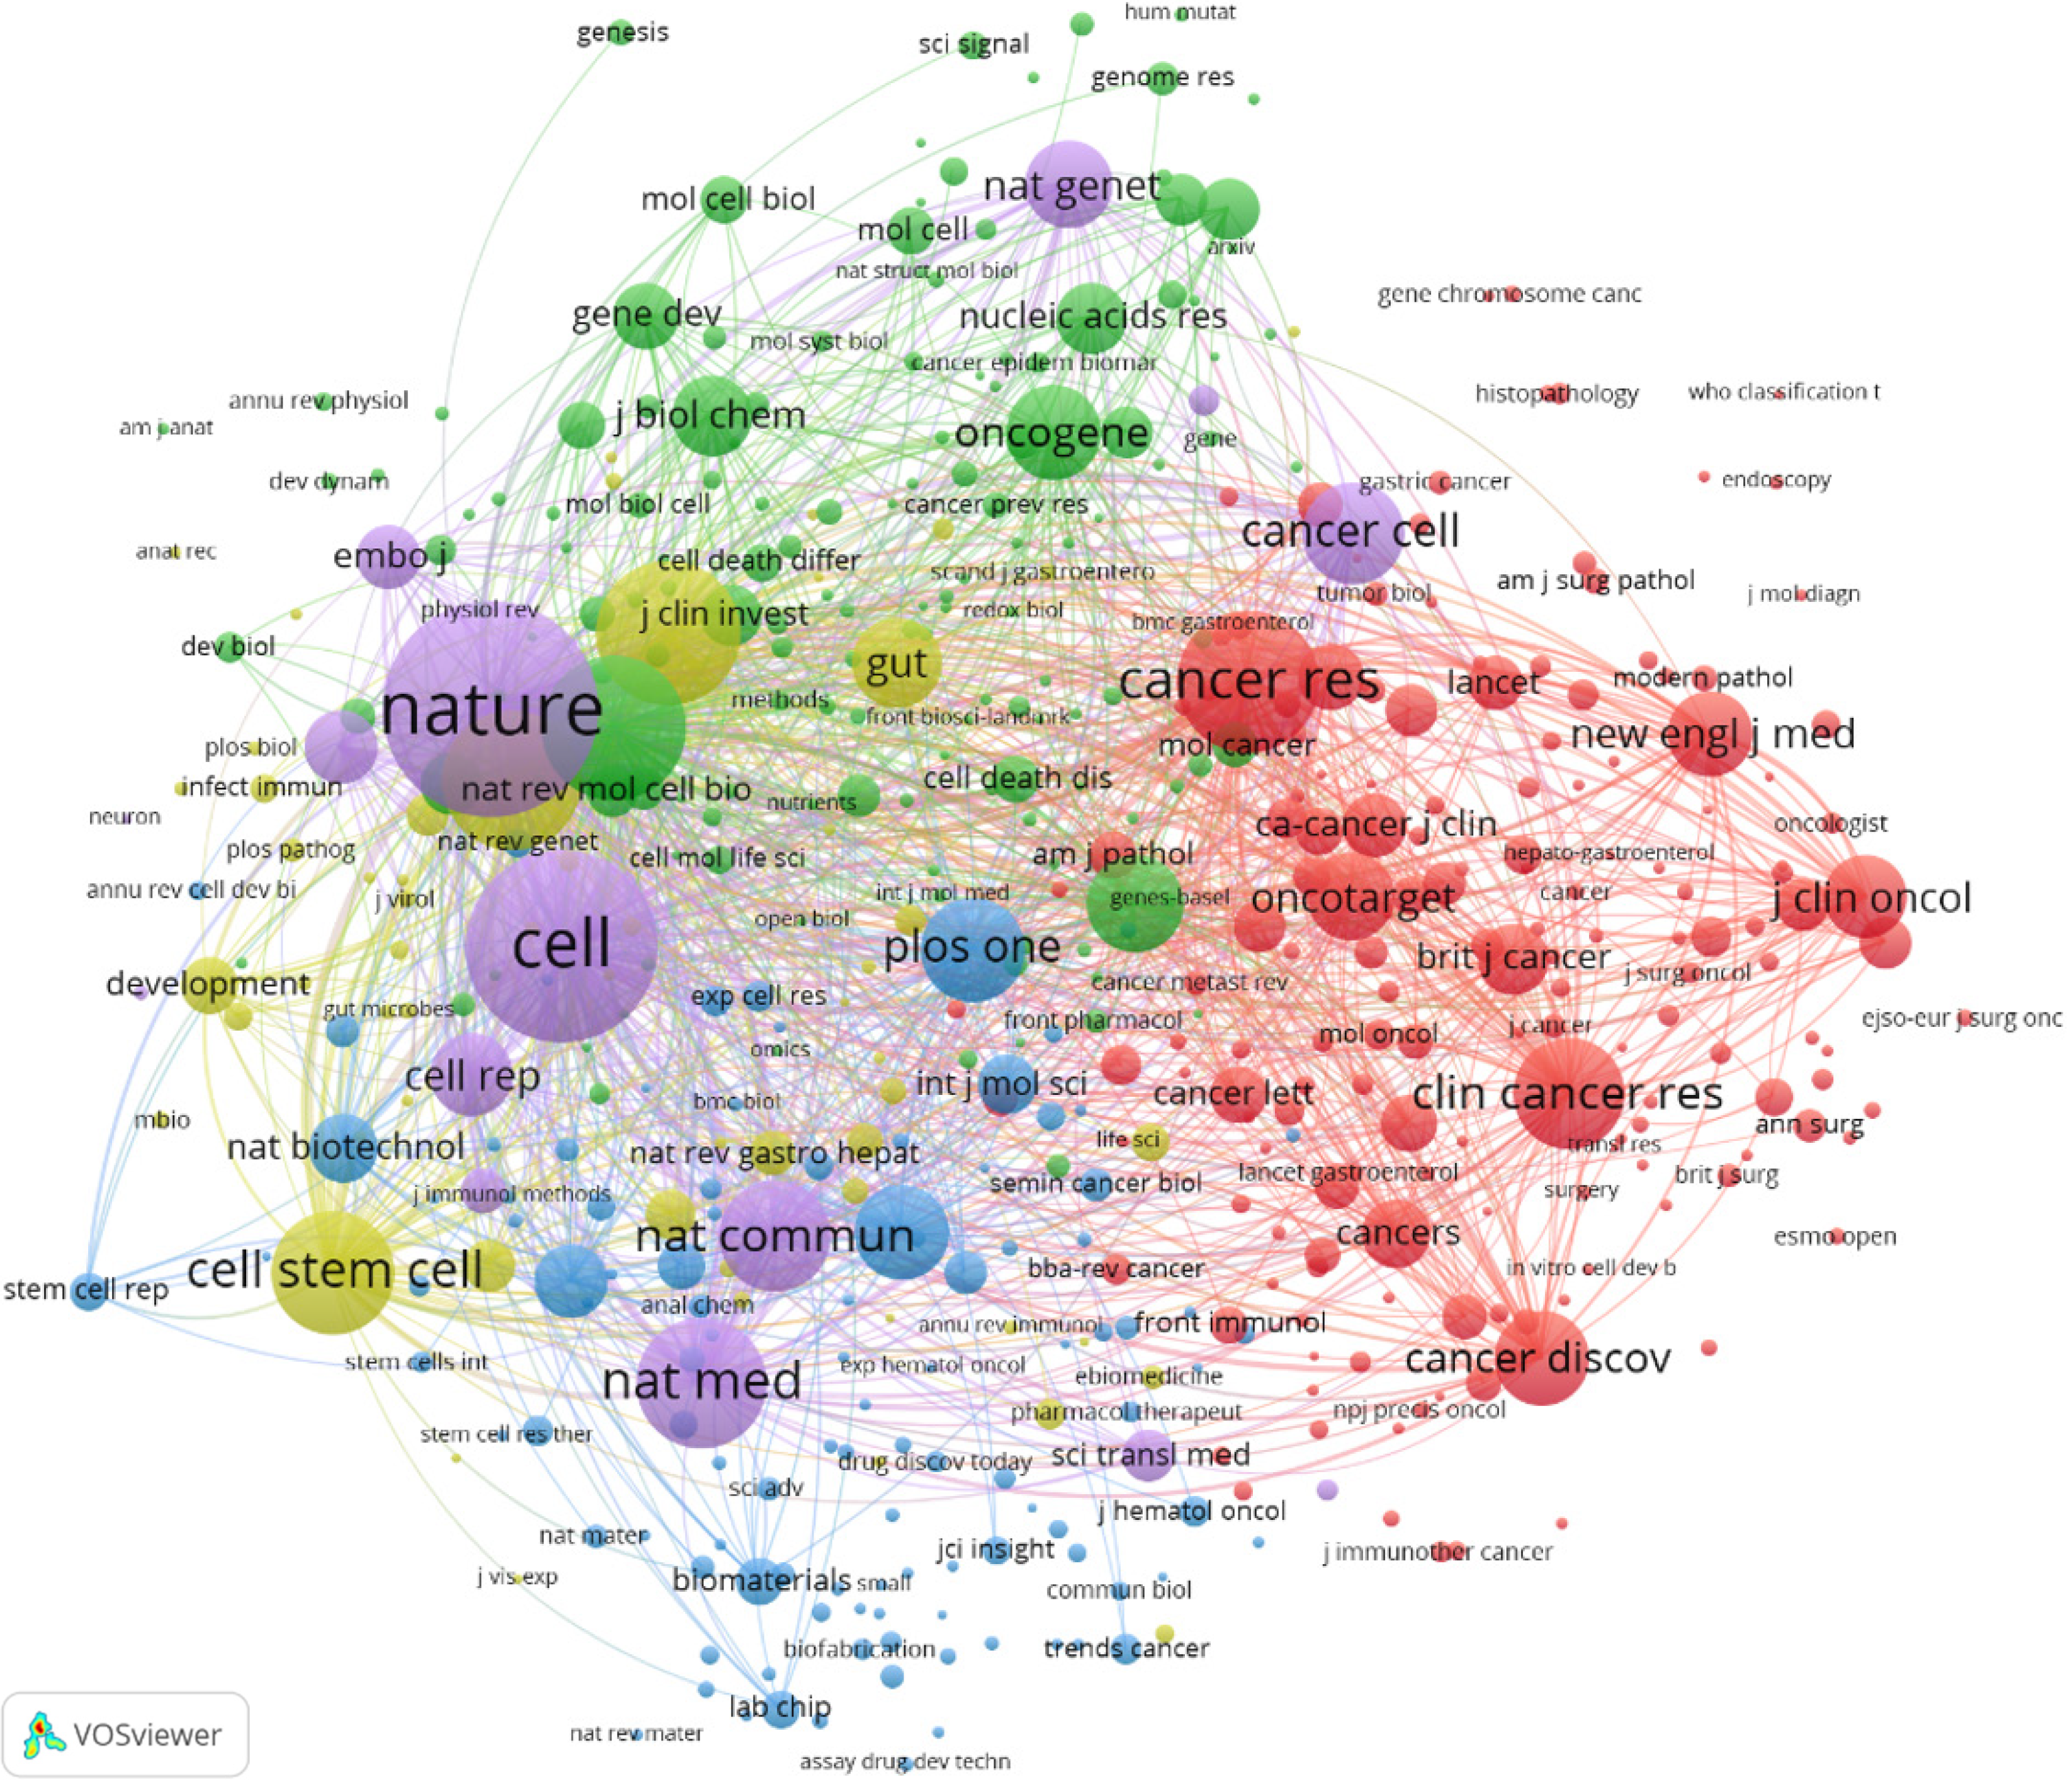
Figure 4 Visualization images of the journal co-citation network in the field of gastrointestinal tumor organoids.
Each node represents a journal, while larger nodes represent more co-citations. The lines between nodes represent co-citation relationships, while thicker lines indicate more co-citation relationships. Different colors represent different clusters.
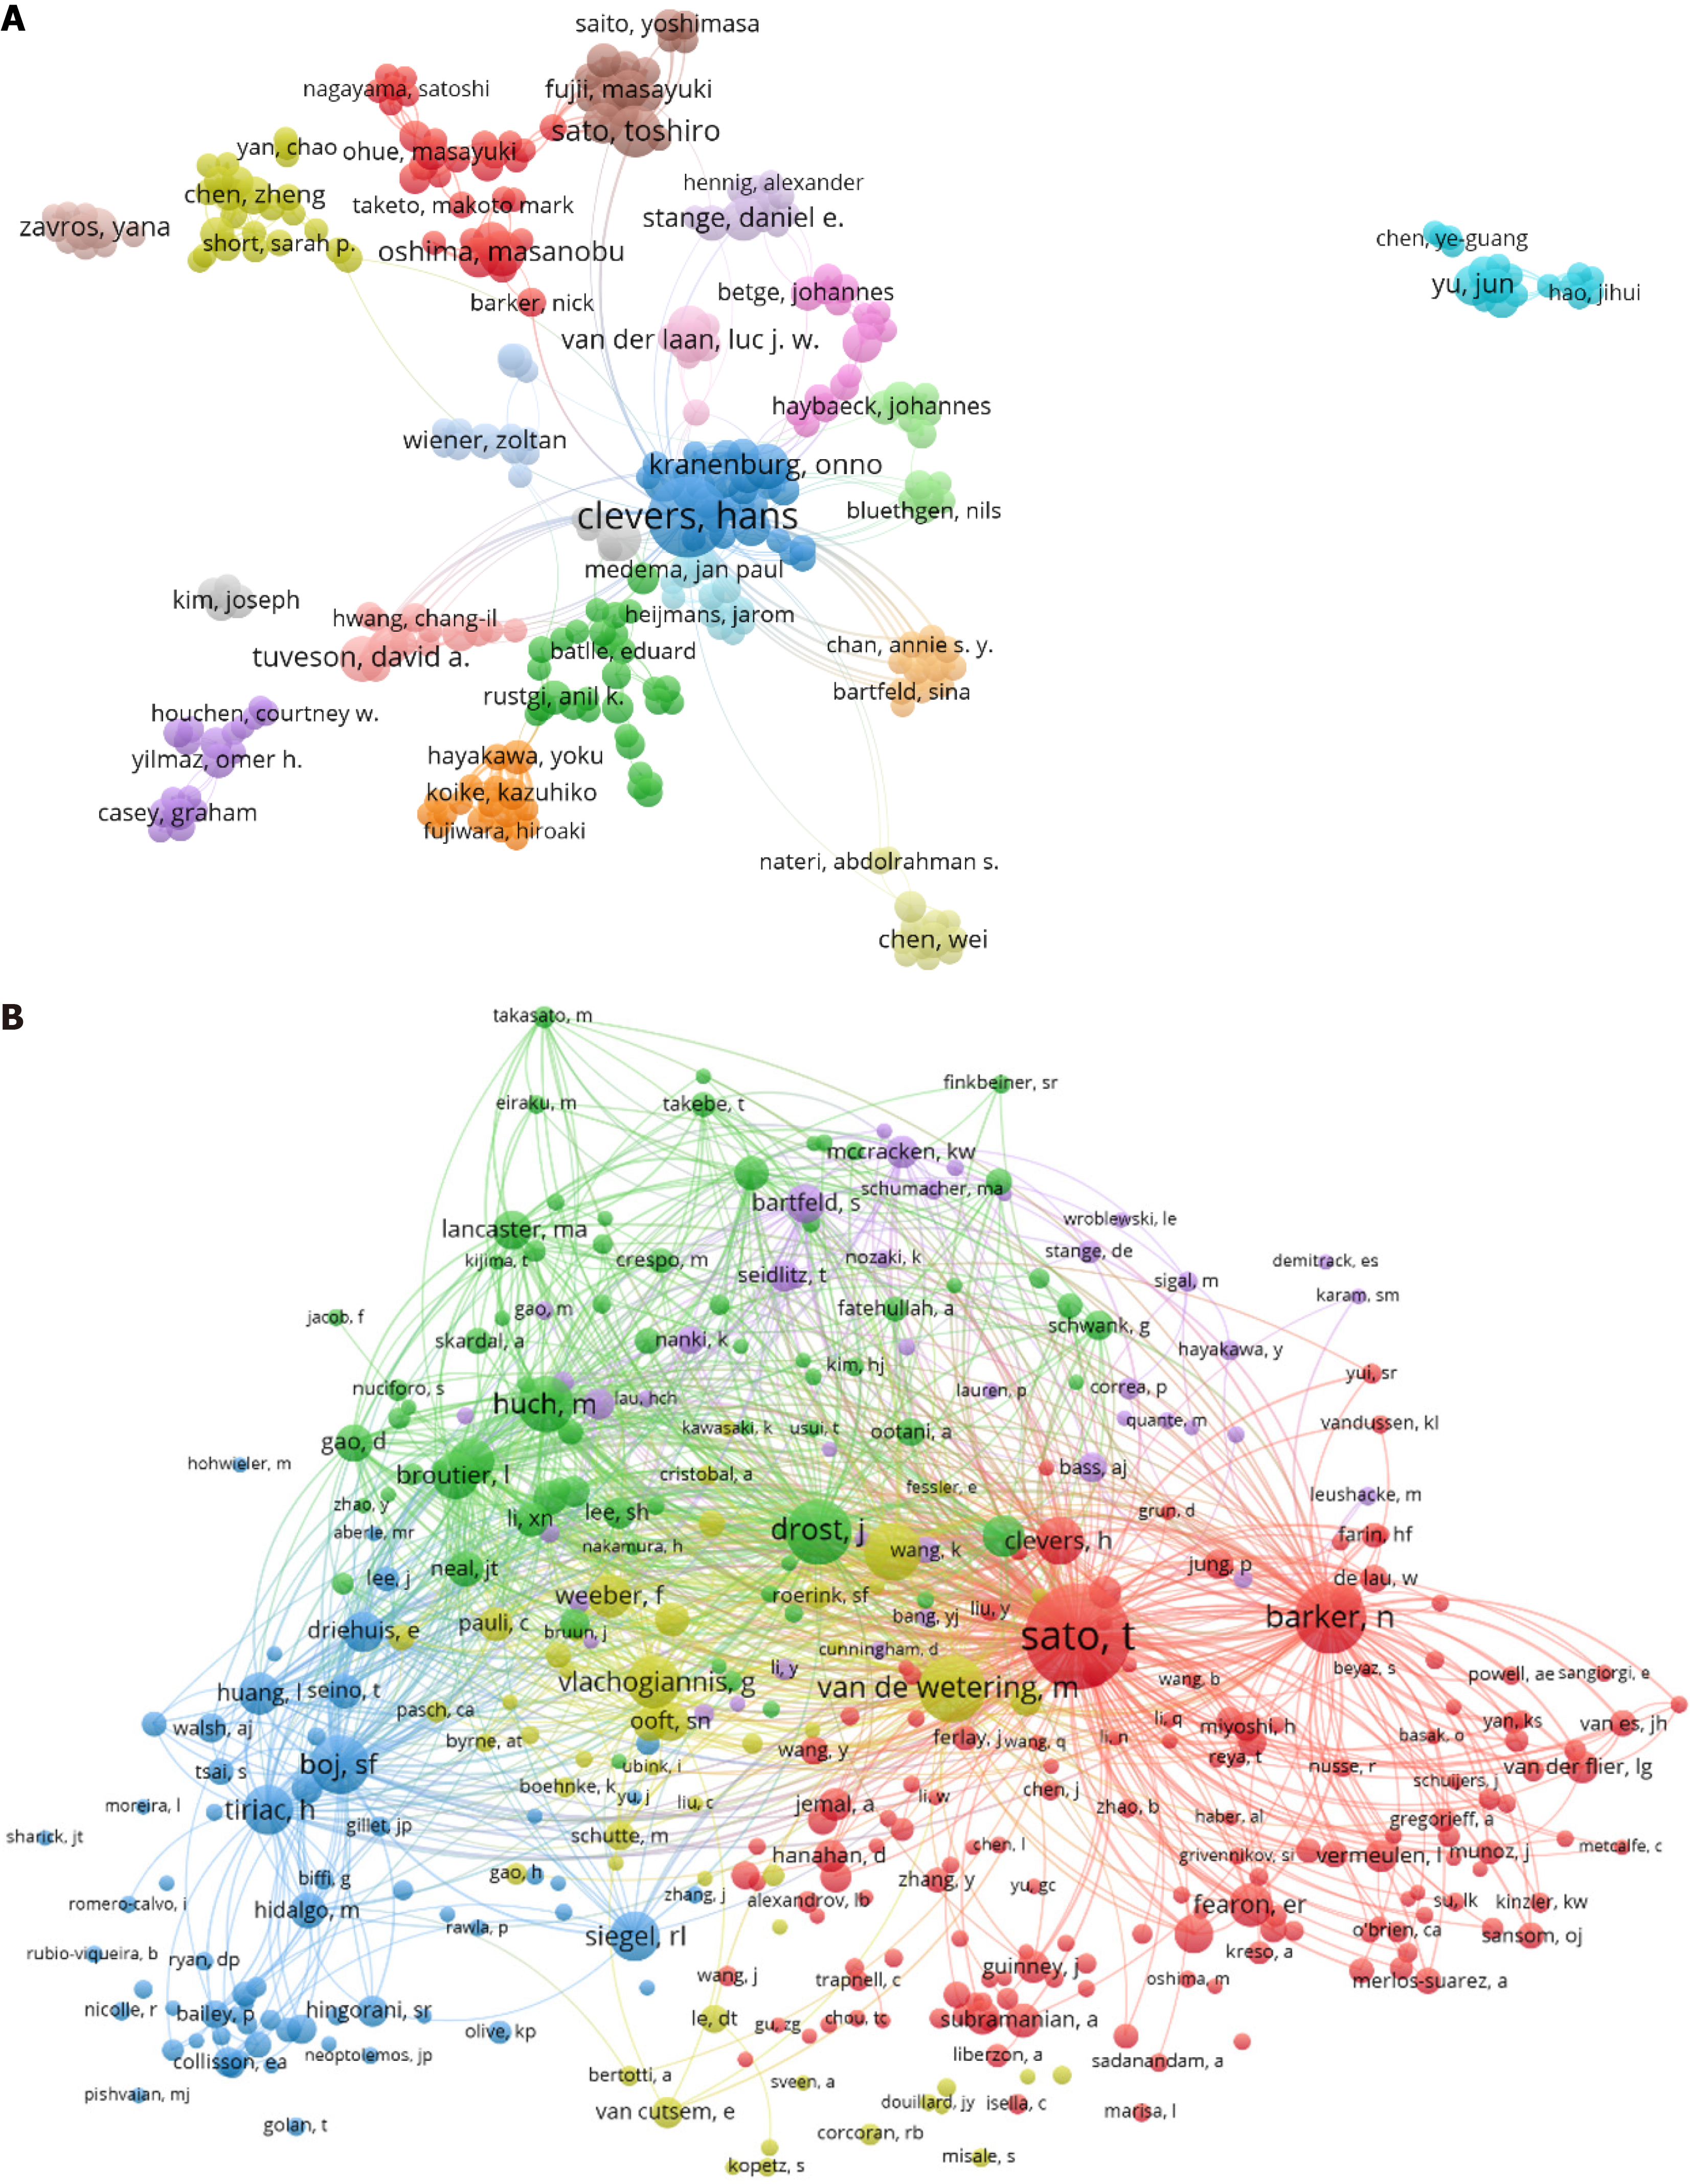
Figure 5 Co-authorship and co-citation analysis of influential authors.
A: A collaborative network view among authors in the field of gastrointestinal tumor organoid research. Each node represents an author, and the size of the node represents the number of publications. The connection between the two nodes indicates a cooperative relationship; B: Visualization of co-citation authors in the field of gastrointestinal tumor organoids. The size of the nodes is proportional to the total number of citations. The connection between two nodes represents a co-citation relationship, and different colors represent different clusters.
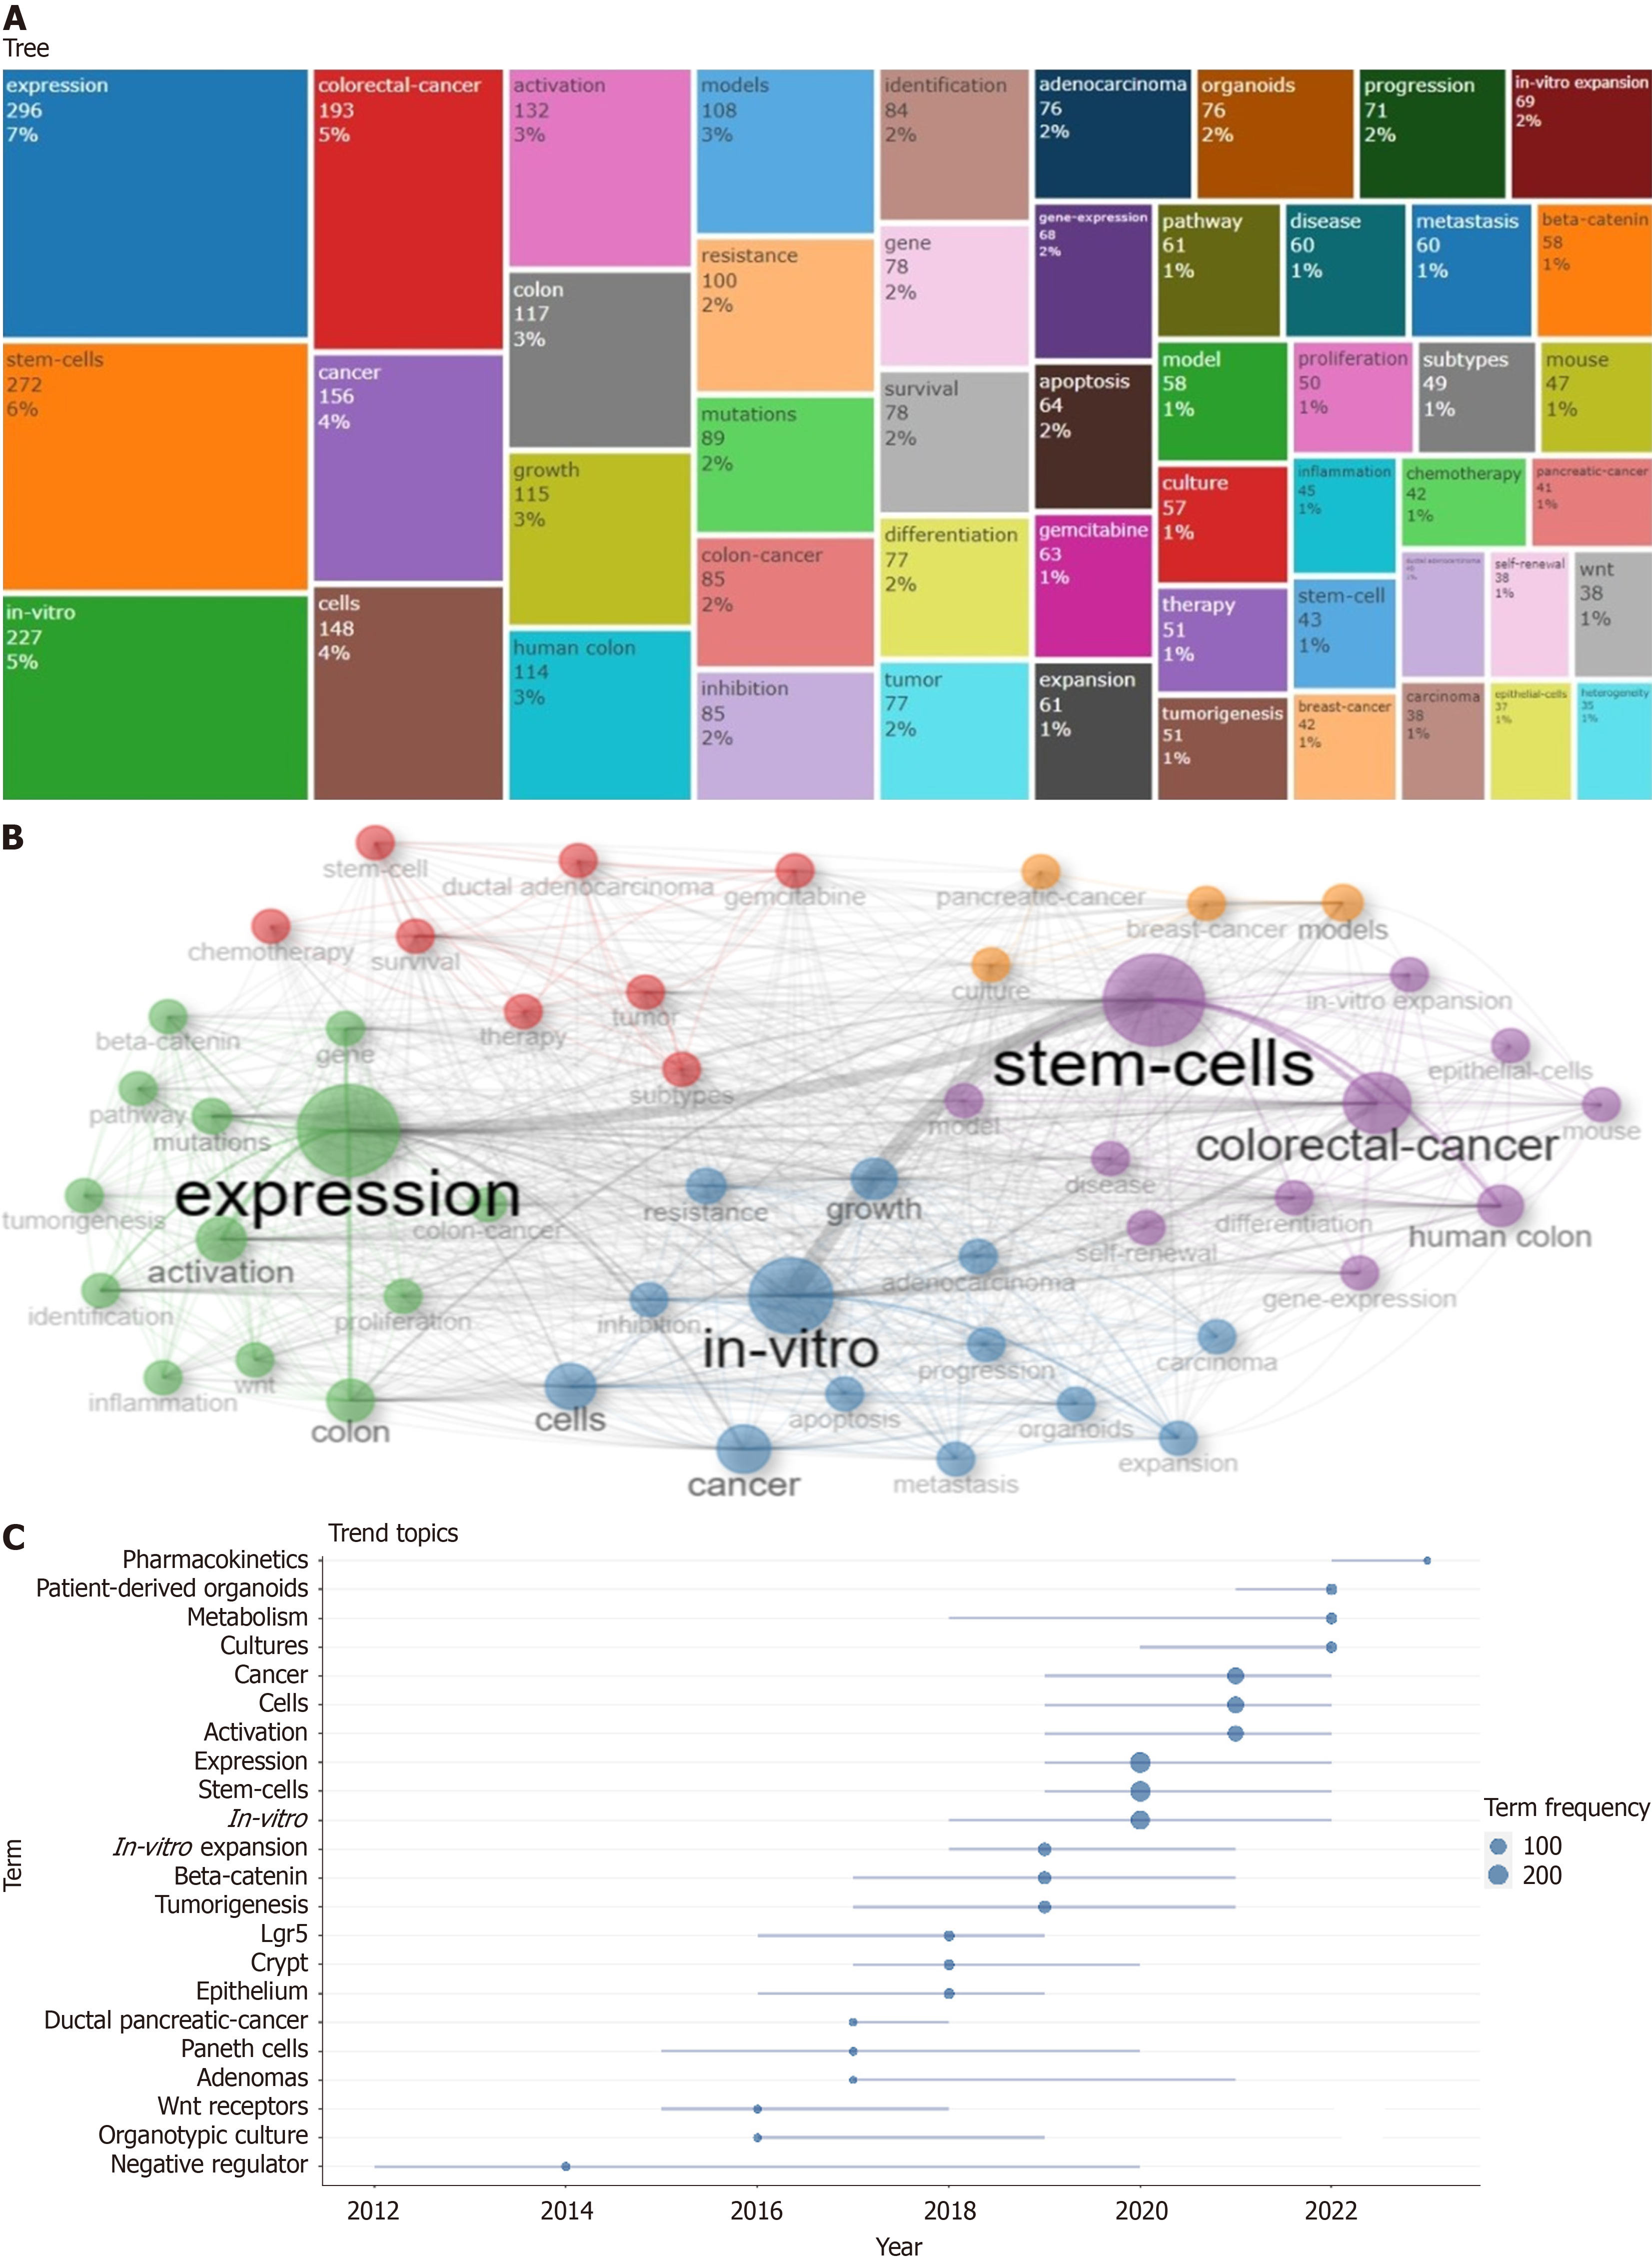
Figure 6 Analysis of keywords.
A: Tree map of keywords in the study of gastrointestinal tumor organoids; B: The keywords co-occurrence network in the field of gastrointestinal tumor organoids; C: A map of trend topic in the field of gastrointestinal tumor organoids between 2012 and 2023. The size of the circle is positively correlated with its frequency of occurrence.
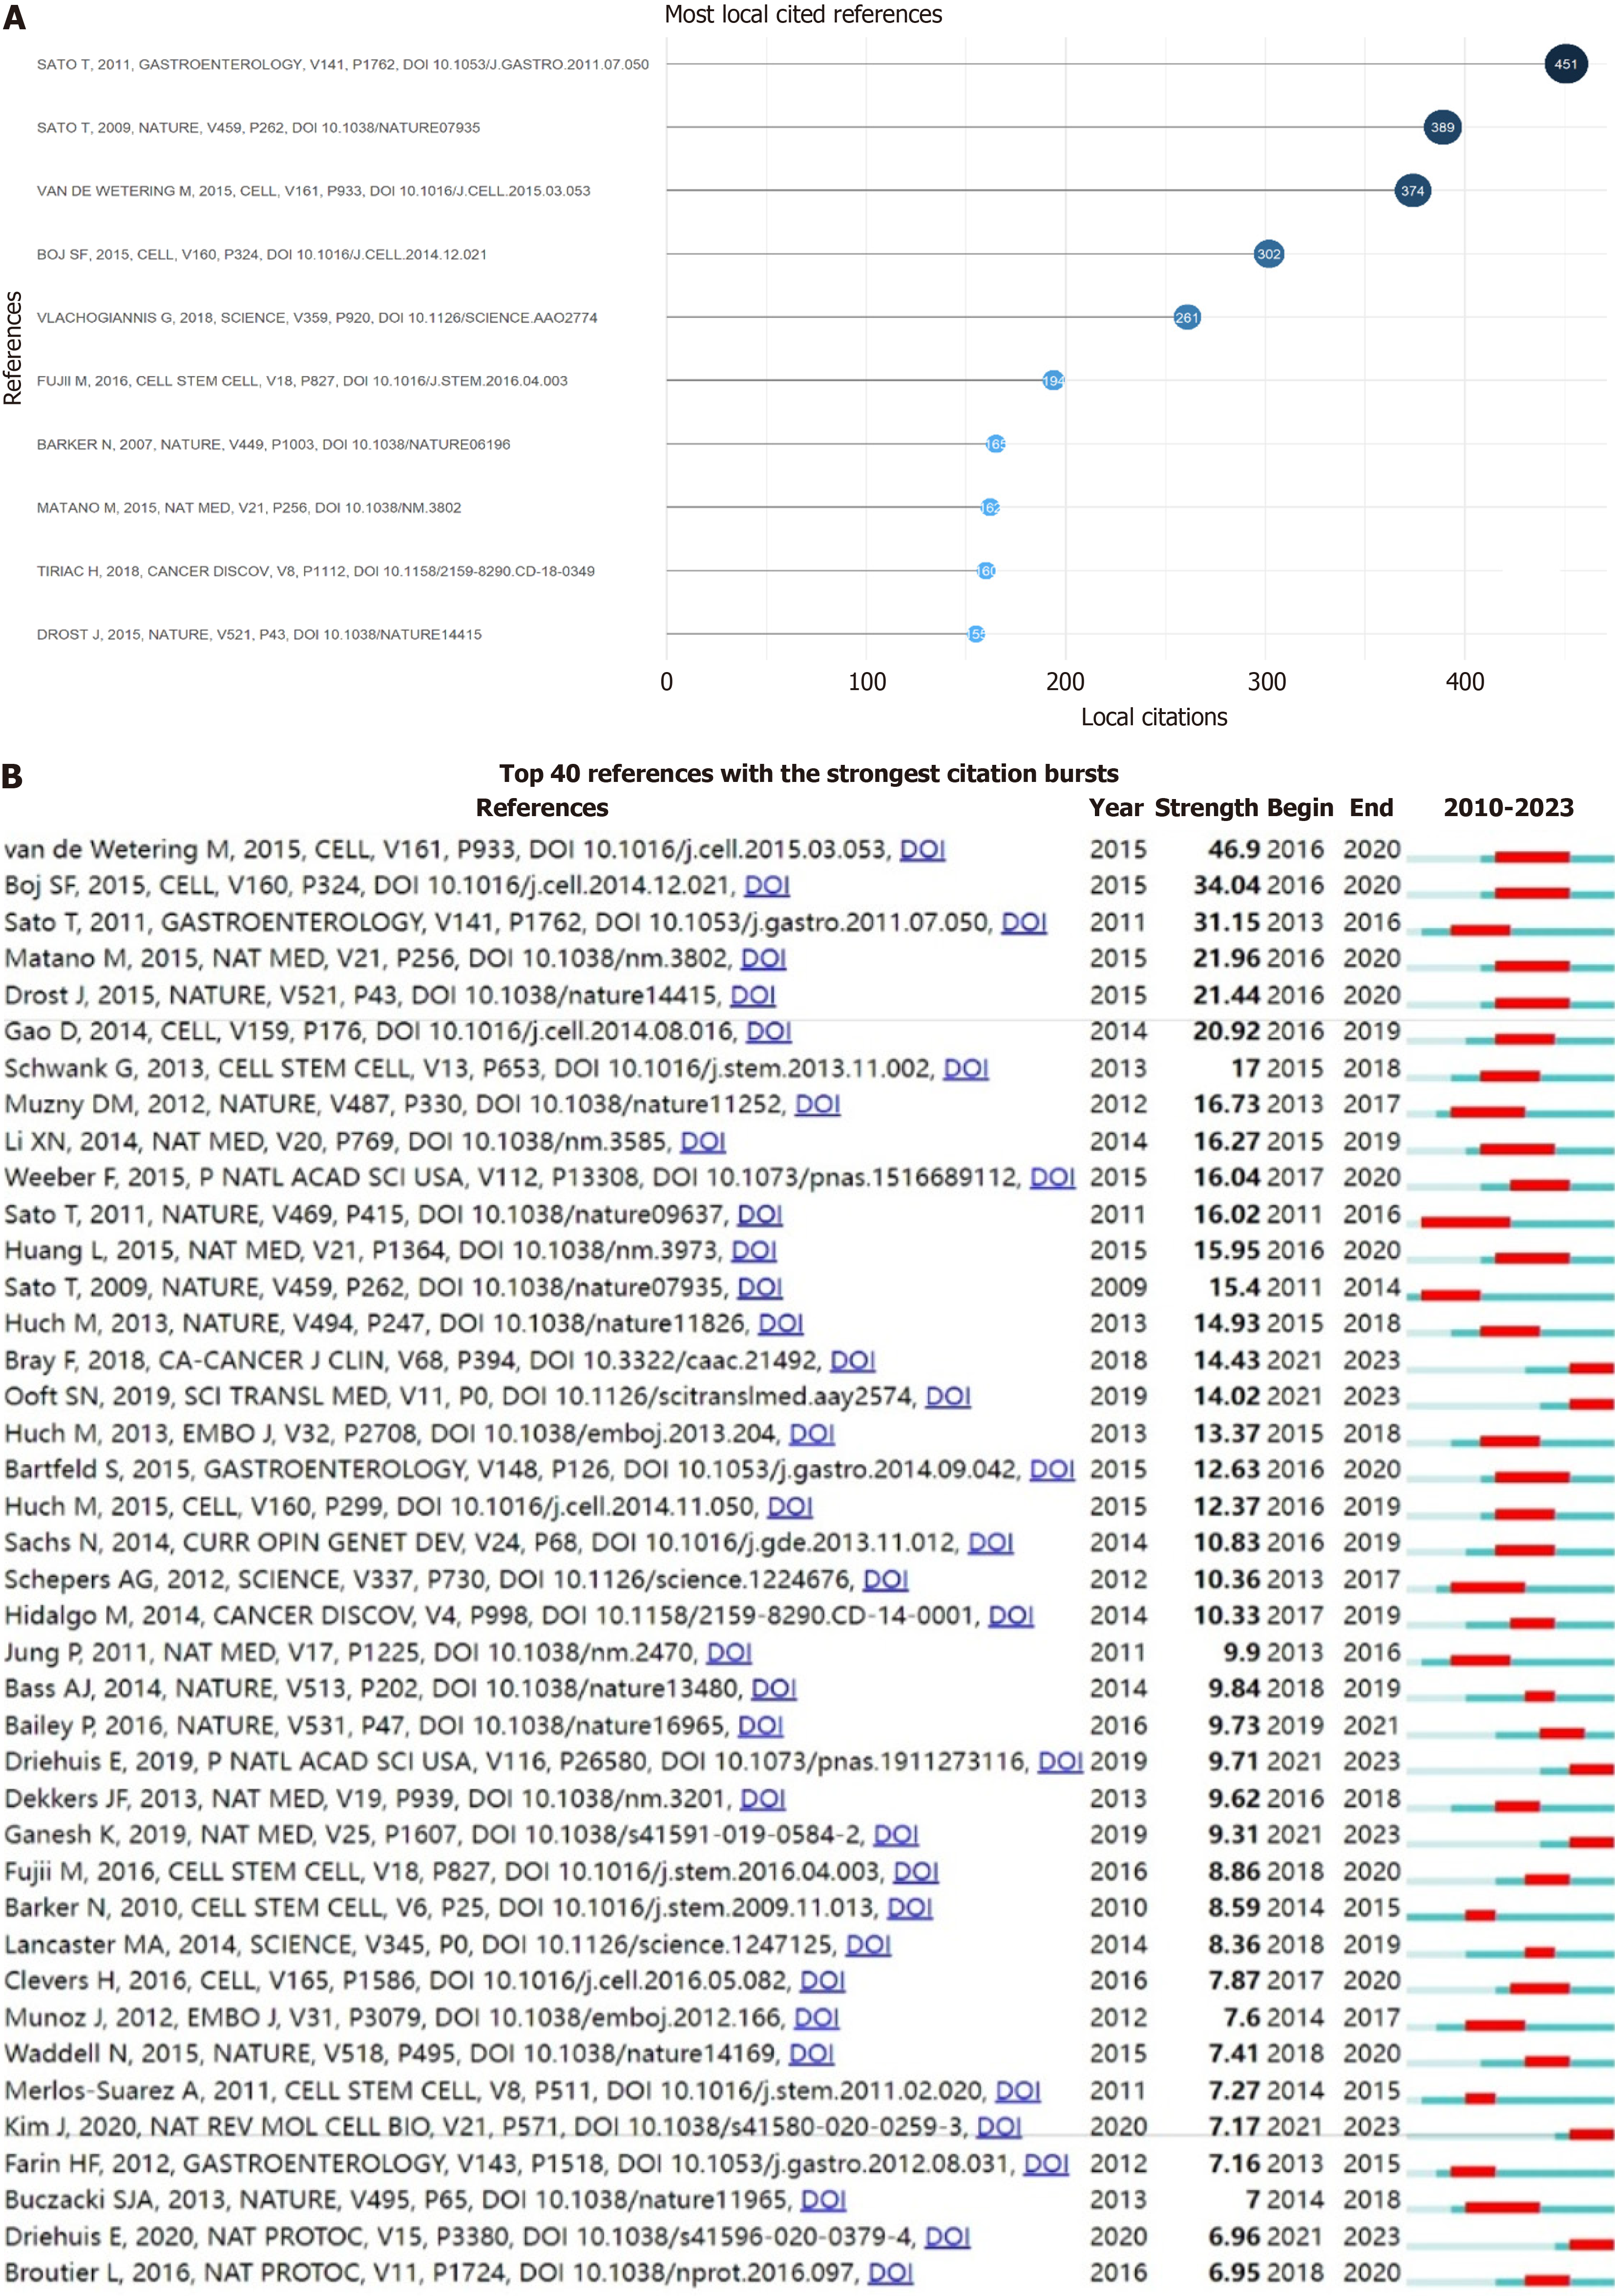
Figure 7 Analysis of reference citation and burst.
A: Top ten references with the highest number of local citations in the field of gastrointestinal tumor organoids; B: The top forty references with the most citation bursts.
- Citation: Wang G, Liu T, He WT. Visualization analysis of research hotspots and trends on gastrointestinal tumor organoids. World J Gastrointest Oncol 2024; 16(6): 2826-2841
- URL: https://www.wjgnet.com/1948-5204/full/v16/i6/2826.htm
- DOI: https://dx.doi.org/10.4251/wjgo.v16.i6.2826


