Copyright
©The Author(s) 2024.
World J Gastrointest Oncol. Mar 15, 2024; 16(3): 819-832
Published online Mar 15, 2024. doi: 10.4251/wjgo.v16.i3.819
Published online Mar 15, 2024. doi: 10.4251/wjgo.v16.i3.819
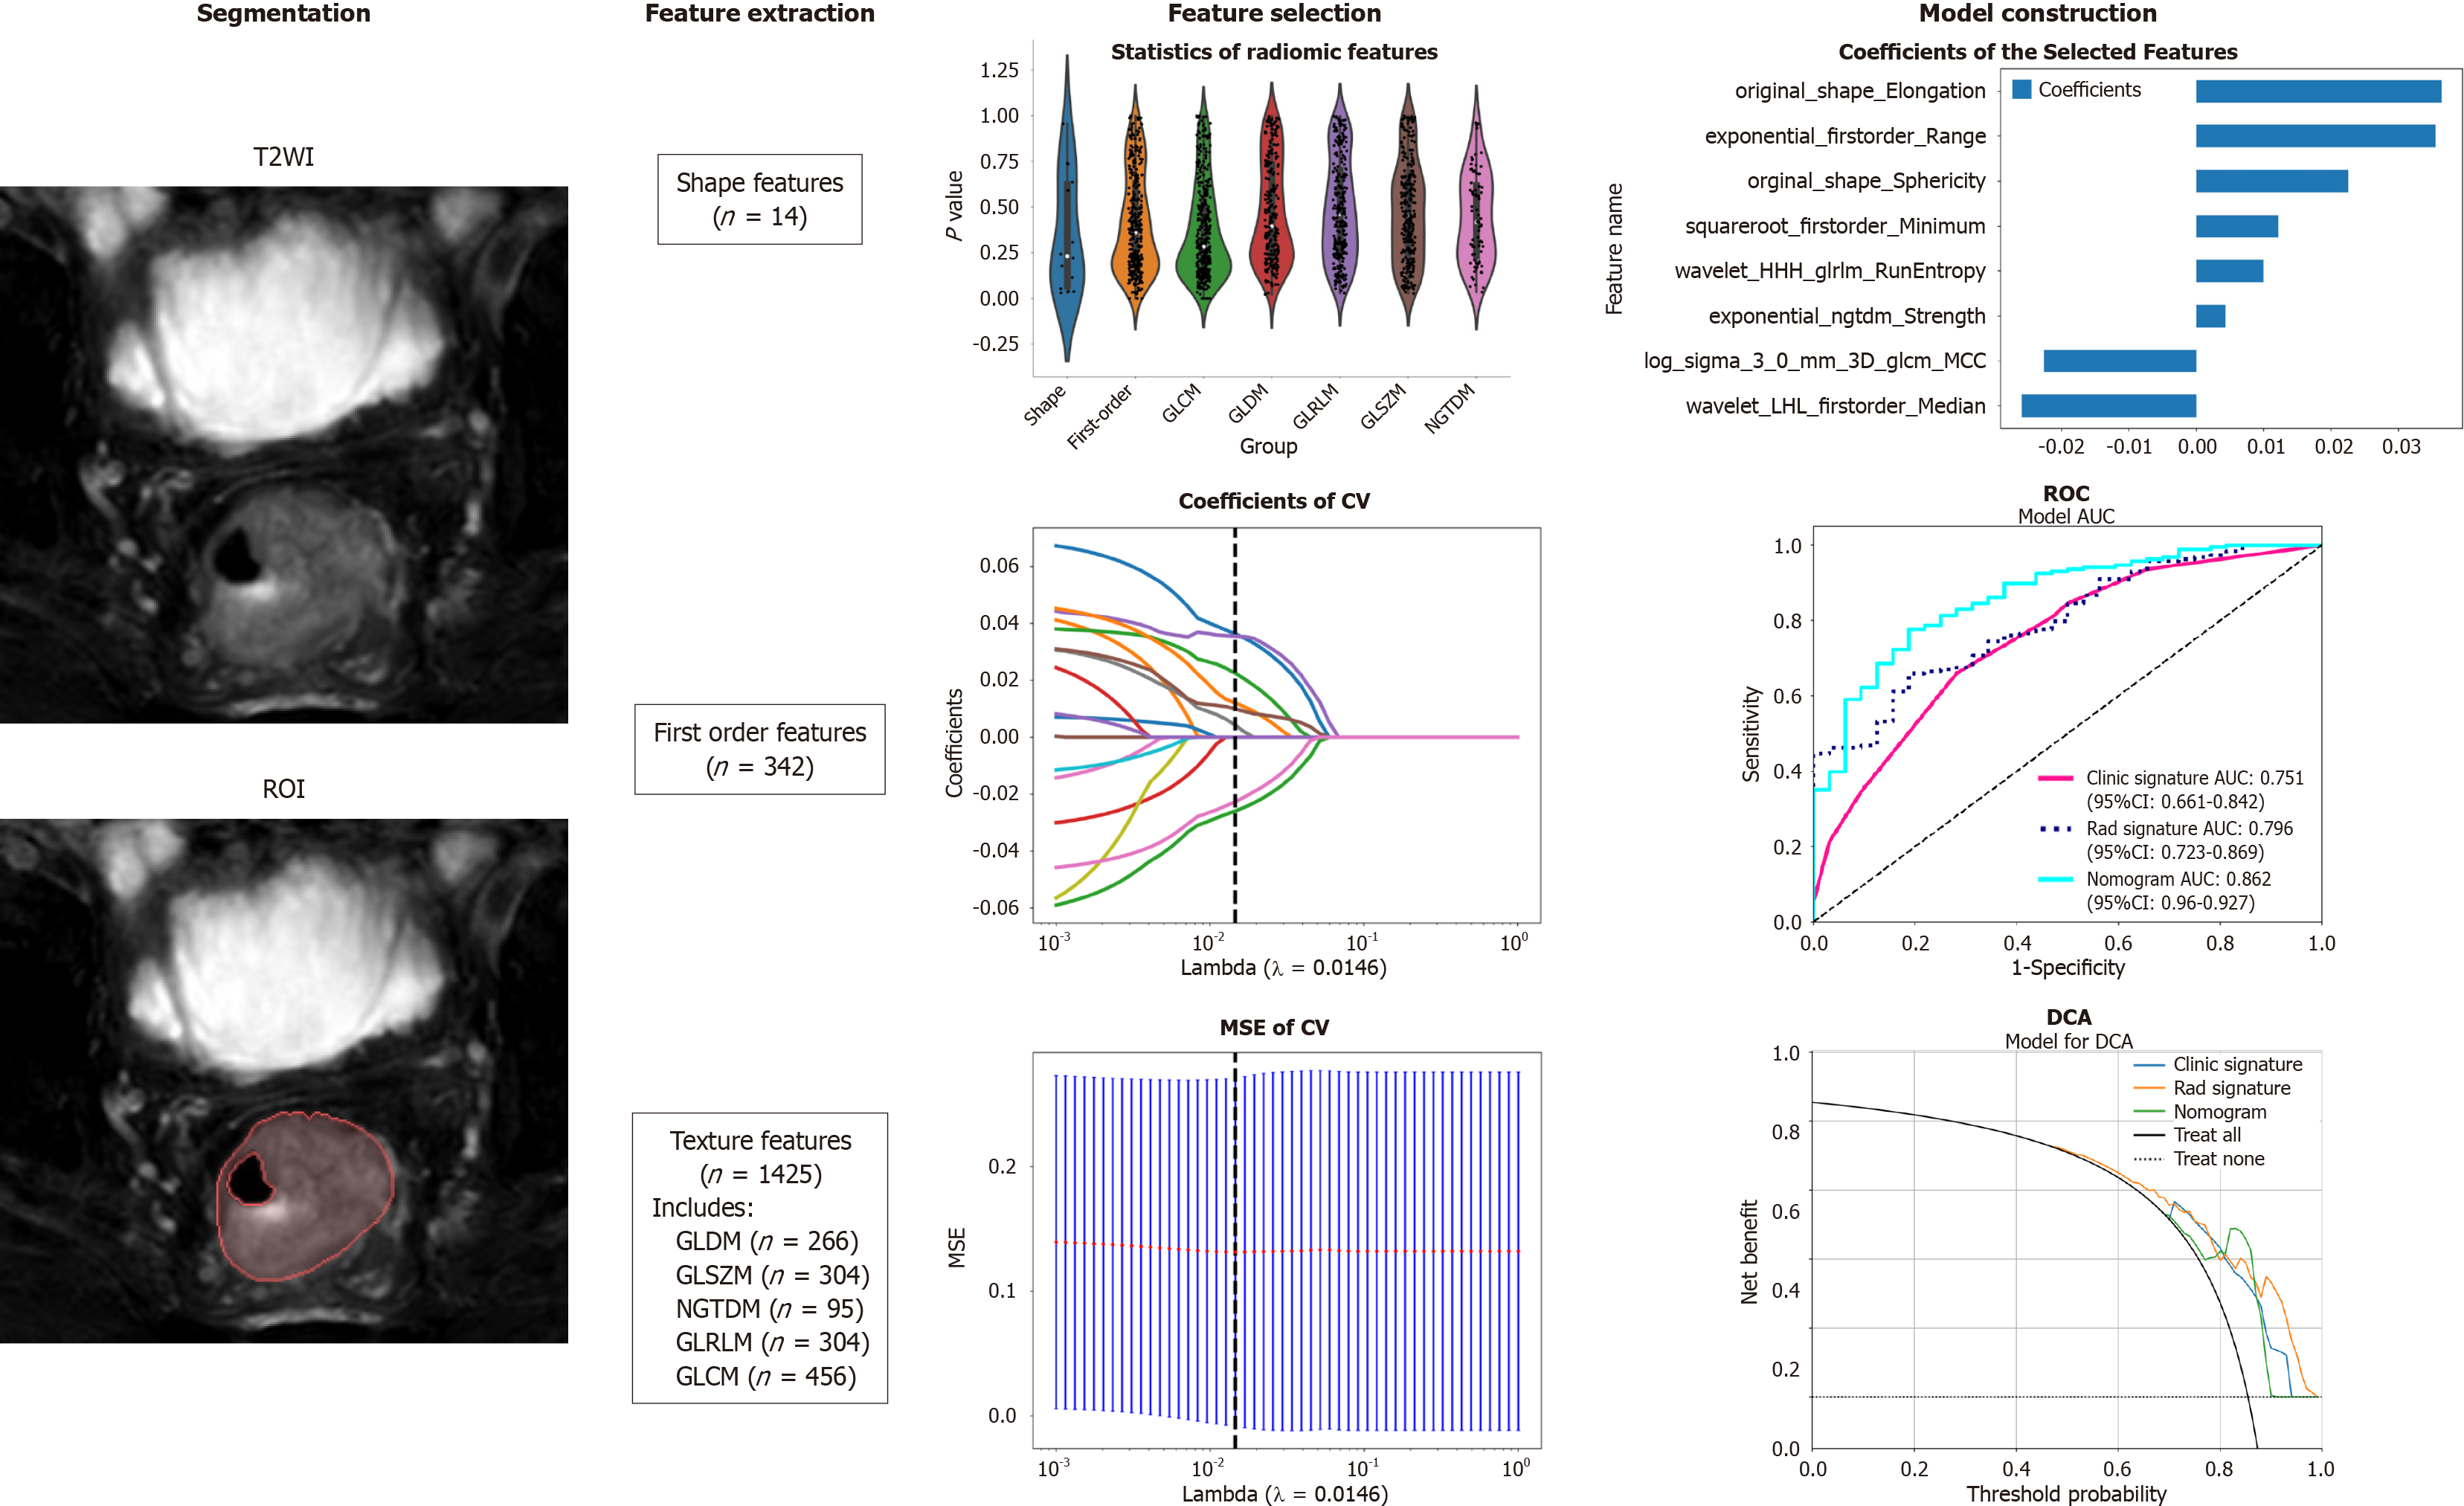
Figure 1 Workflow of the study.
The workflow for constructing a machine learning model based on T2-weighted images to predict the differentiation degree of colorectal cancer patients included segmentation, feature extraction, feature selection, model construction and validation. ROI: Region of intrest; CV: Cross validation; MSE: Mean square error; ROC: Receiver operating characteristic; DCA: Decision curve analysis; GLCM: Grayscale co-occurrence matrix; GLRLM: Grayscale run length matrix; GLSZM: Grayscale size region matrix, NGTDM: Neighbourhood grayscale difference matrix; GLDM: Grayscale dependency matrix.
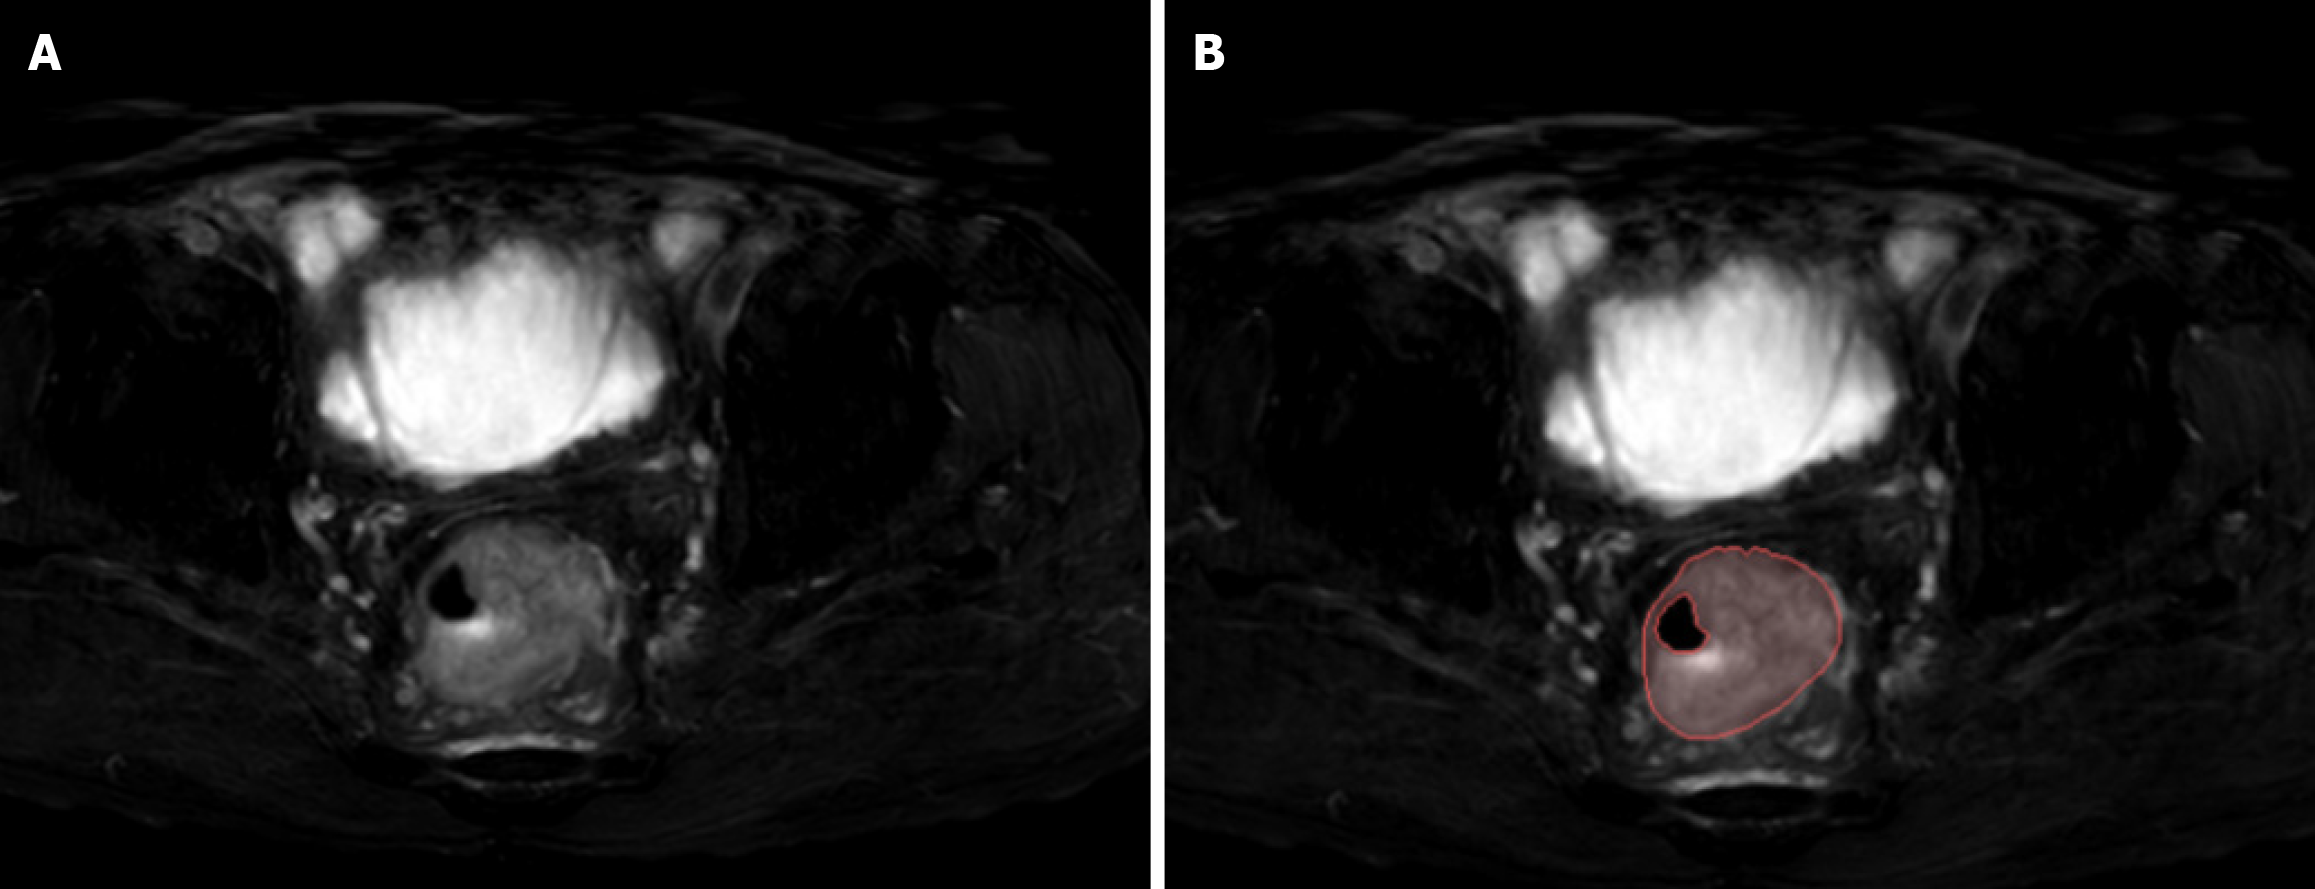
Figure 2 Examples of labelled lesions.
A: Primary lesions of colorectal cancer (CRC) on oblique axial T2-weighted images; B: The primary tumour of CRC was drawn at this level, and the range of the red curve indicates the range of the primary tumour at this level.
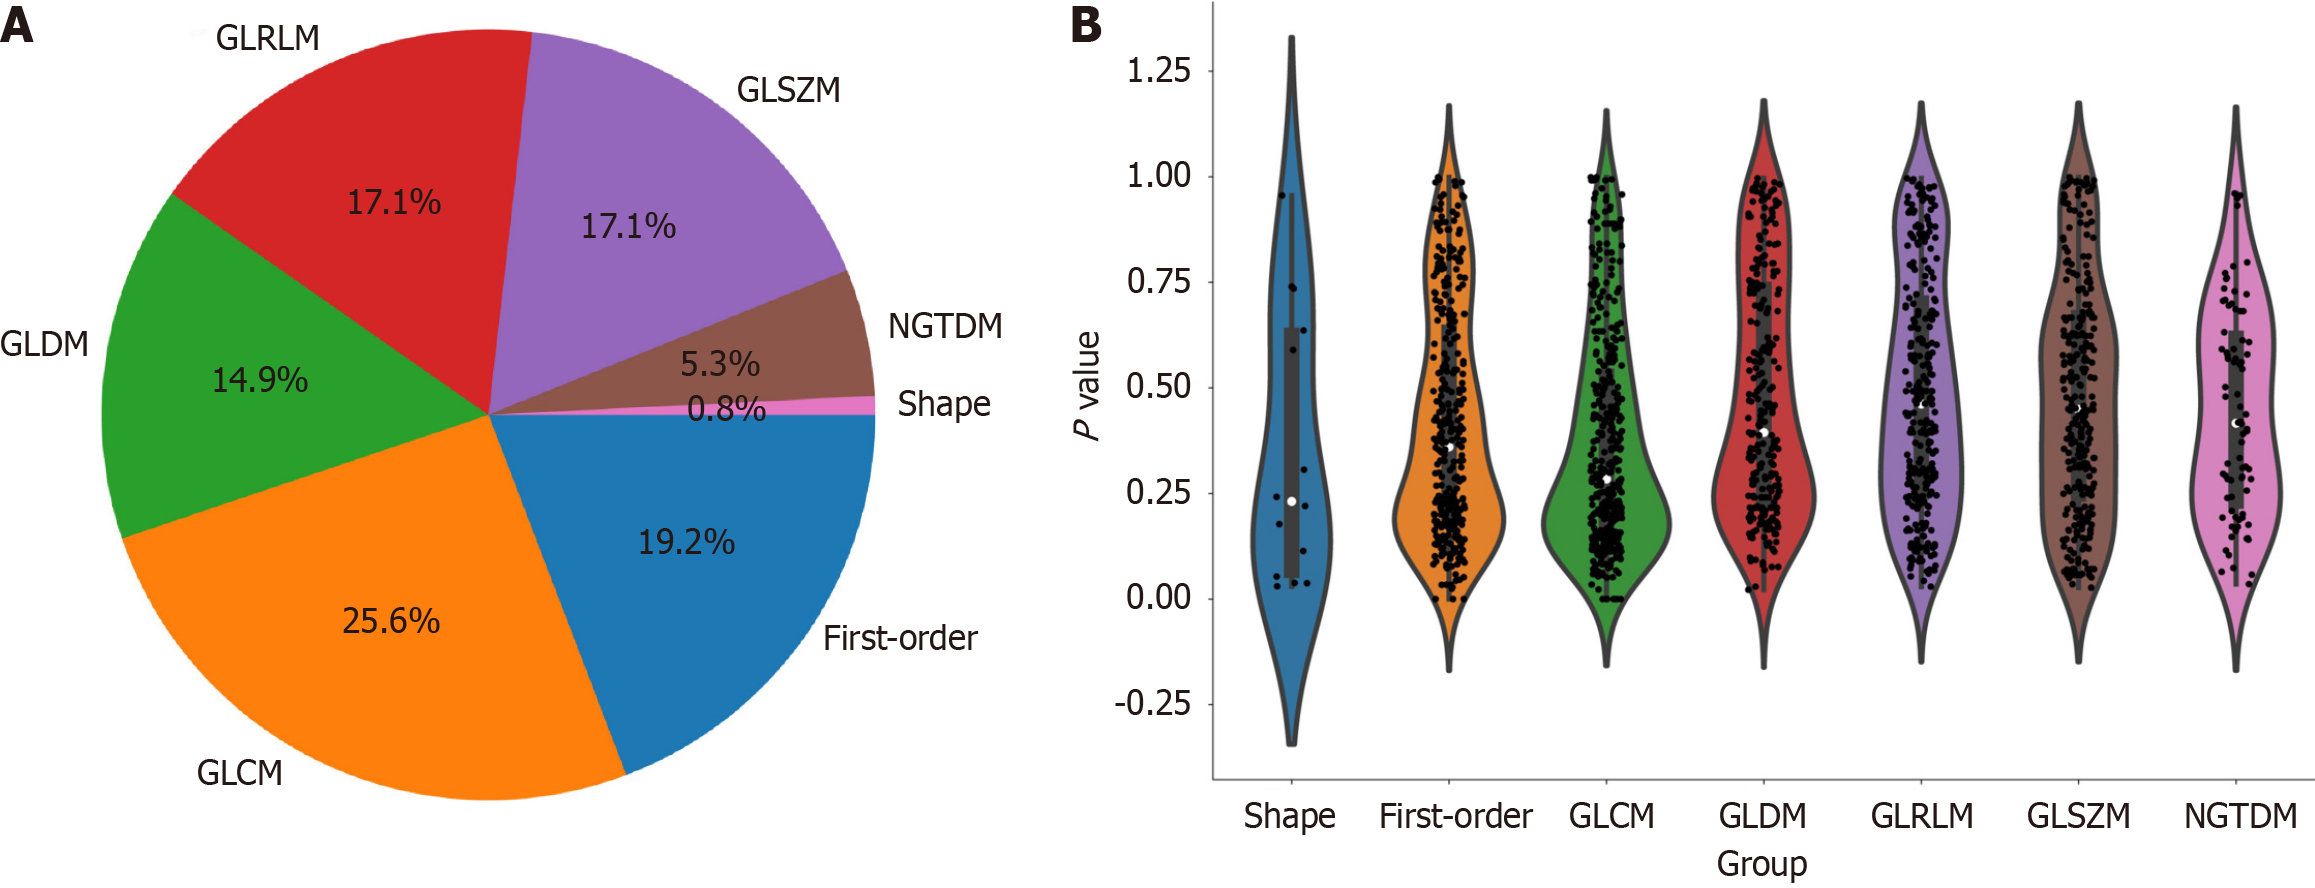
Figure 3 Distribution of radiomic features.
A: The number and proportion of extracted radiomic features; B: Violin plots showing all features and corresponding P values, which help us observe the centralized trend and dispersion of the data. GLCM: Grayscale co-occurrence matrix; GLRLM: Grayscale run length matrix; GLSZM: Grayscale size region matrix, NGTDM: Neighbourhood grayscale difference matrix; GLDM: Grayscale dependency matrix.
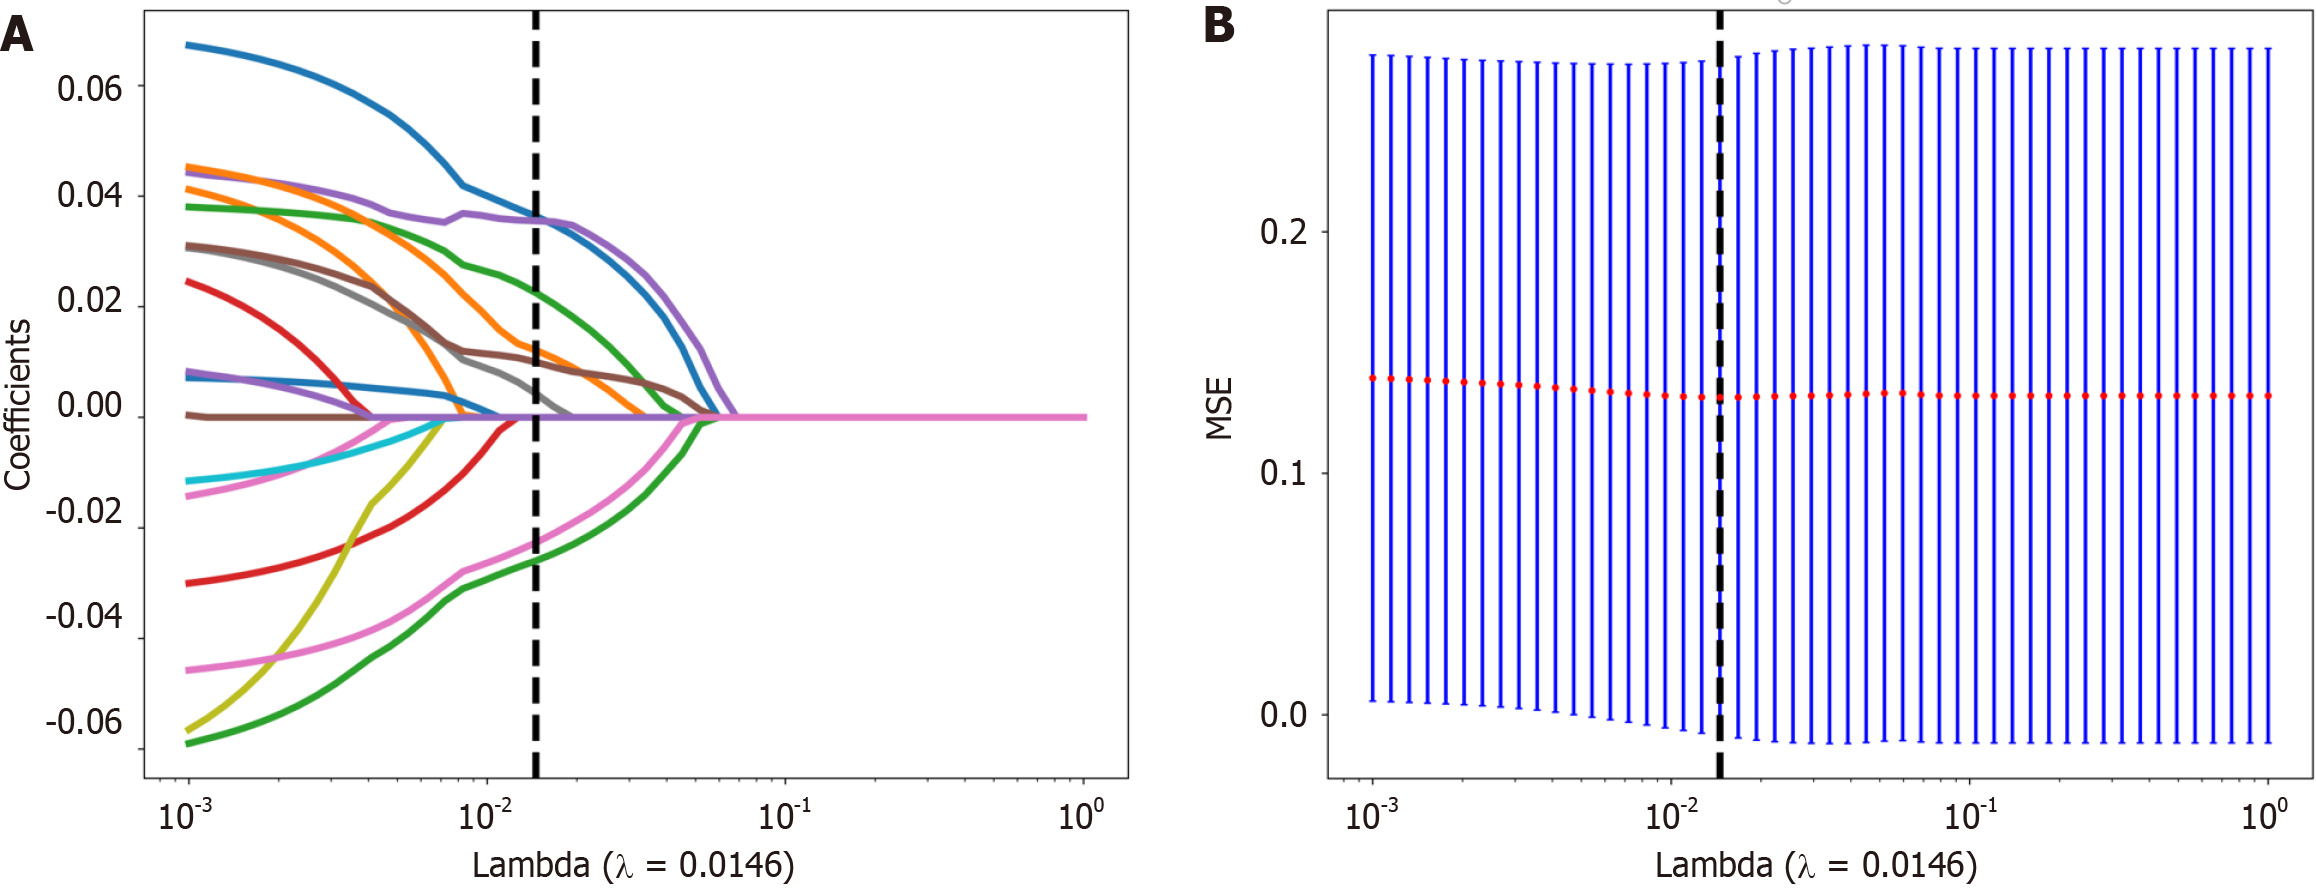
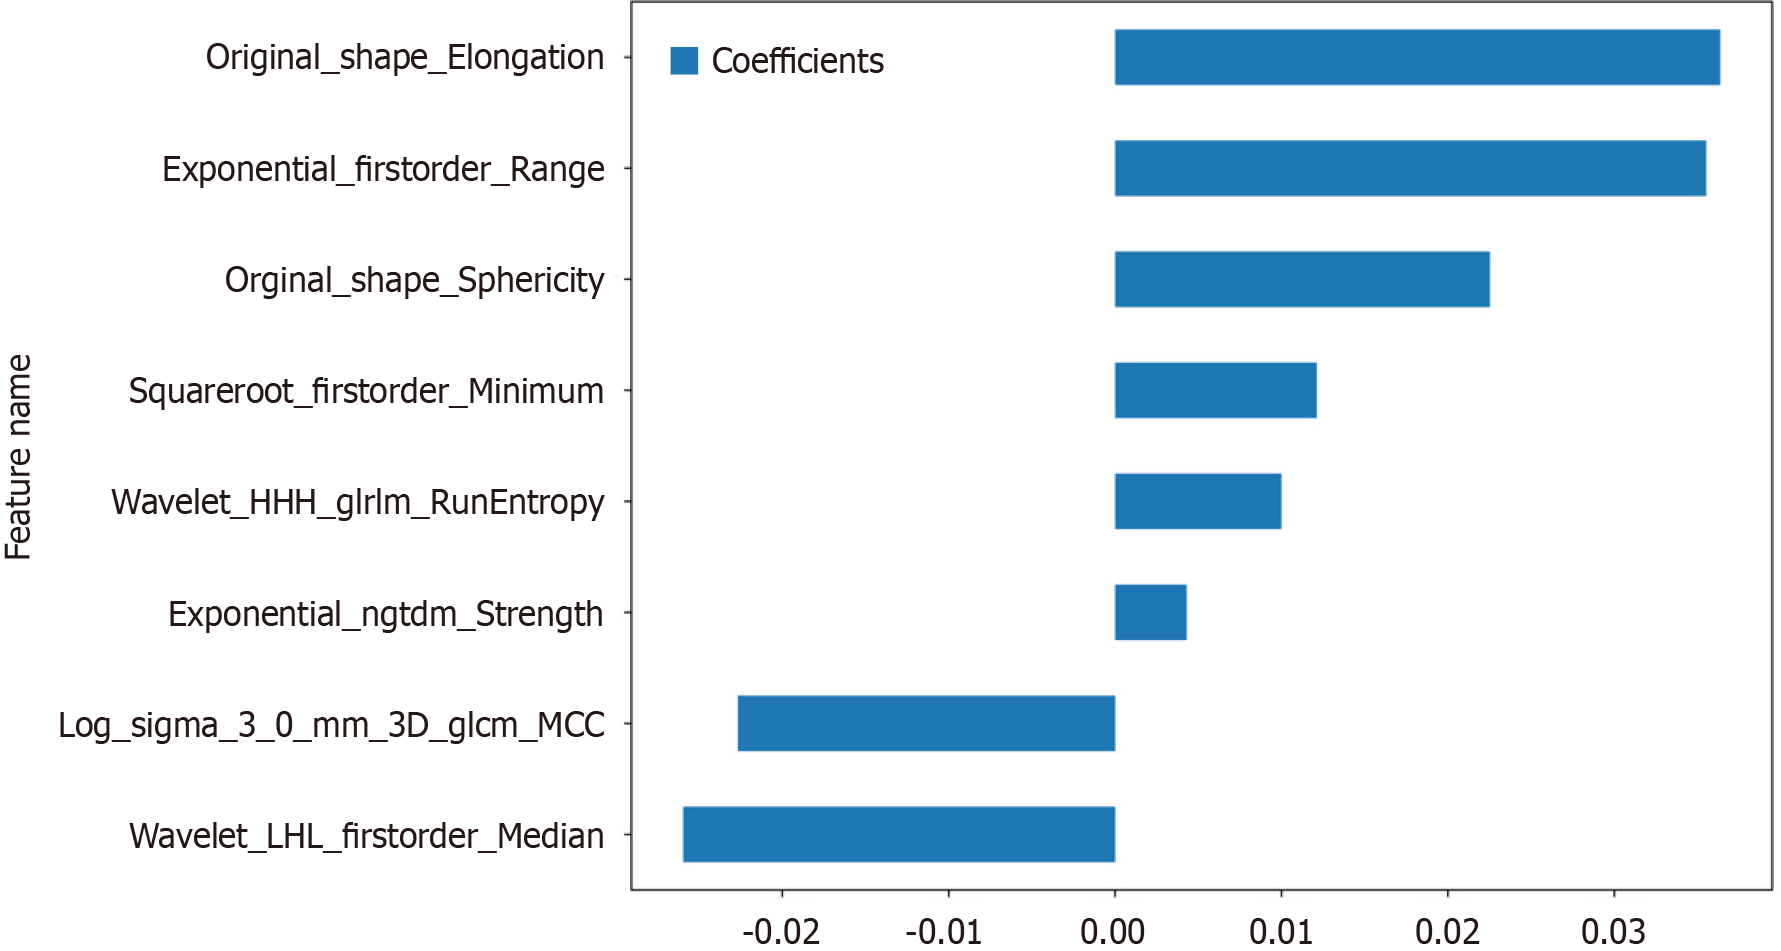
Figure 4 The selection process of the least absolute shrinkage and selection operator method.
A: 10-fold cross-validation and minimization of standard selection parameters (lamdba) in the least absolute shrinkage and selection operator model; B: Eight radiomic features with nonzero coefficients were selected for the optimal parameter lamdba (lambda = 0.0146). MSE: Mean square error.
Figure 5 Histogram of the Rad-score based on the selected features.
GLCM: Grayscale co-occurrence matrix; GLRLM: Grayscale run length matrix; NGTDM: Neighbourhood grayscale difference matrix.
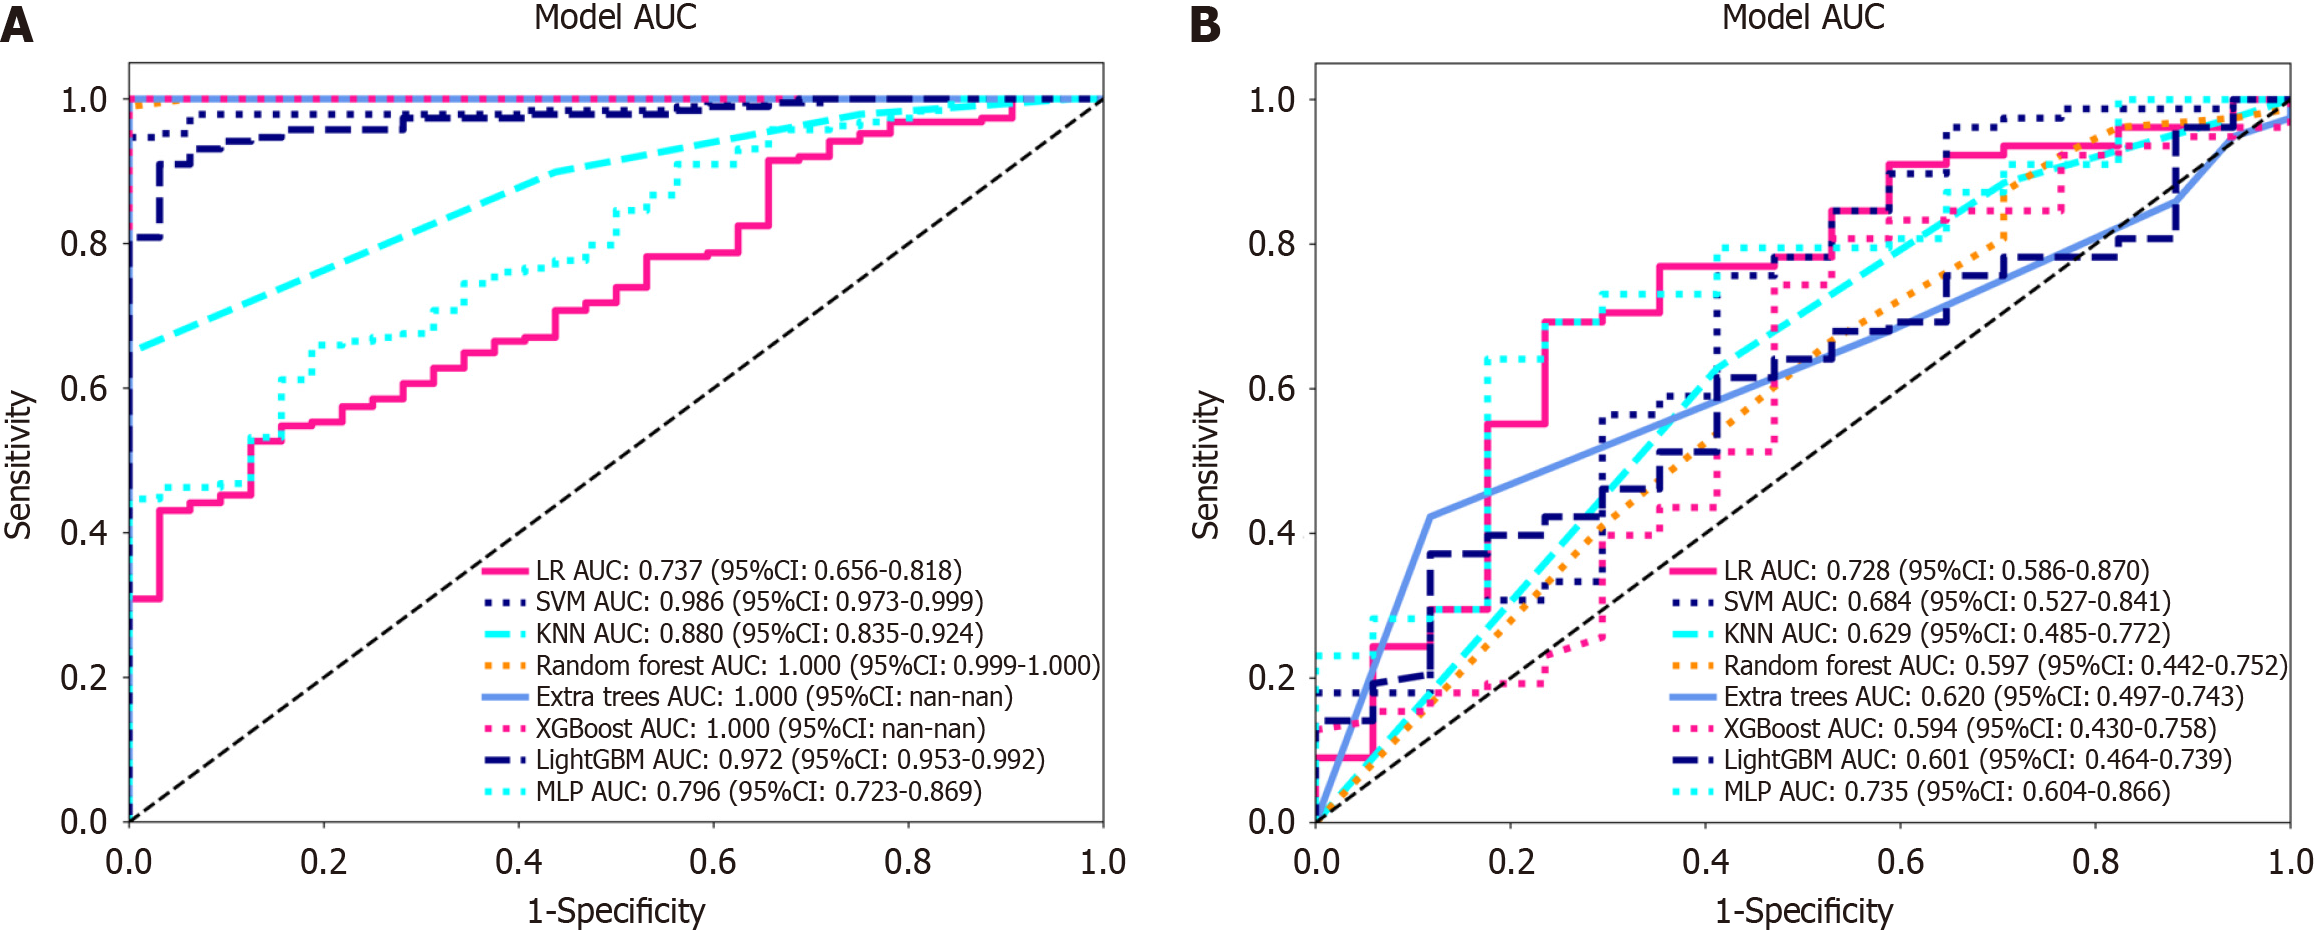
Figure 6 Receiver operating characteristic curves of logistic regression, support vector machine, K-nearest neighbour, random forest, extra trees, extreme gradient boosting, light gradient boosting machine, and multilayer perceptron.
A: In the training cohort; the area under the curve (AUC) values were 0.737, 0.986, 0.880, 1.000, 1.000, 1.000, 0.972, and 0.796, respectively; B: Receiver operating characteristic curves of logistic regression (LR), support vector machine (SVM), K-nearest neighbour (KNN), random forest (RF), extra trees (ET), extreme gradient boosting (XGBoost), light gradient boosting machine (LightGBM), and multilayer perceptron (MLP) in the validation cohort, the AUC values were 0.728, 0.684, 0.629, 0.597, 0.620, 0.594, 0.601 and 0.735, respectively. Except for LR and MLP, the other machine learning algorithms exhibited overfitting, and the AUC of MLP was greater than that of LR. LR: Logistic regression; SVM: Support vector machine; KNN: K-nearest neighbour; RF: Random forest; ET: Extra trees; XGBoost: Extreme gradient boosting; LightGBM: Light gradient boosting machine; MLP: Multilayer perceptron; ROC: Receiver operating characteristic; AUC: Area under the curve.
Figure 7 The nomogram integrates clinical and radiomic features.
In the two factors of "nerve invasion" and "vascular invasion", "0" represents absent, "1" represents present, and in "circumference", "0" represents ≤ 1/2, "1" represents > 1/2.
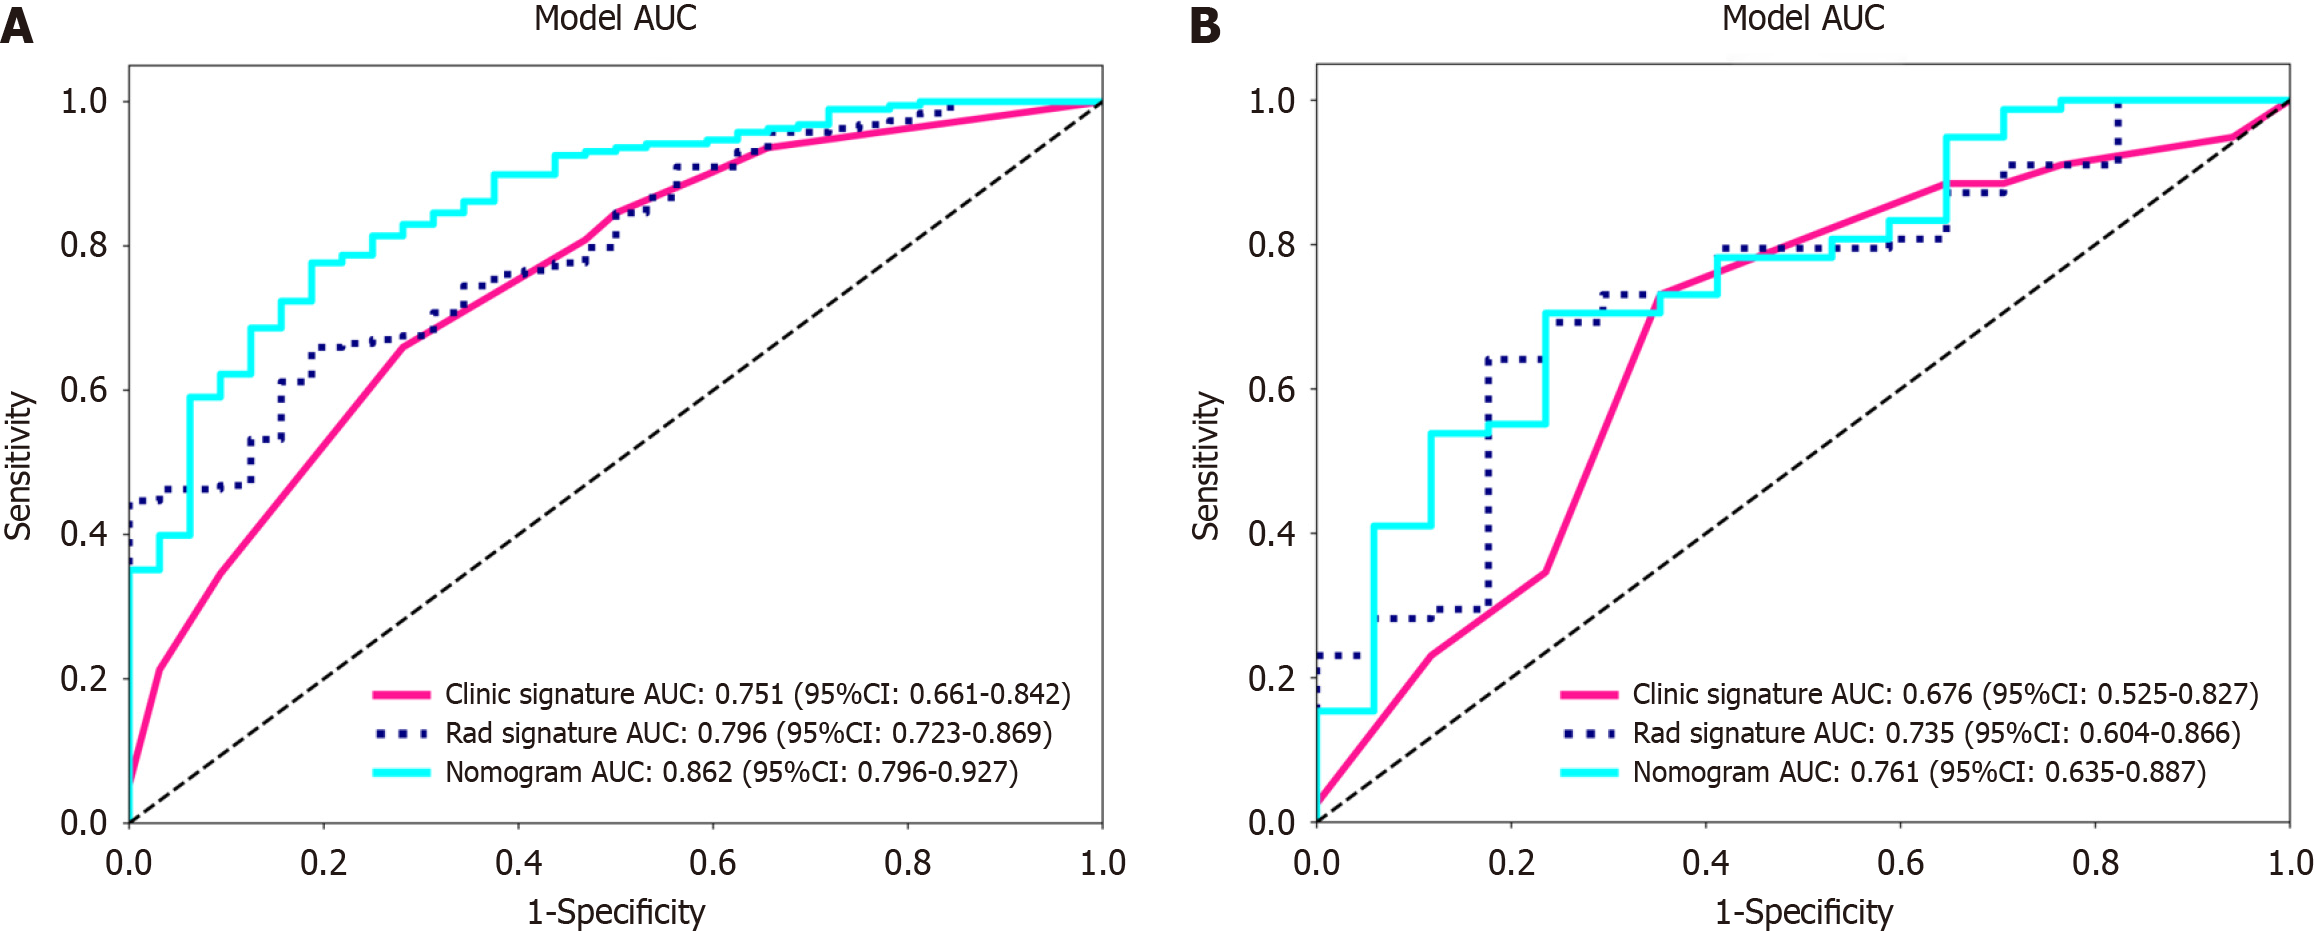
Figure 8 Receiver operating characteristic curves of the radiomic model, clinical model and radiomic-clinical model.
A: The area under the curve (AUC) of the three models (clinical, radiomic, and radiomic-clinical model) in the training cohort were 0.751 (95%CI: 0.661-0.842), 0.796 (95%CI: 0.723-0.869), and 0.862 (95%CI: 0.796-0.927), respectively. B: The AUC of the three models (clinical, radiological, and radiomic-clinical model) in the validation cohort were 0.676 (95%CI: 0.525-0.827), 0.735 (95%CI: 0.604-0.866), and 0.761 (95%CI: 0.635-0.887), respectively. ROC: Receiver operating characteristic; AUC: Area under the curve.
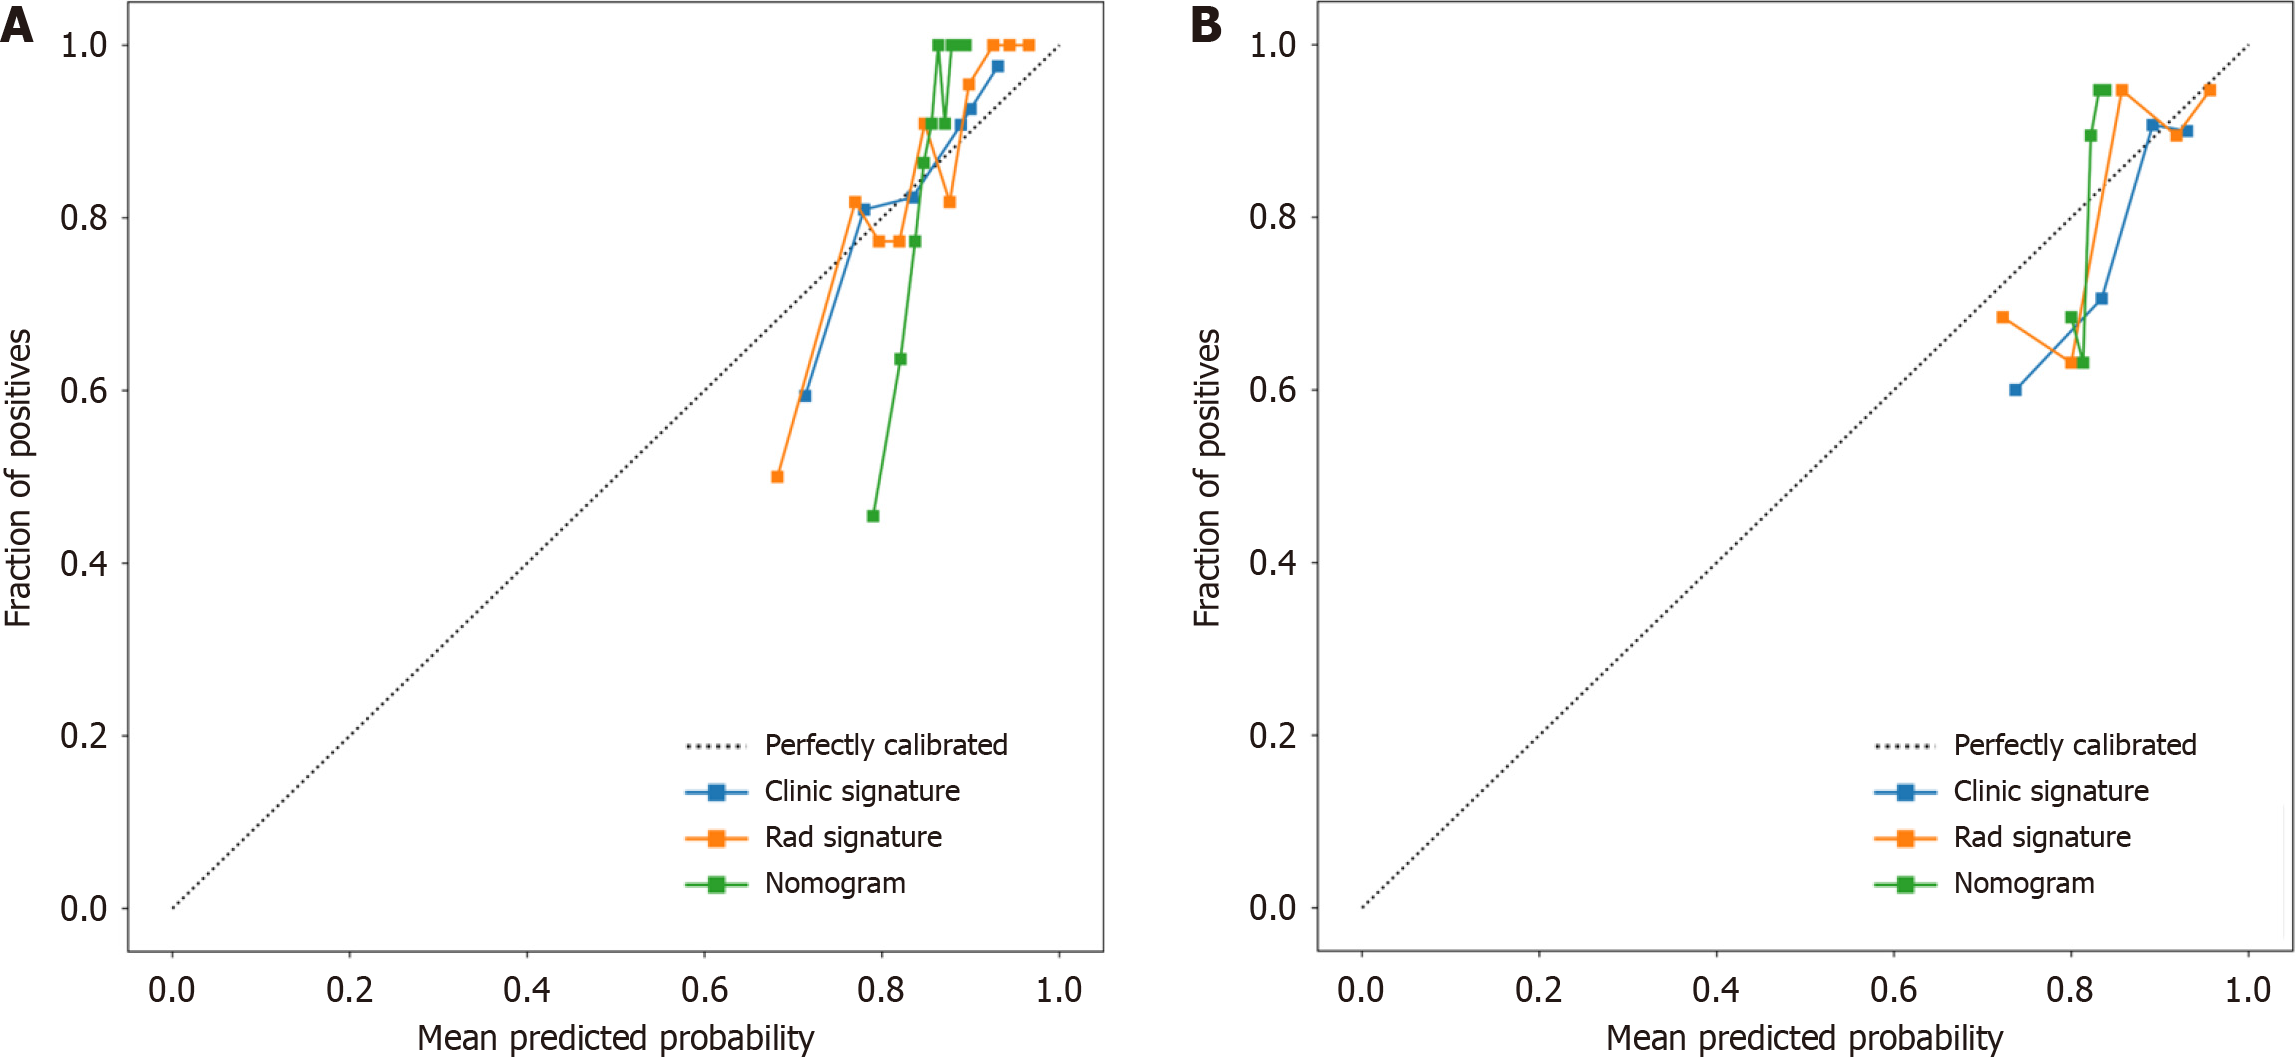
Figure 9 Three models (clinical, radiomic, and combined models) were used to predict the calibration curve of colorectal cancer differentiation in the training cohort and the validation cohort.
A: Calibration curves for the training cohort; B: Calibration curves for the validation cohort. The straight line at 45° represents the standard curve with the probability of perfect matching between the actual (y-axis) and nomogram-predicted (x-axis) differentiation grade. With respect to the training cohort and the validation cohort, the predicted probabilities of the clinical model and the radiomic model closely corresponded to the actual probabilities. Rad: radiomics.
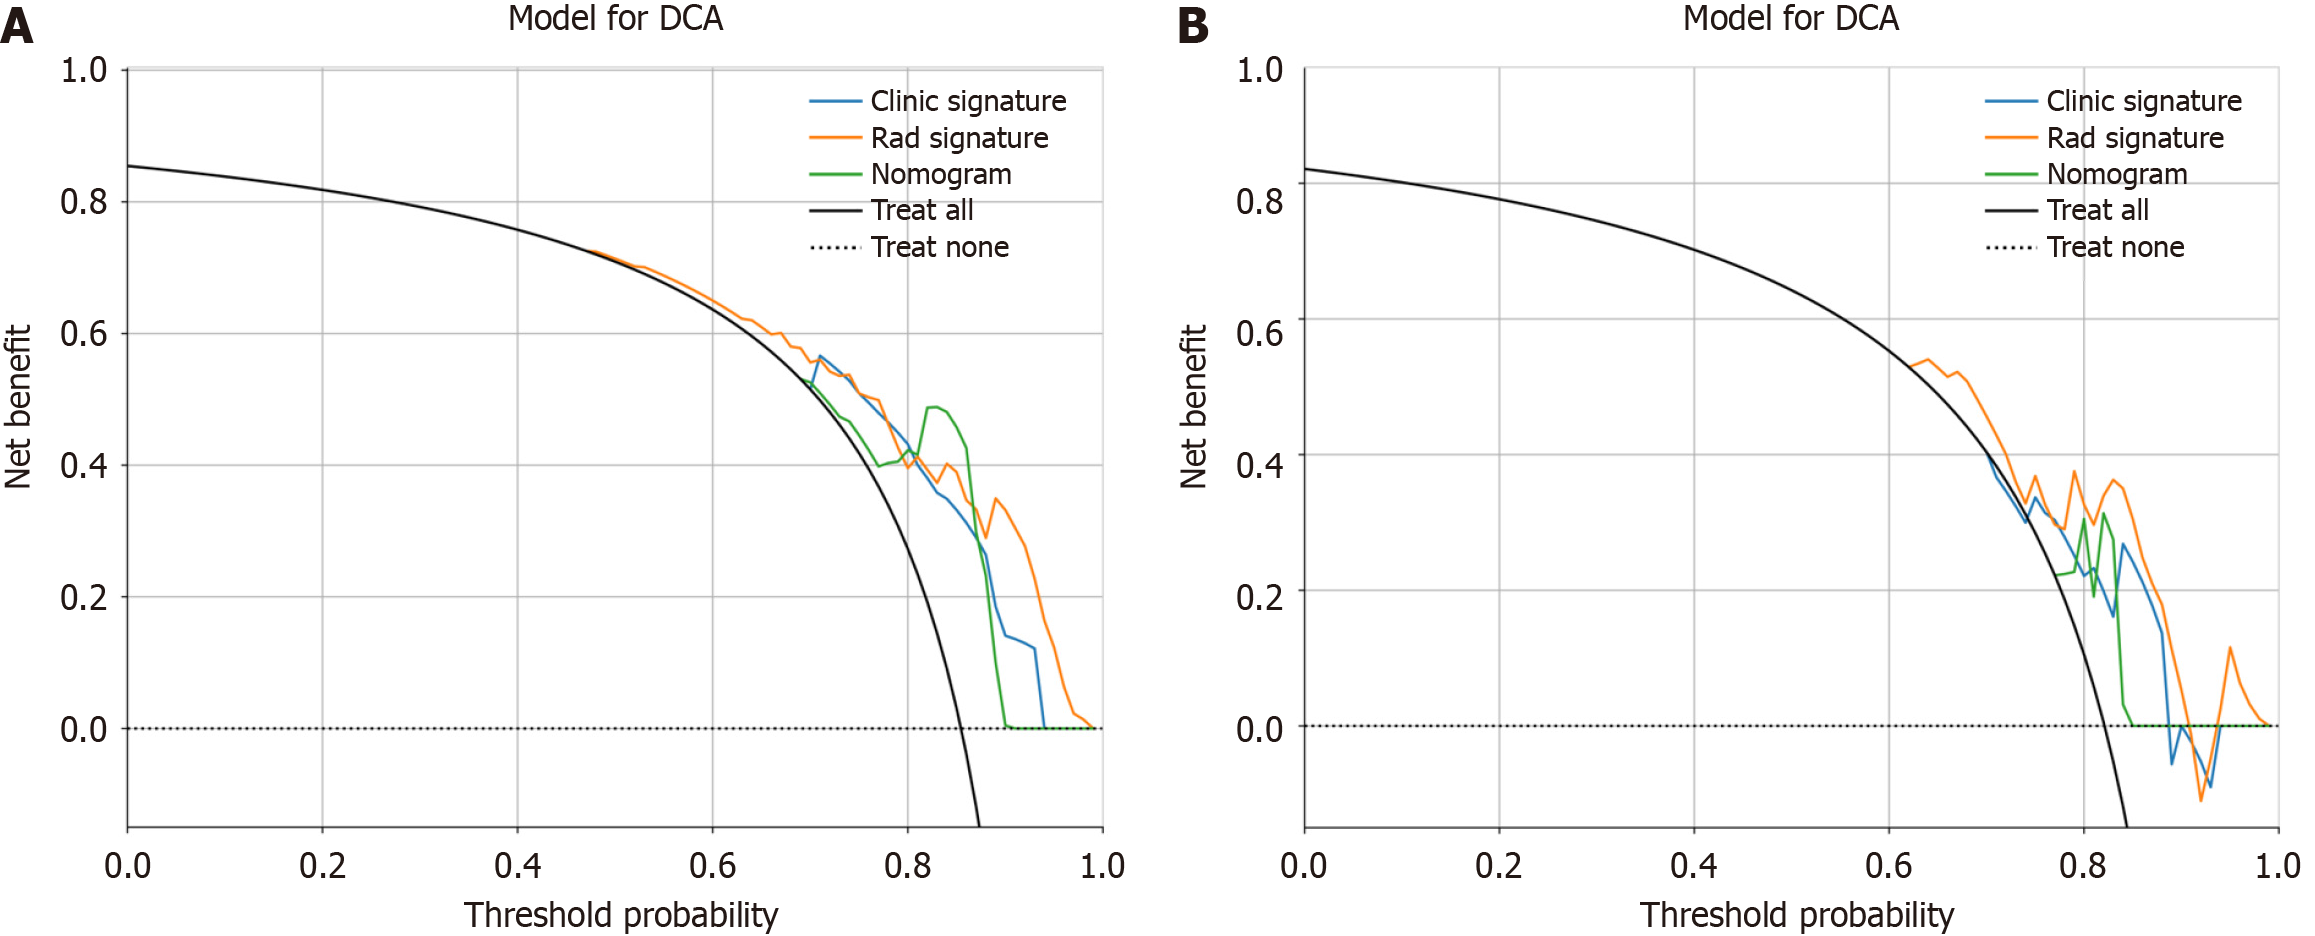
Figure 10 Decision curve analysis of the prediction model.
A: The training cohort; B: The validation cohort. The three models (clinical, radiomic, and radiomic-clinical model) showed good clinical applicability in a certain range. DCA: Decision curve analysis.
- Citation: Zheng HD, Huang QY, Huang QM, Ke XT, Ye K, Lin S, Xu JH. T2-weighted imaging-based radiomic-clinical machine learning model for predicting the differentiation of colorectal adenocarcinoma. World J Gastrointest Oncol 2024; 16(3): 819-832
- URL: https://www.wjgnet.com/1948-5204/full/v16/i3/819.htm
- DOI: https://dx.doi.org/10.4251/wjgo.v16.i3.819


