Copyright
©The Author(s) 2024.
World J Gastrointest Oncol. Mar 15, 2024; 16(3): 761-772
Published online Mar 15, 2024. doi: 10.4251/wjgo.v16.i3.761
Published online Mar 15, 2024. doi: 10.4251/wjgo.v16.i3.761
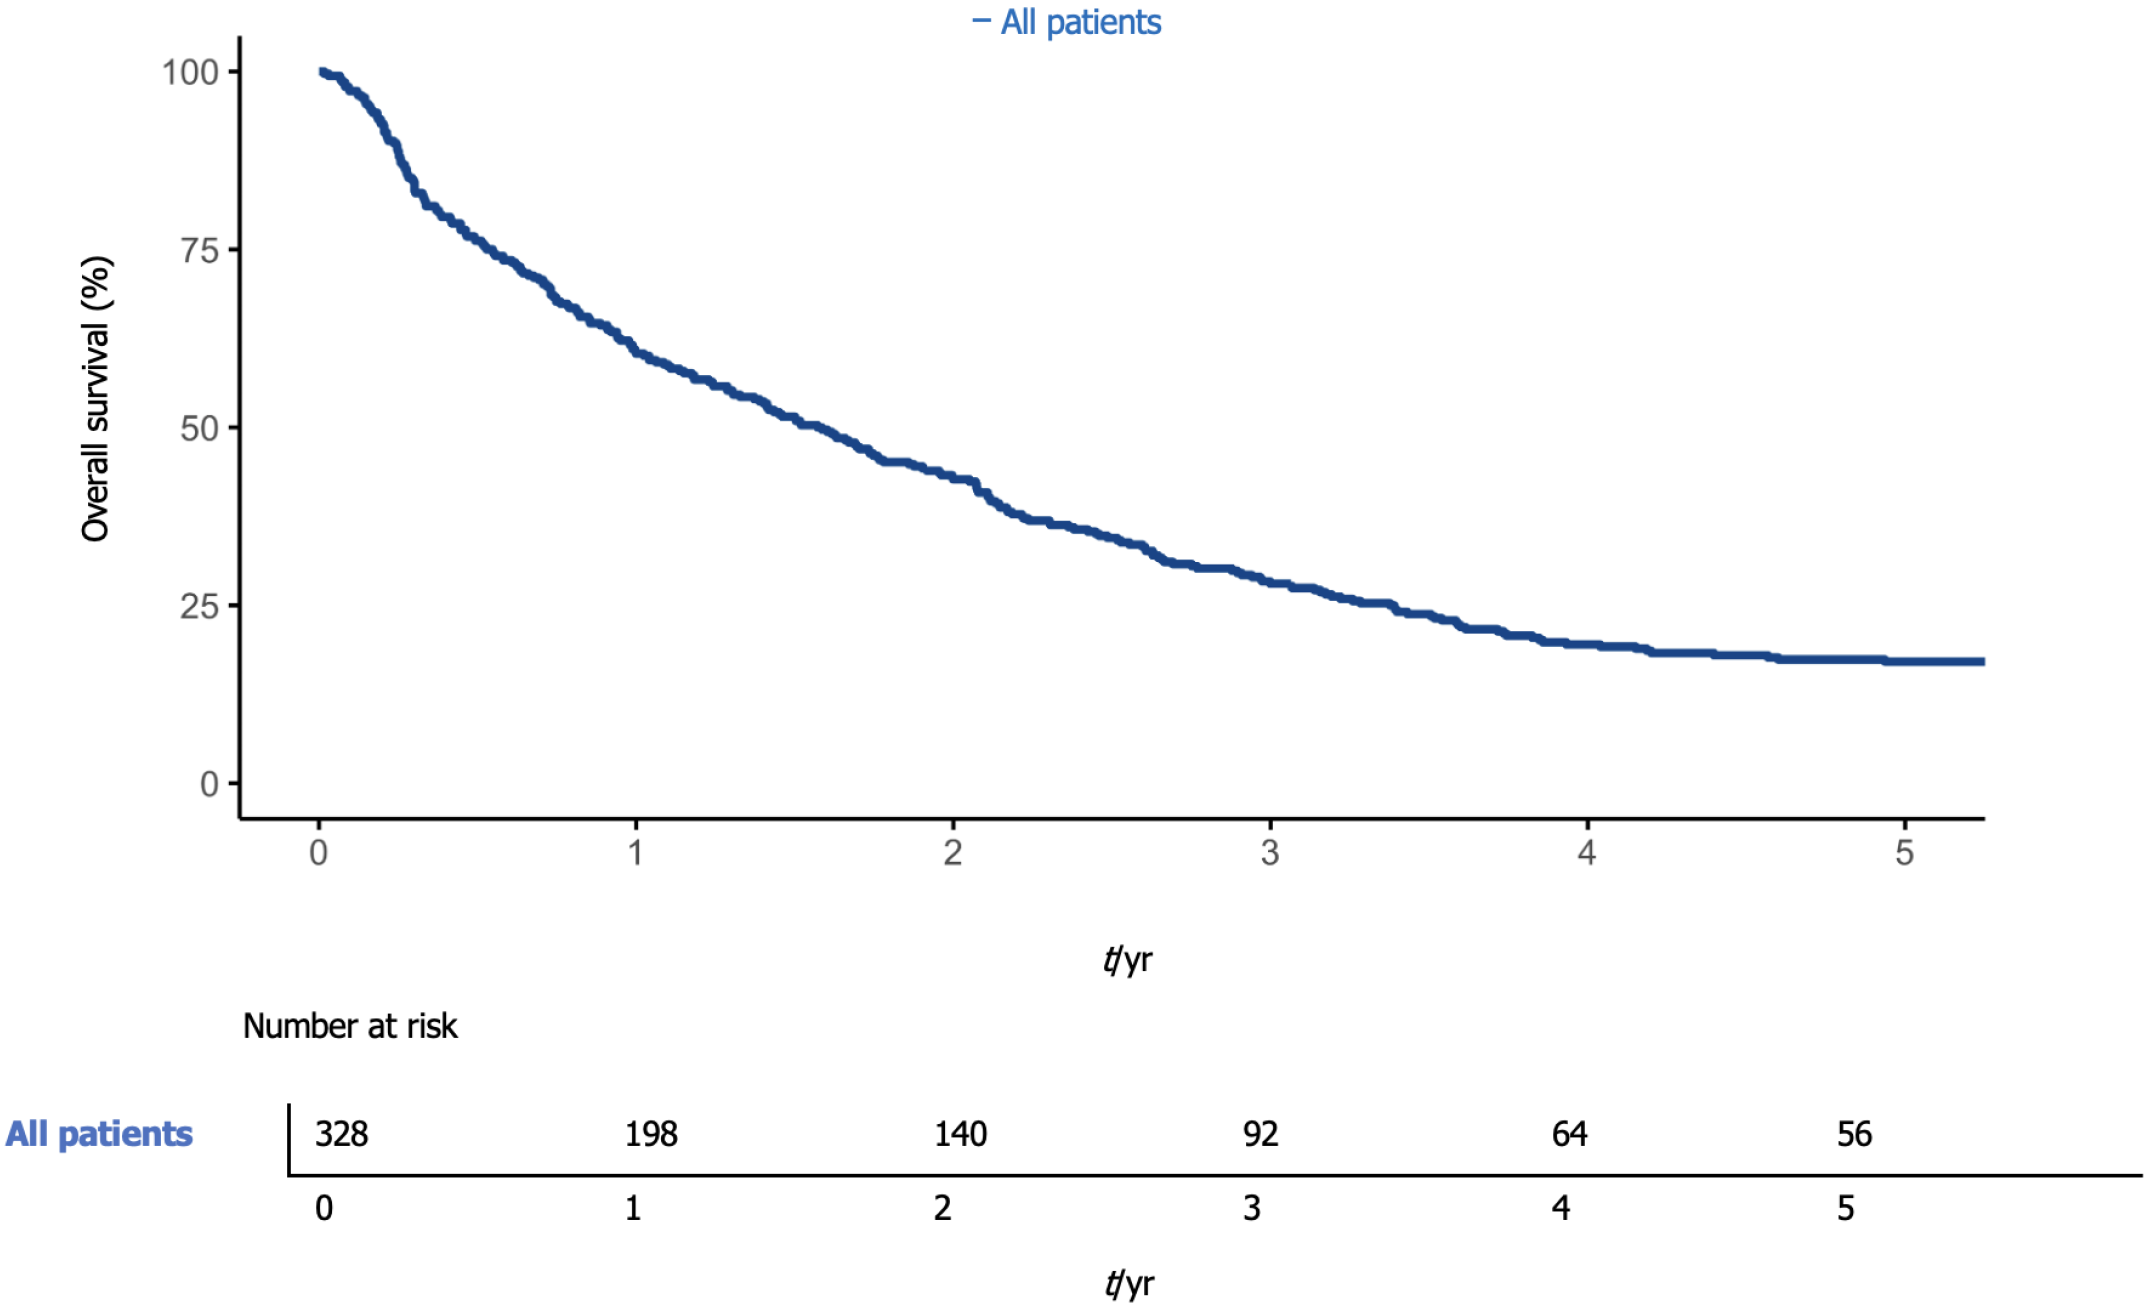
Figure 1 Overall survival rate.
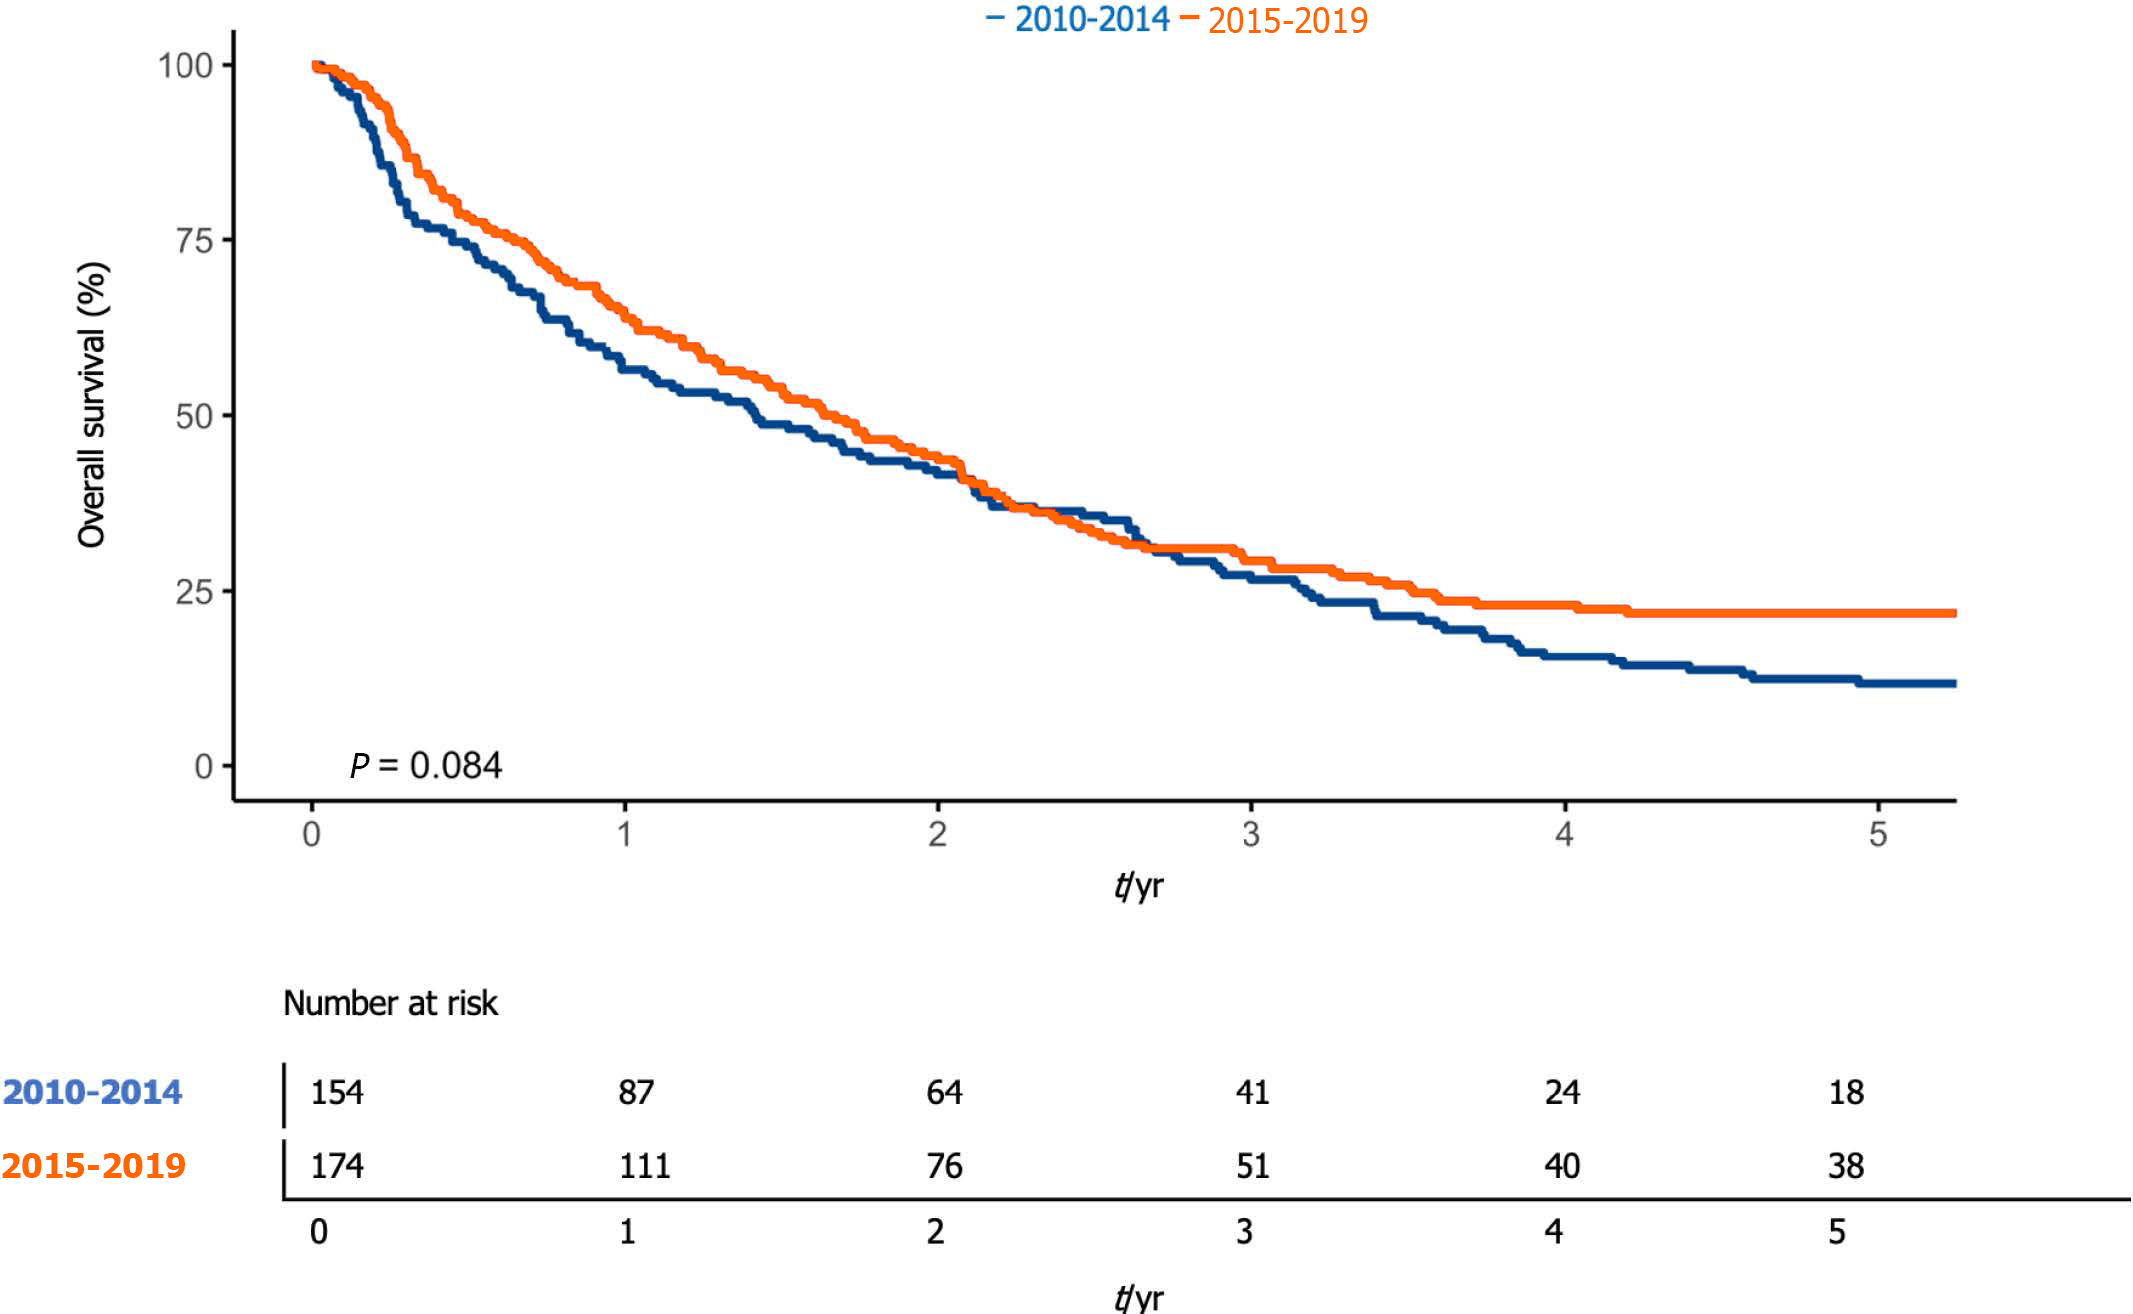
Figure 2 Comparison of survival rates between the two periods.
The blue line represents patients diagnosed in the first period (2010-2014); the orange line represents patients diagnosed in the second period (2015-2019).
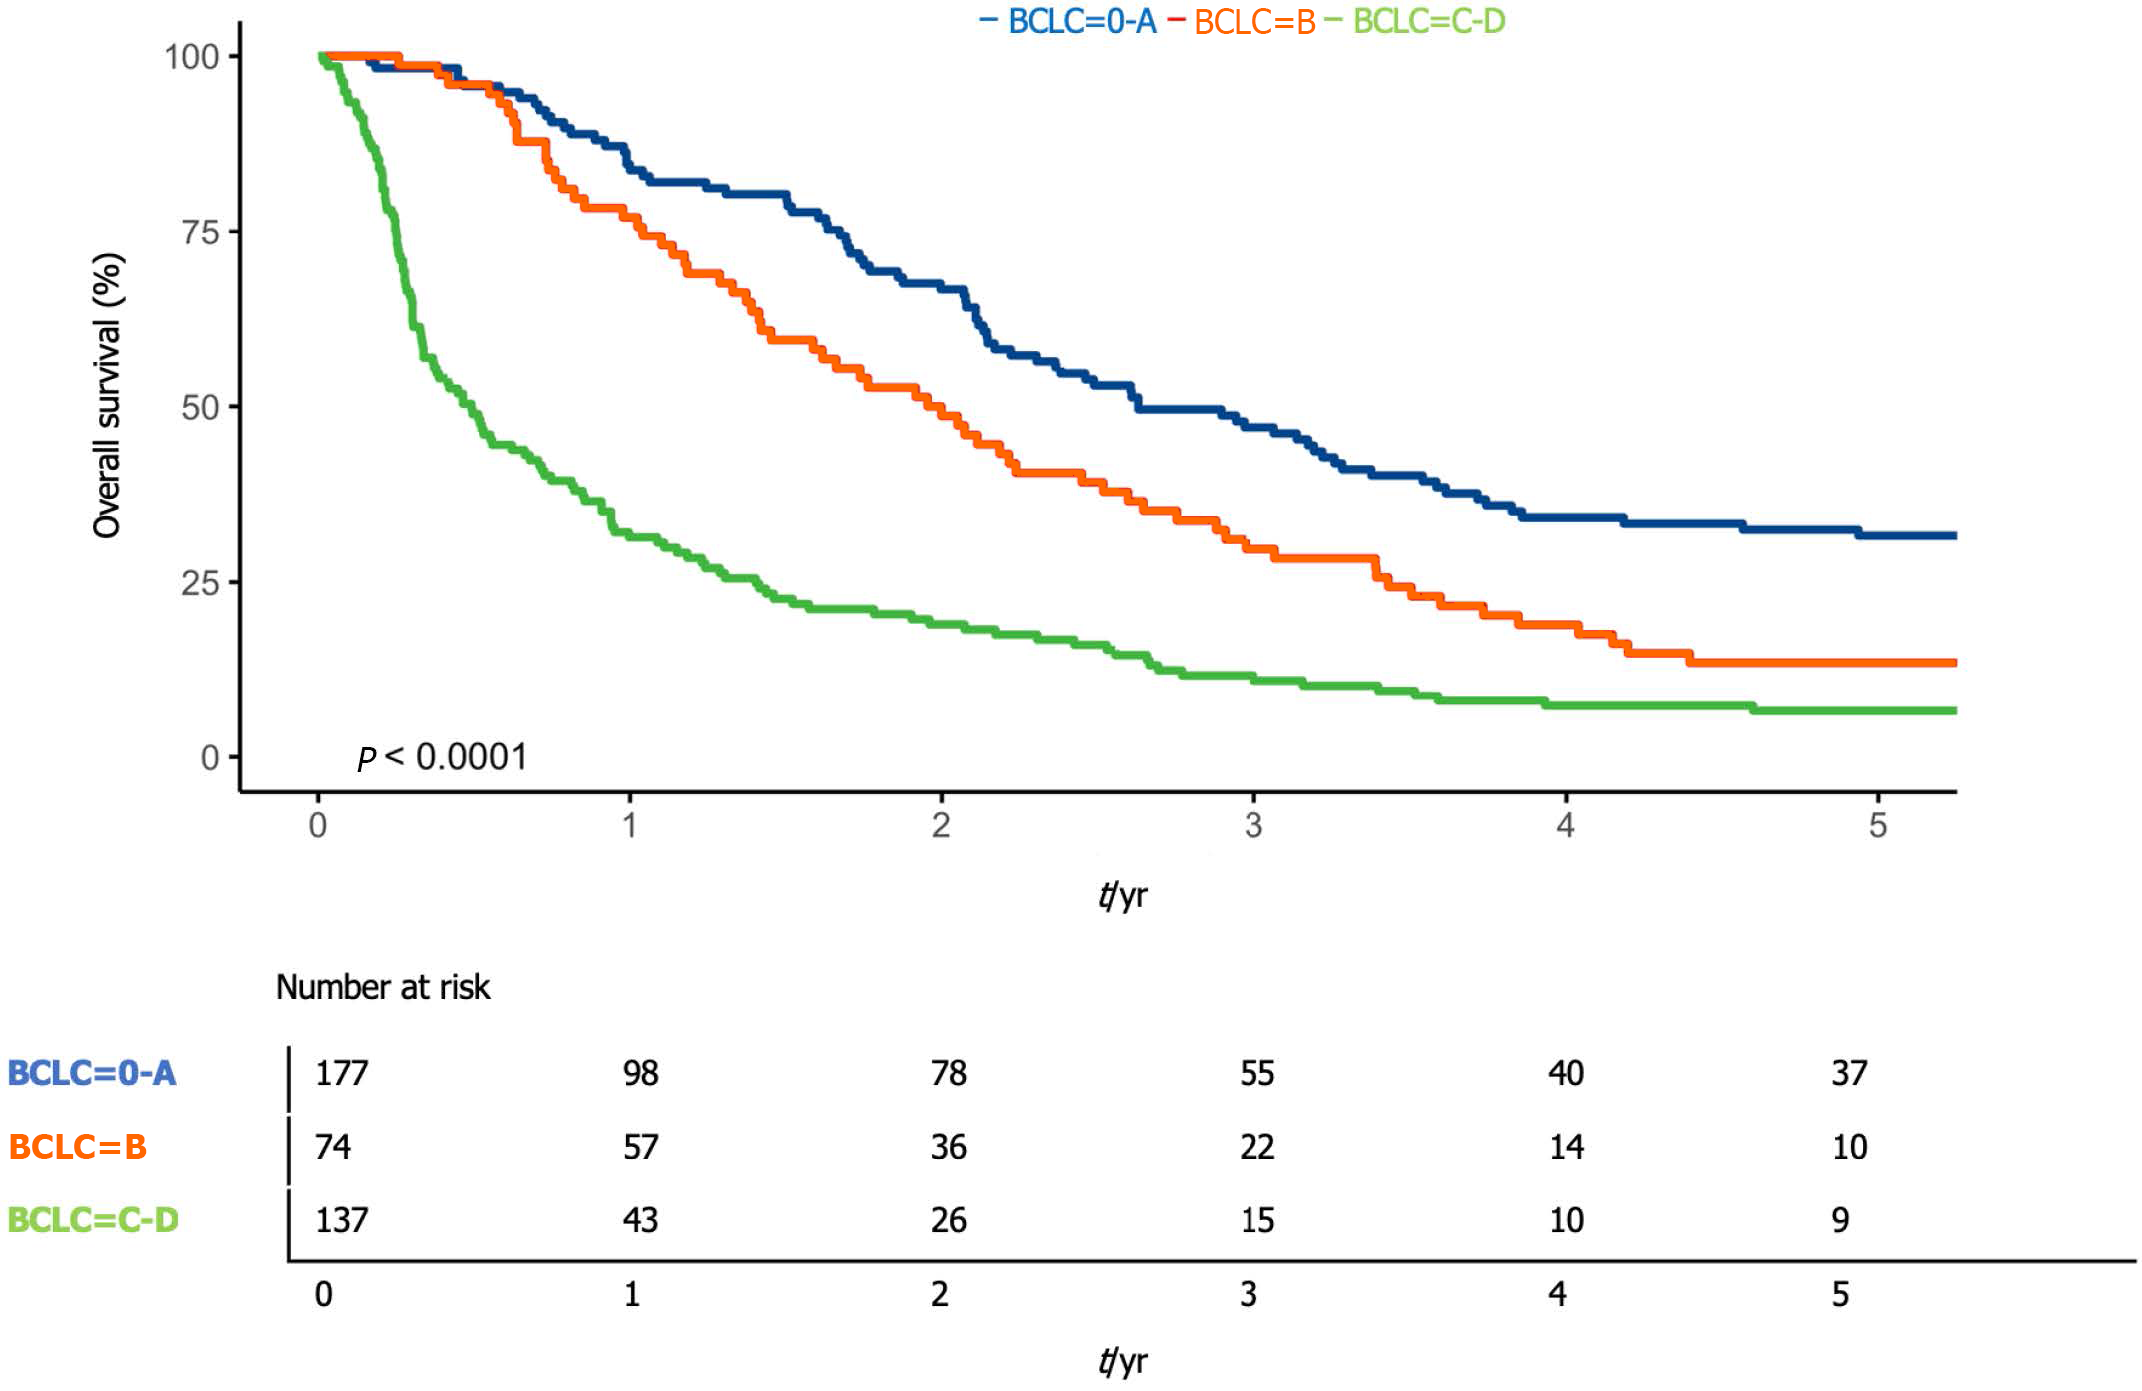
Figure 3 Comparison of survival rates Barcelona clinic liver cancer stages.
The blue line represents patients with Barcelona Clinic Liver Cancer (BCLC) 0 or A (early); the orange line represents patients with BCLC B (intermediate); and the green line represents patients with BCLC C or D (advanced).
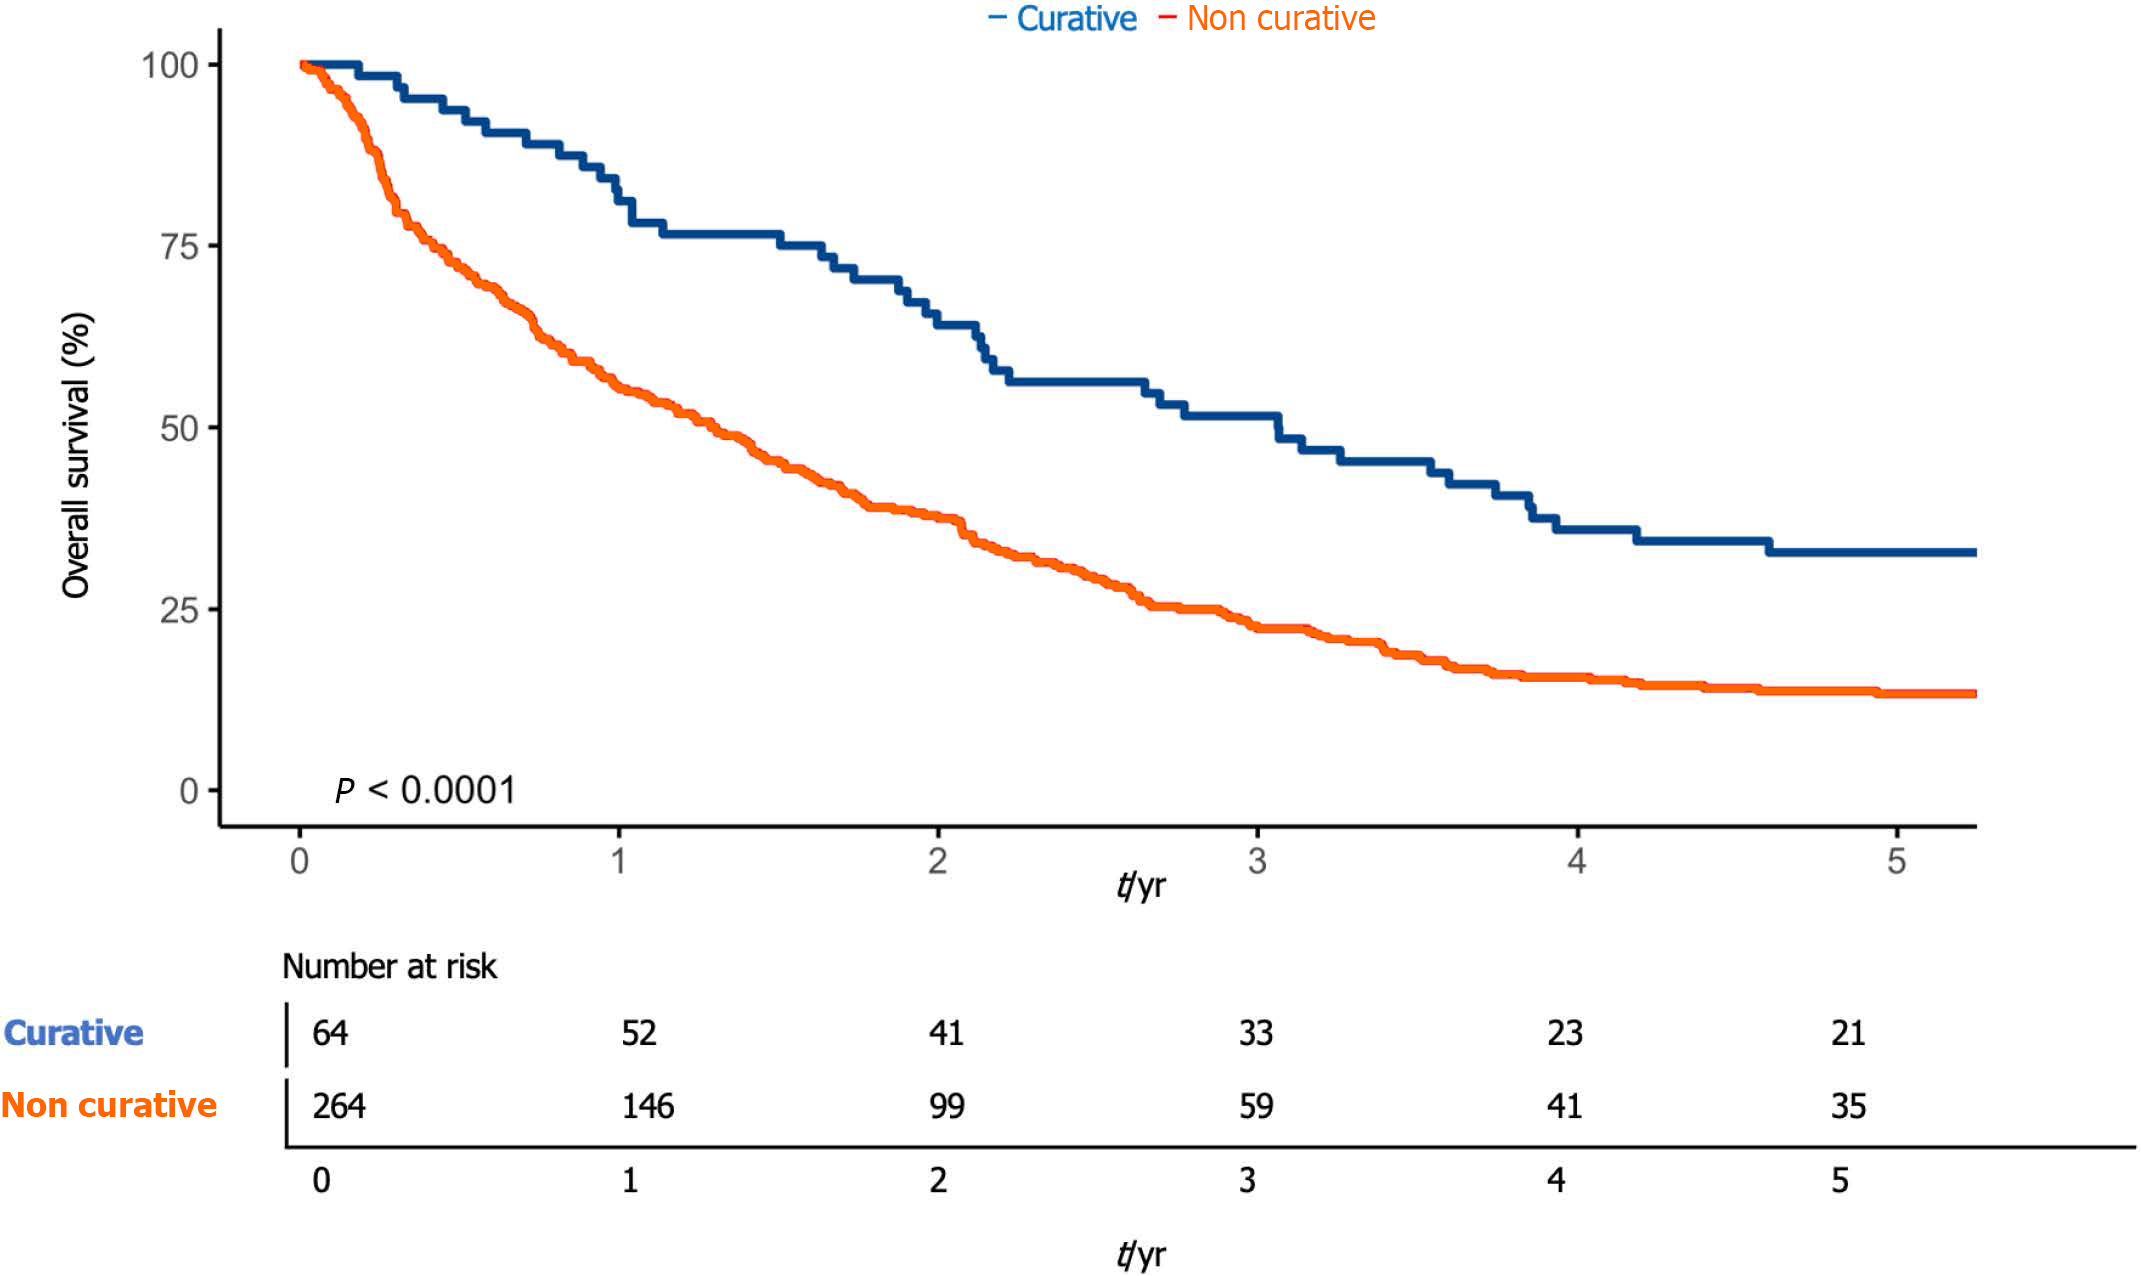
Figure 4 Comparison of survival rates between therapeutic groups.
The blue line represents patients undergoing curative therapeutic treatment (surgical resection or percutaneous radiofrequency ablation); and the orange line represents patients undergoing non-curative therapeutic treatment (trans-arterial chemo embolization, selective internal radiation therapy, chemotherapy with sorafenib or palliation).
- Citation: Bracco C, Gallarate M, Badinella Martini M, Magnino C, D'Agnano S, Canta R, Racca G, Melchio R, Serraino C, Polla Mattiot V, Gollè G, Fenoglio L. Epidemiology, therapy and outcome of hepatocellular carcinoma between 2010 and 2019 in Piedmont, Italy. World J Gastrointest Oncol 2024; 16(3): 761-772
- URL: https://www.wjgnet.com/1948-5204/full/v16/i3/761.htm
- DOI: https://dx.doi.org/10.4251/wjgo.v16.i3.761


