Copyright
©The Author(s) 2024.
World J Gastrointest Oncol. Dec 15, 2024; 16(12): 4663-4674
Published online Dec 15, 2024. doi: 10.4251/wjgo.v16.i12.4663
Published online Dec 15, 2024. doi: 10.4251/wjgo.v16.i12.4663
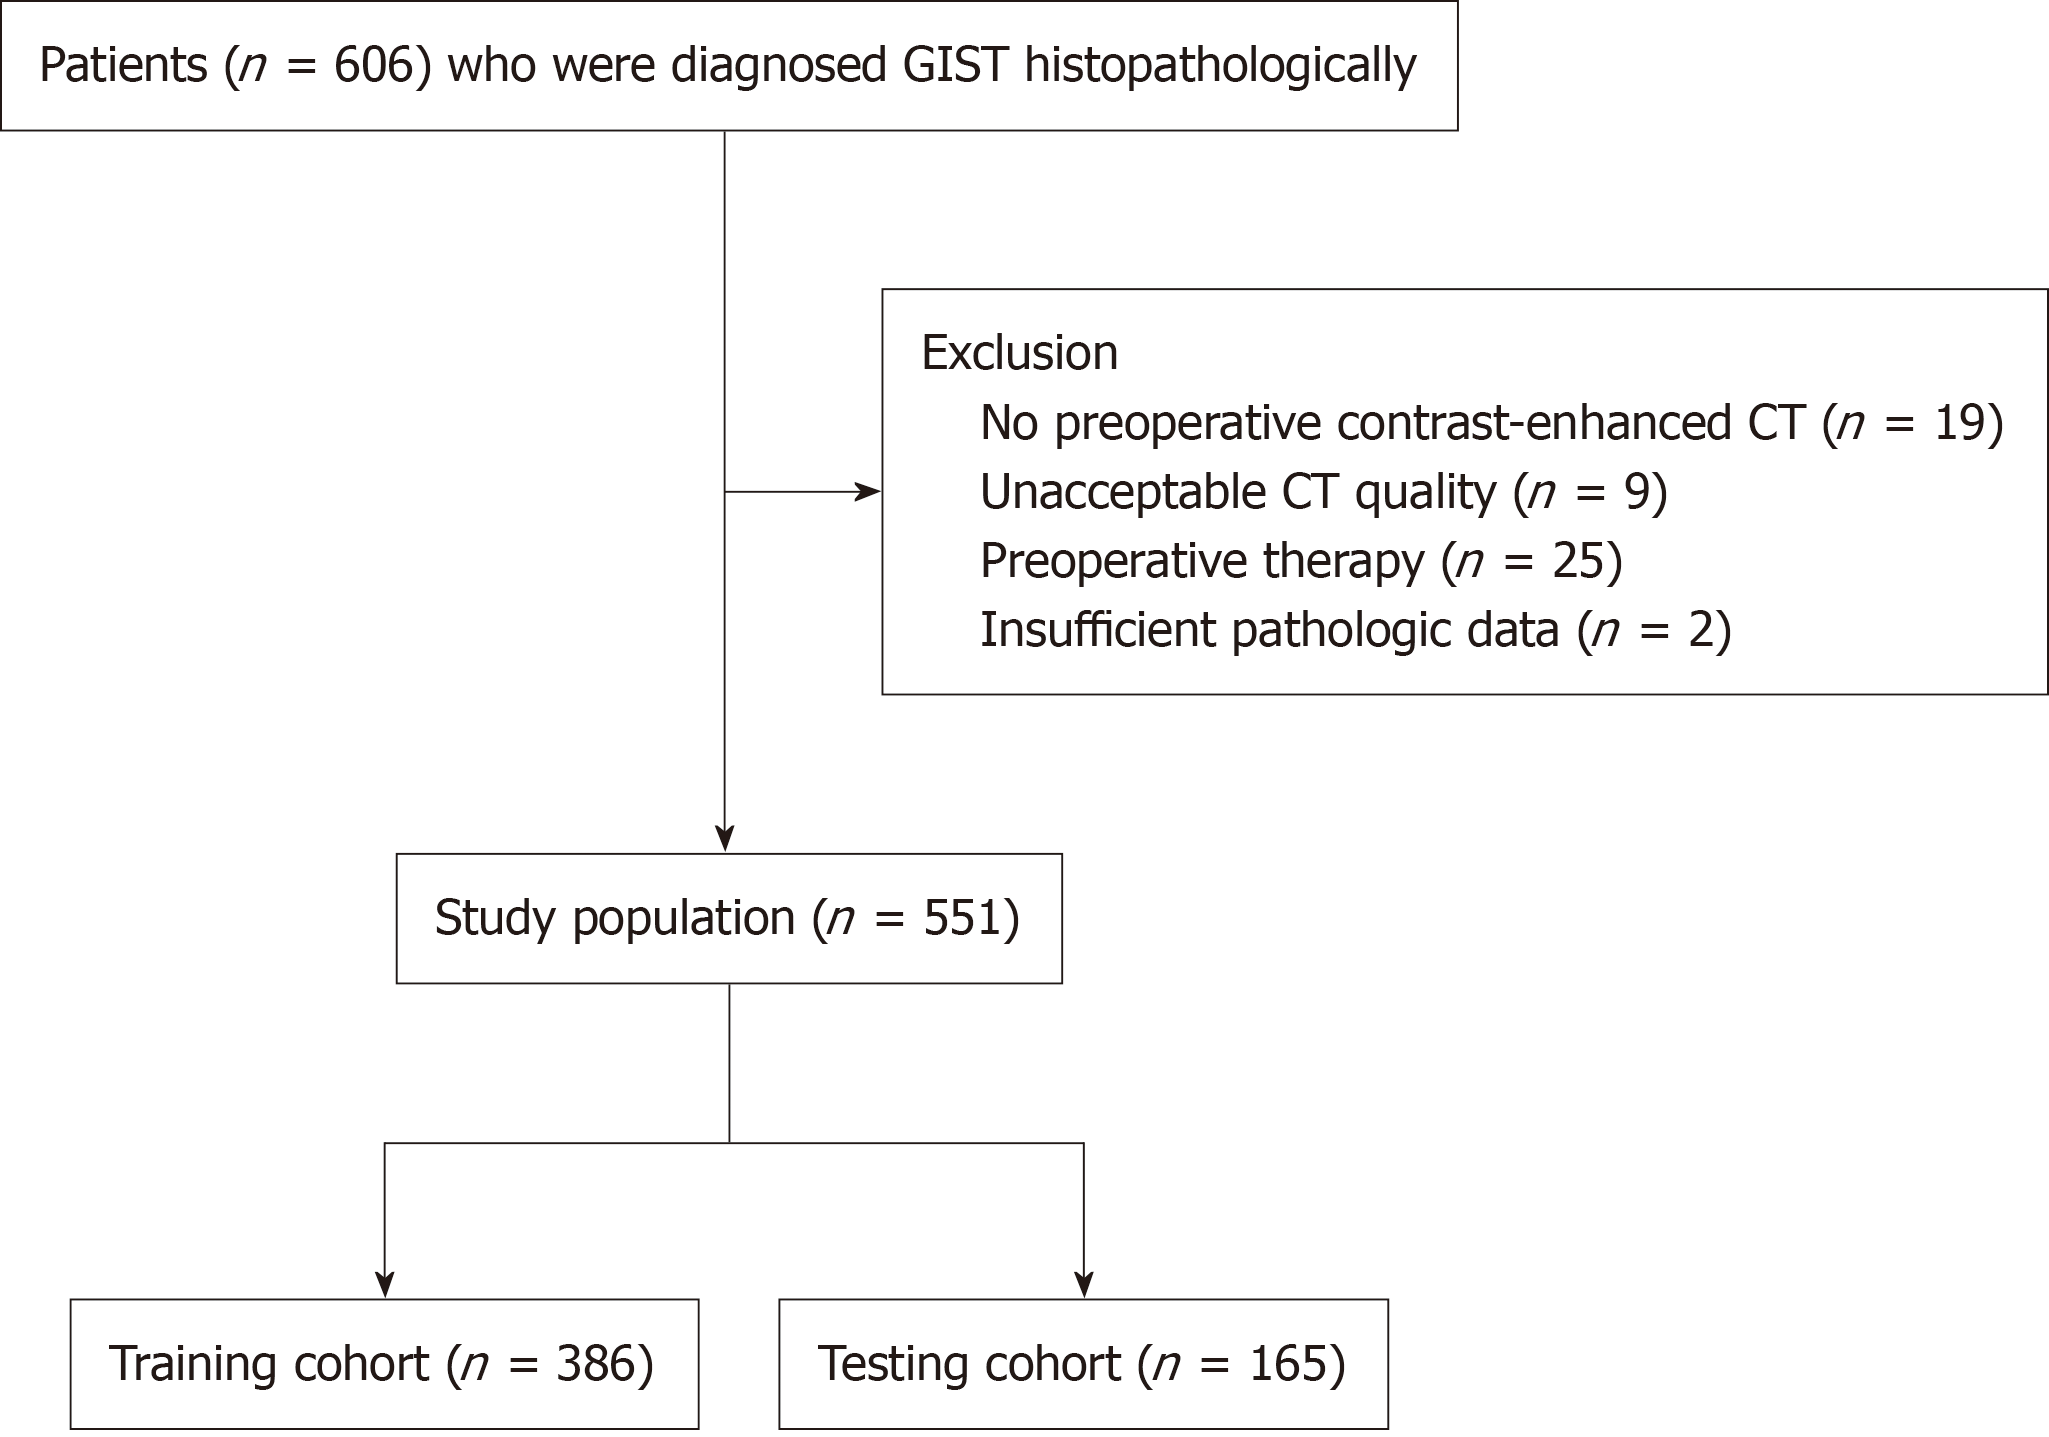
Figure 1 Study population flowchart.
CT: Computed tomography; GIST: Gastrointestinal stromal tumors.
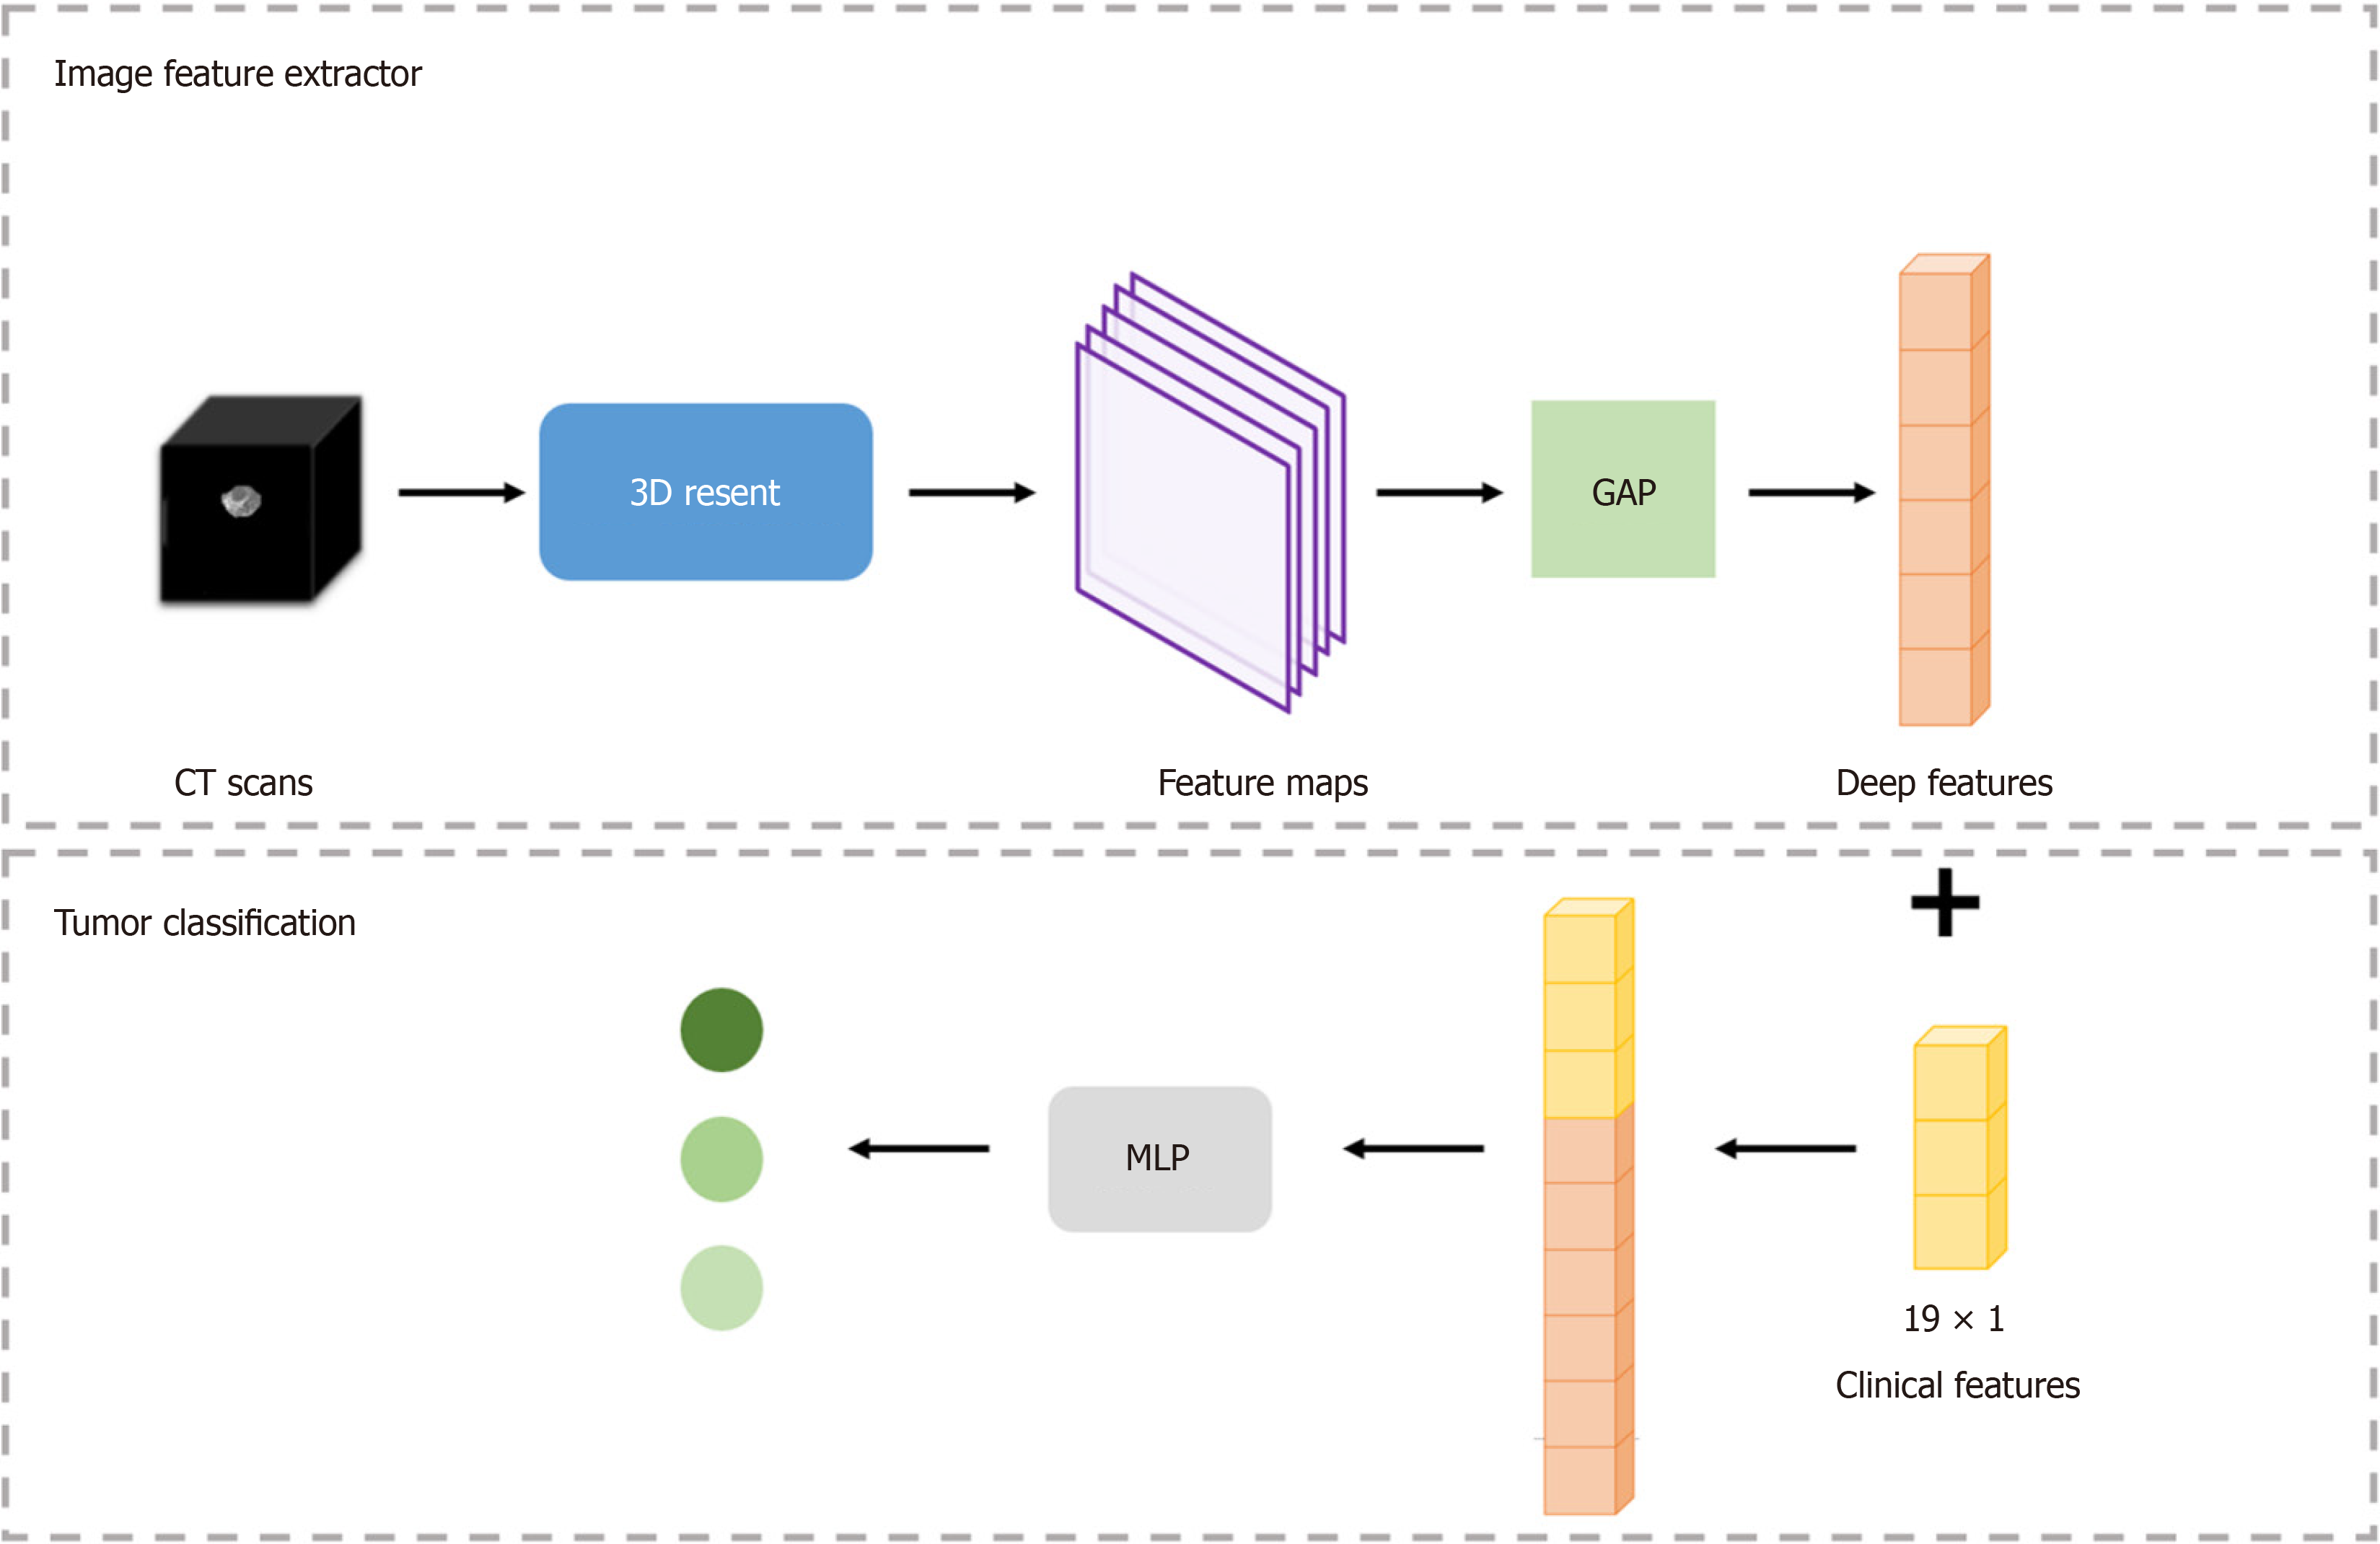
Figure 2 Overall gastrointestinal stromal tumor risk stratification framework.
CT: Computed tomography; MLP: Multilayer perceptron; GAP: Global average pooling.
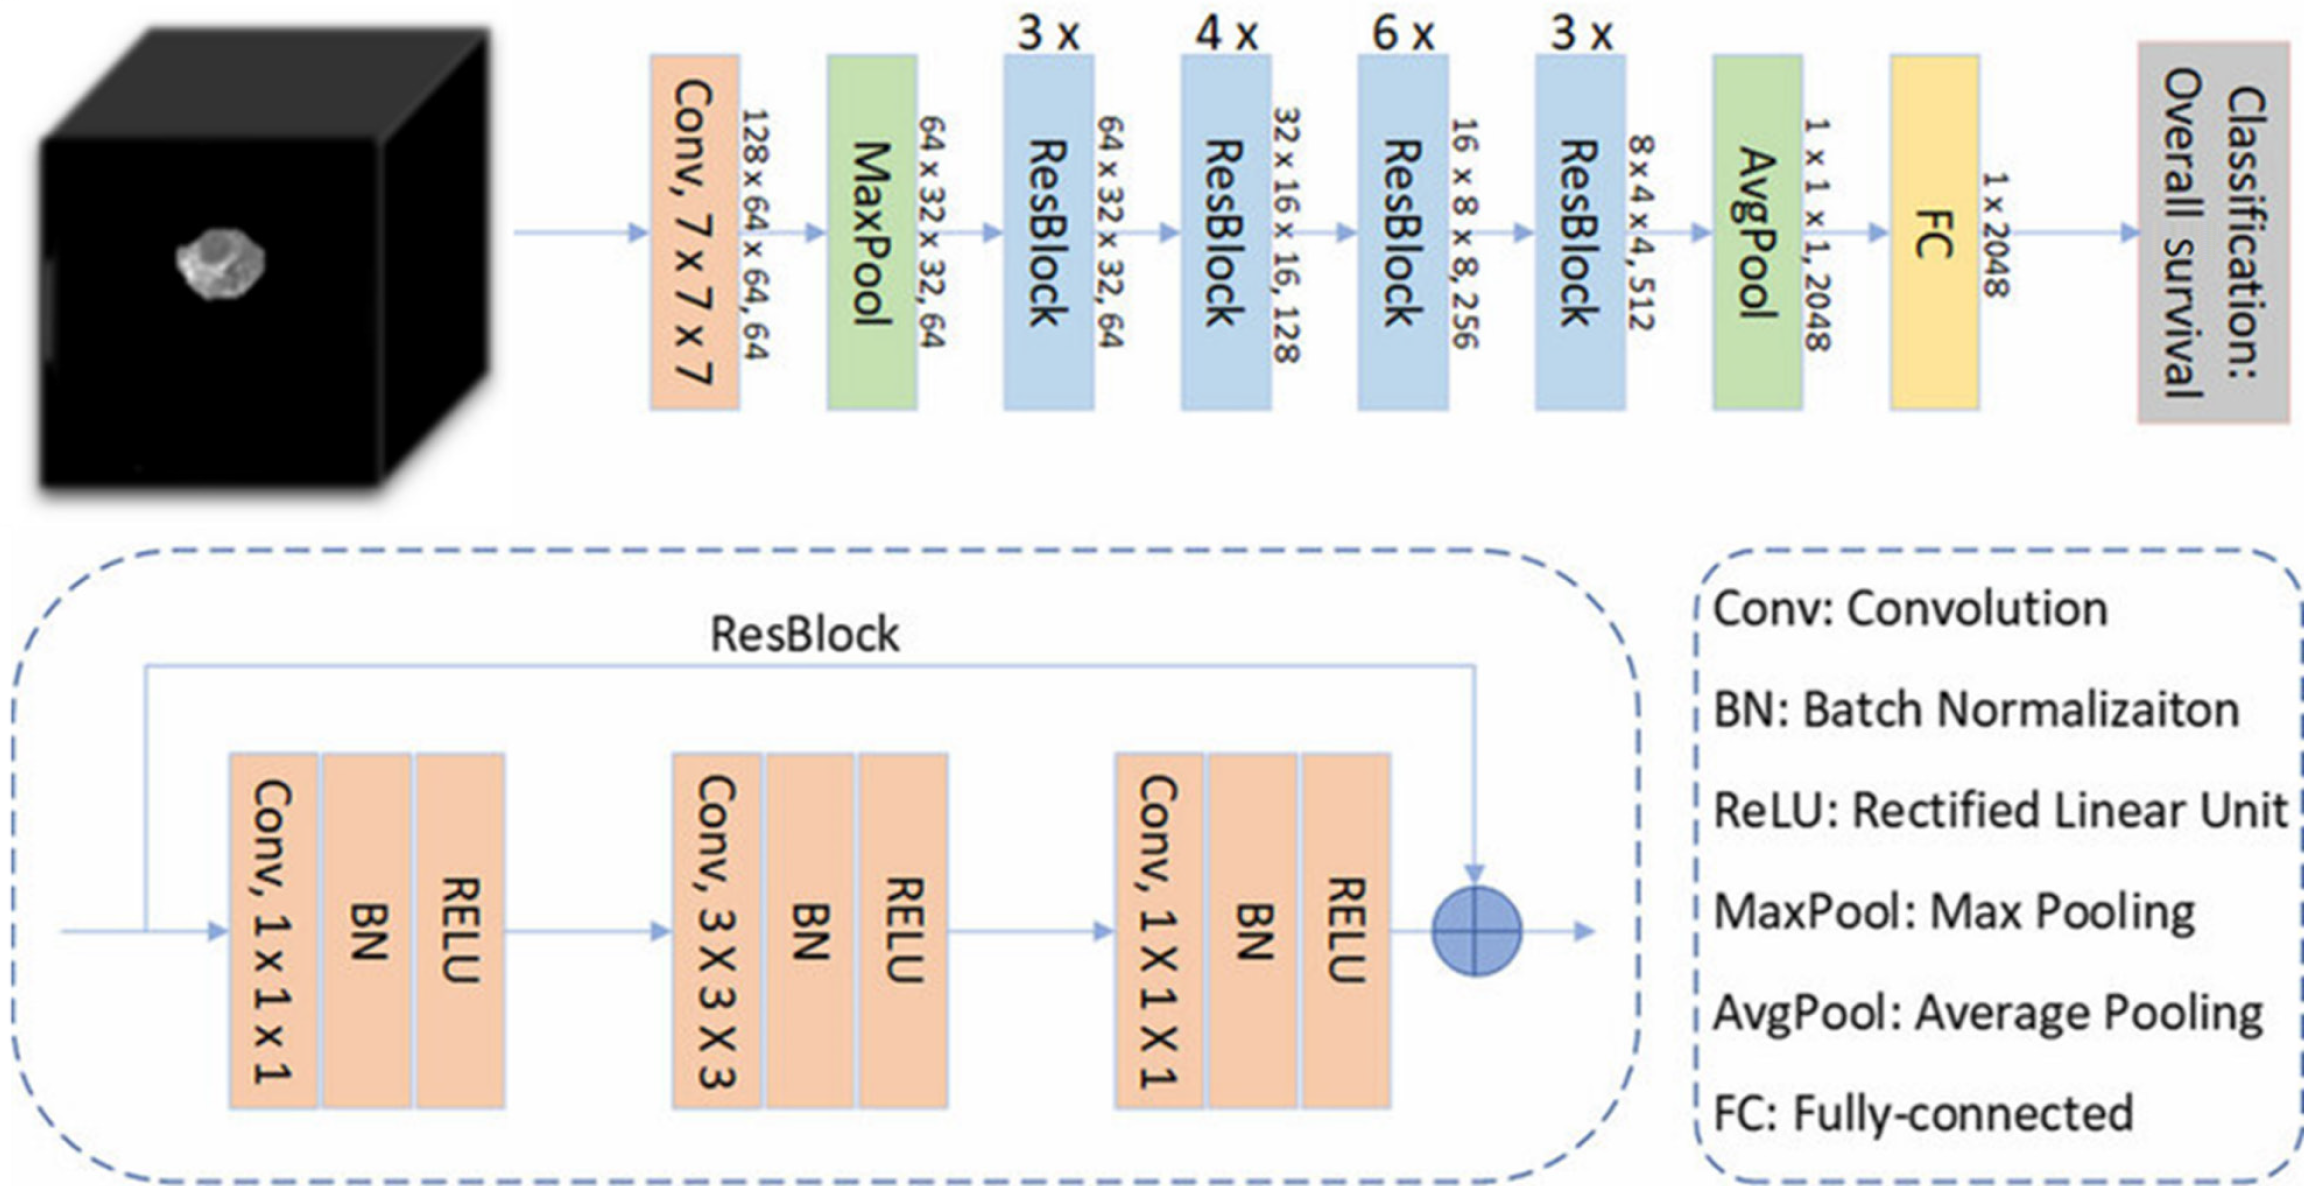
Figure 3 Schematic diagram of feature extraction process.
BN: Batch normalization; RELU: Rectified linear unit.
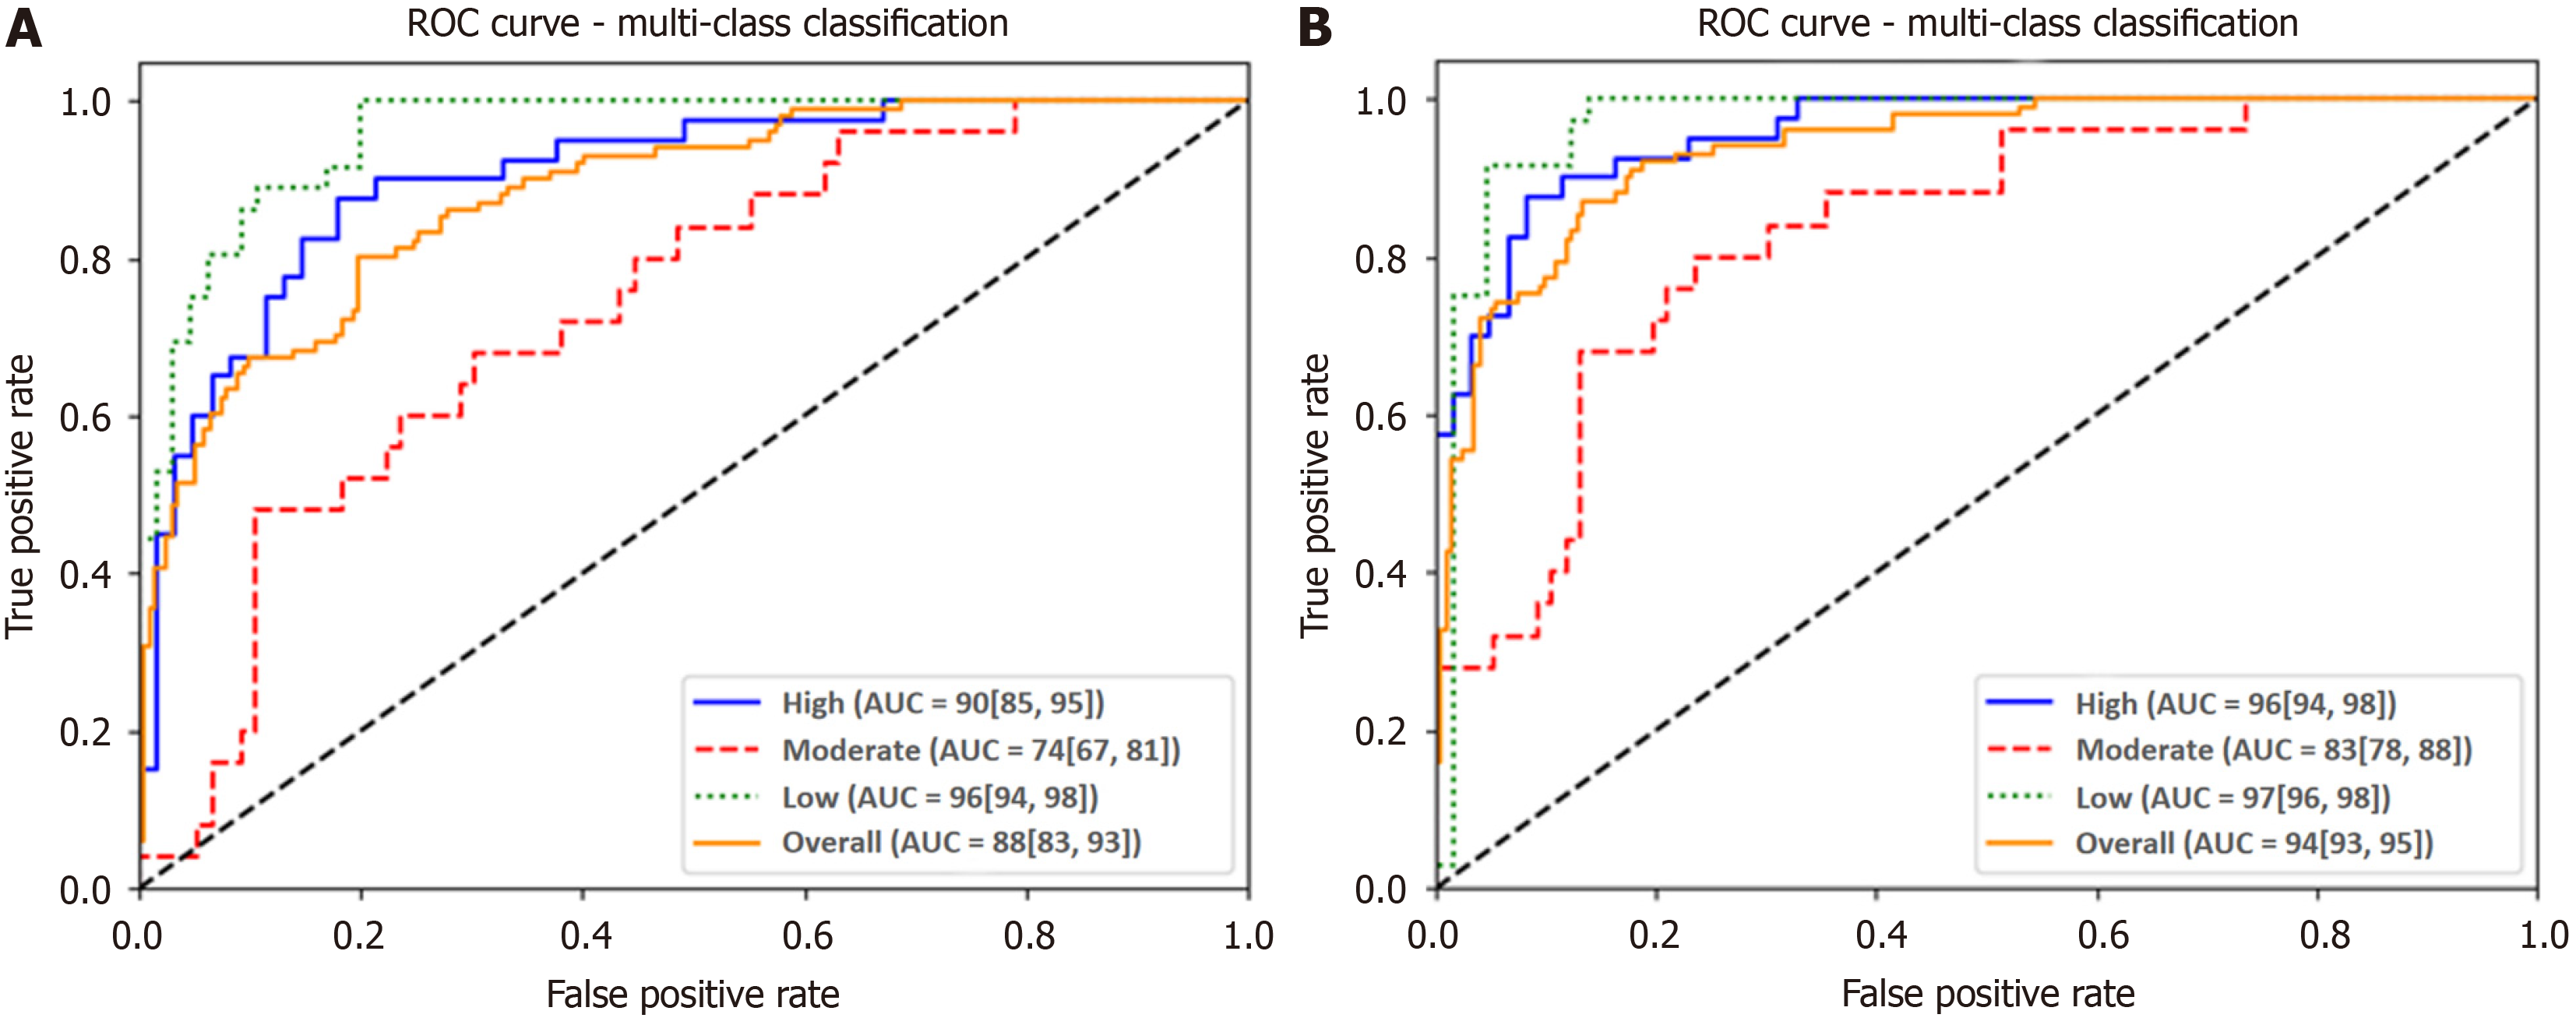
Figure 4 Receiver operating characteristic curves for the deep learning model and combined model.
A: Receiver operating characteristic curve (ROC) for the deep learning model in the validation cohort; B: ROC curve for the combined model in the validation cohort. ROC: Receiver operating characteristic; AUC: Area under the curve.
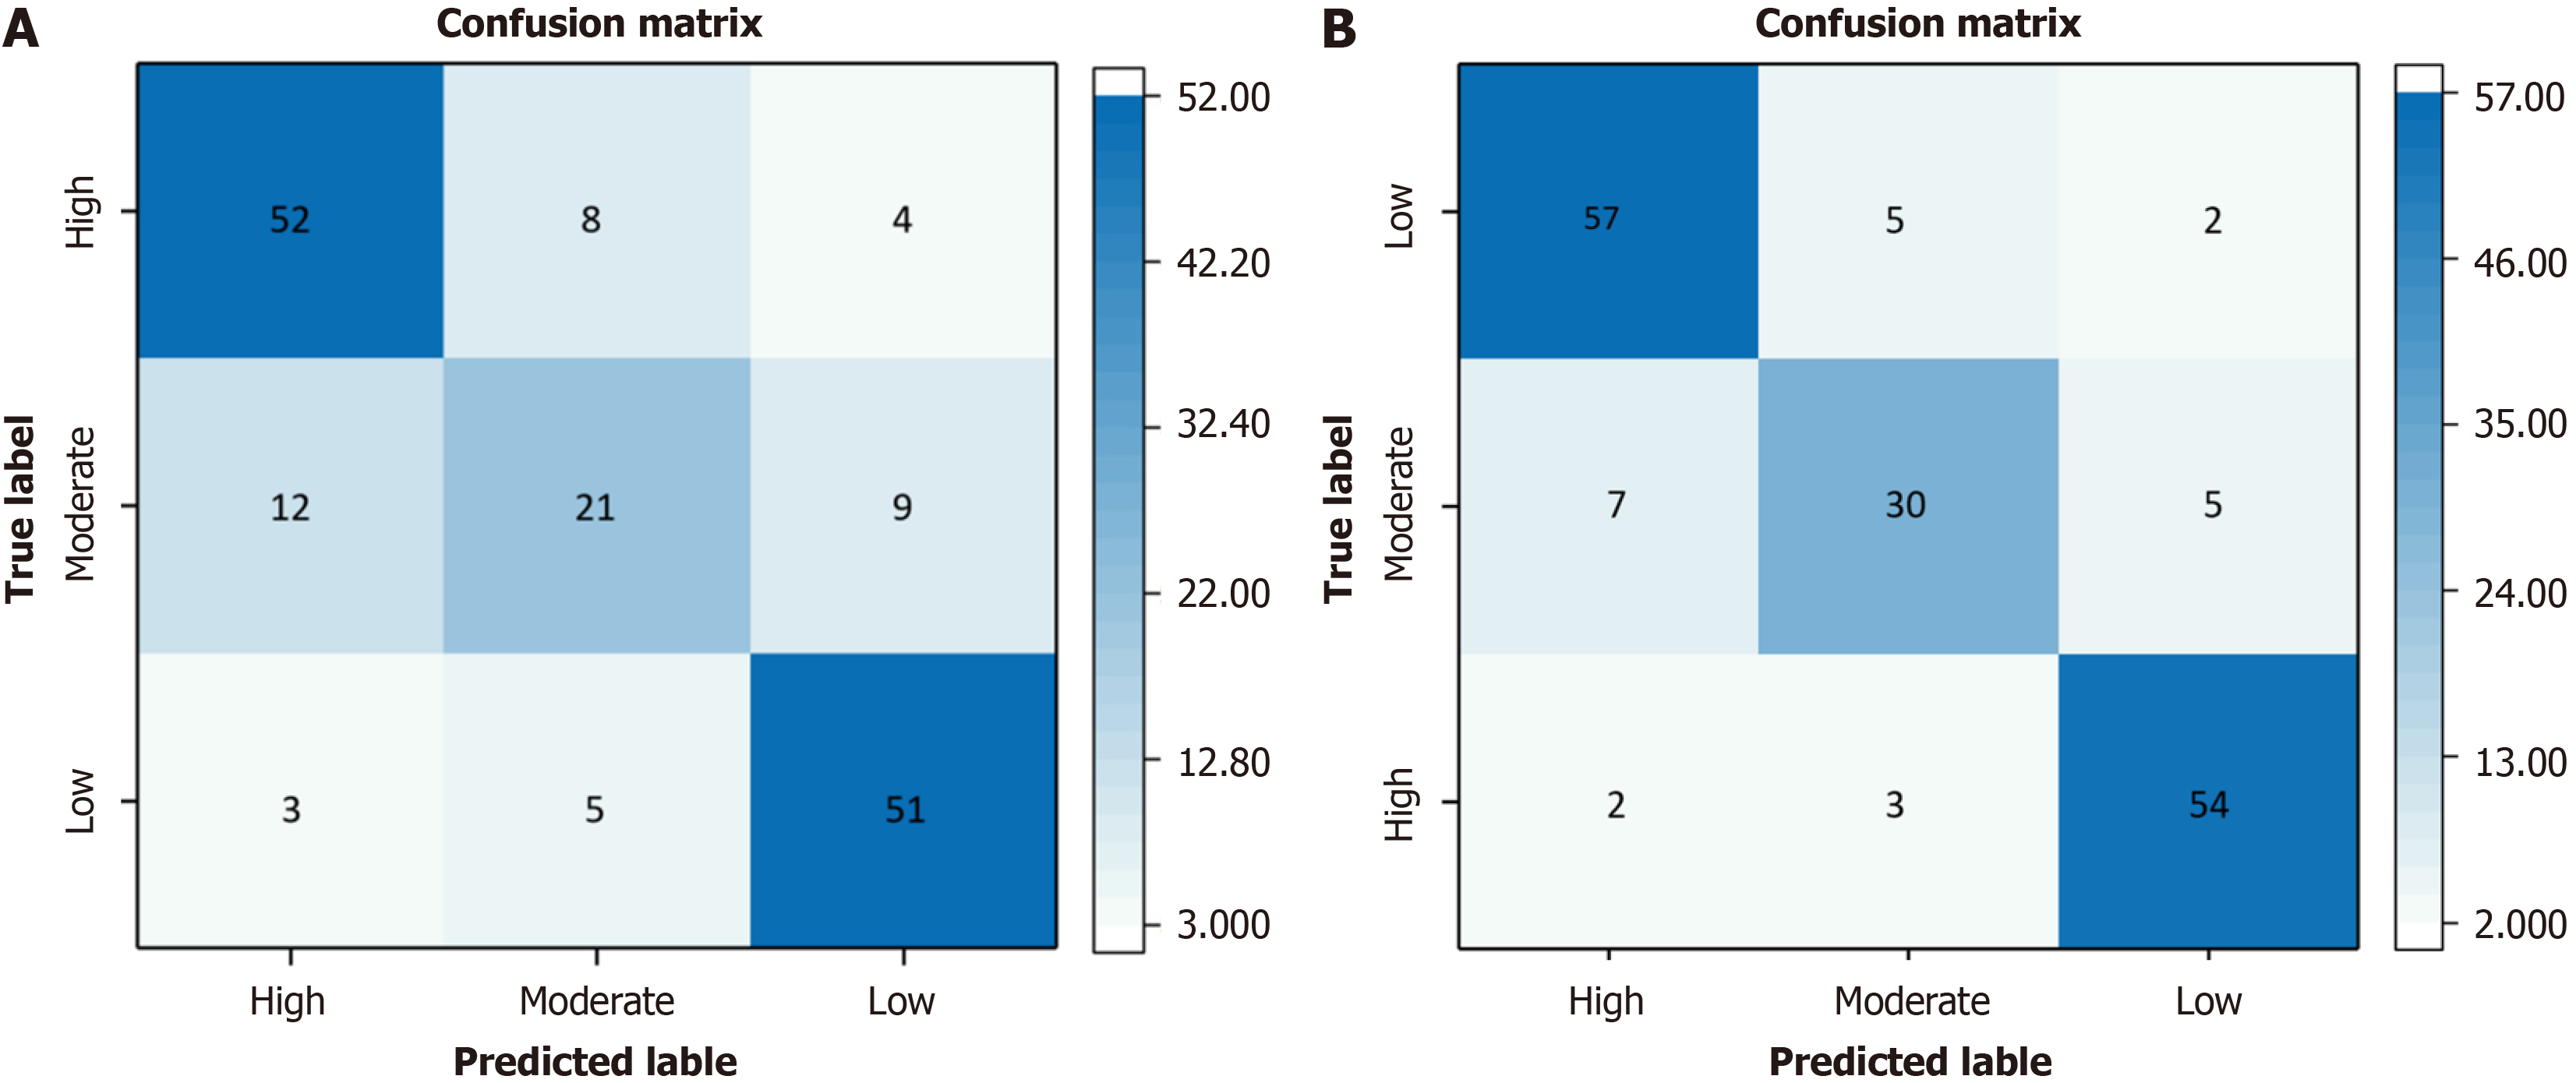
Figure 5 Confusion matrix for the deep learning model and combined model for gastrointestinal stromal tumors risk stratification.
A: Confusion matrix for the deep learning model; B: Confusion matrix for the combined model.
- Citation: Li Y, Liu YB, Li XB, Cui XN, Meng DH, Yuan CC, Ye ZX. Deep learning model combined with computed tomography features to preoperatively predicting the risk stratification of gastrointestinal stromal tumors. World J Gastrointest Oncol 2024; 16(12): 4663-4674
- URL: https://www.wjgnet.com/1948-5204/full/v16/i12/4663.htm
- DOI: https://dx.doi.org/10.4251/wjgo.v16.i12.4663


