Copyright
©The Author(s) 2024.
World J Gastrointest Oncol. Dec 15, 2024; 16(12): 4614-4624
Published online Dec 15, 2024. doi: 10.4251/wjgo.v16.i12.4614
Published online Dec 15, 2024. doi: 10.4251/wjgo.v16.i12.4614
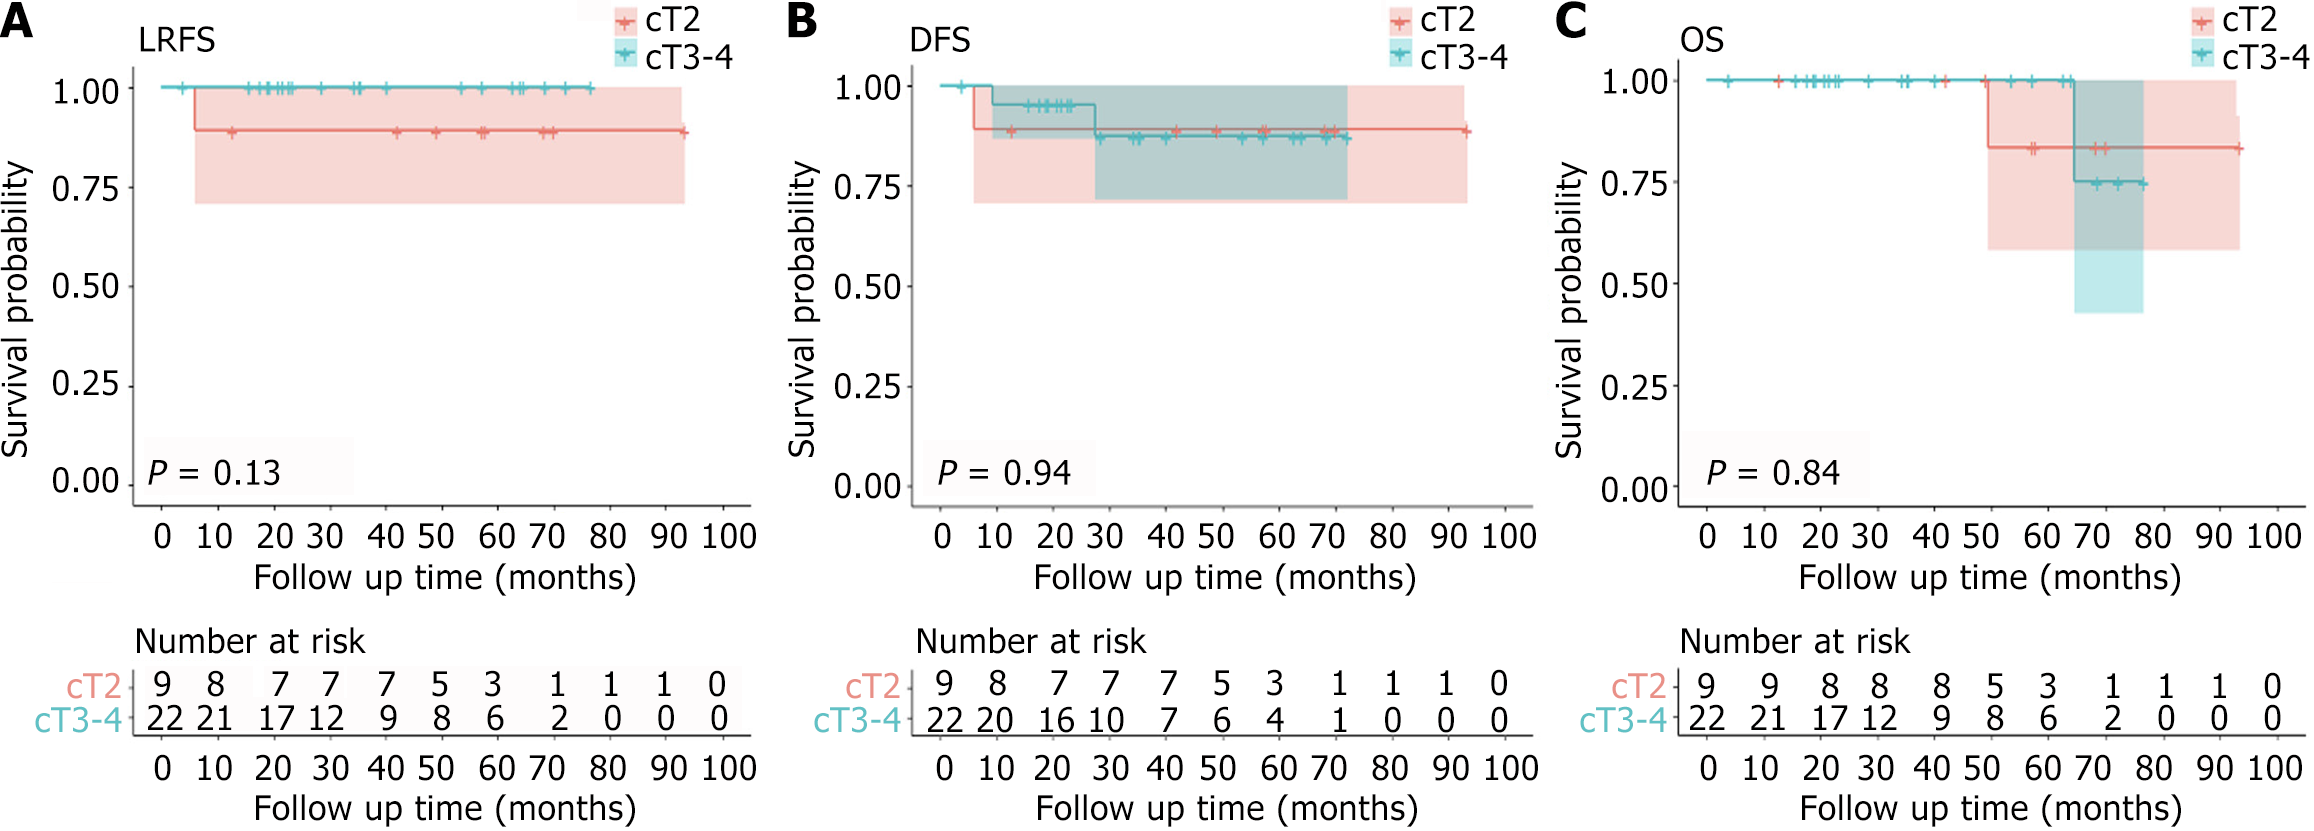
Figure 1 The prognosis analysis of 31 cM0 patients by Kaplan–Meier curves for cT stage groups.
A: Local recurrence-free survival curves (P = 0.127); B: Disease-free survival curves (P = 0.945); C: Overall survival curves (P = 0.838). LRFS: Local recurrence-free survival; DFS: Disease-free survival; OS: Overall survival.
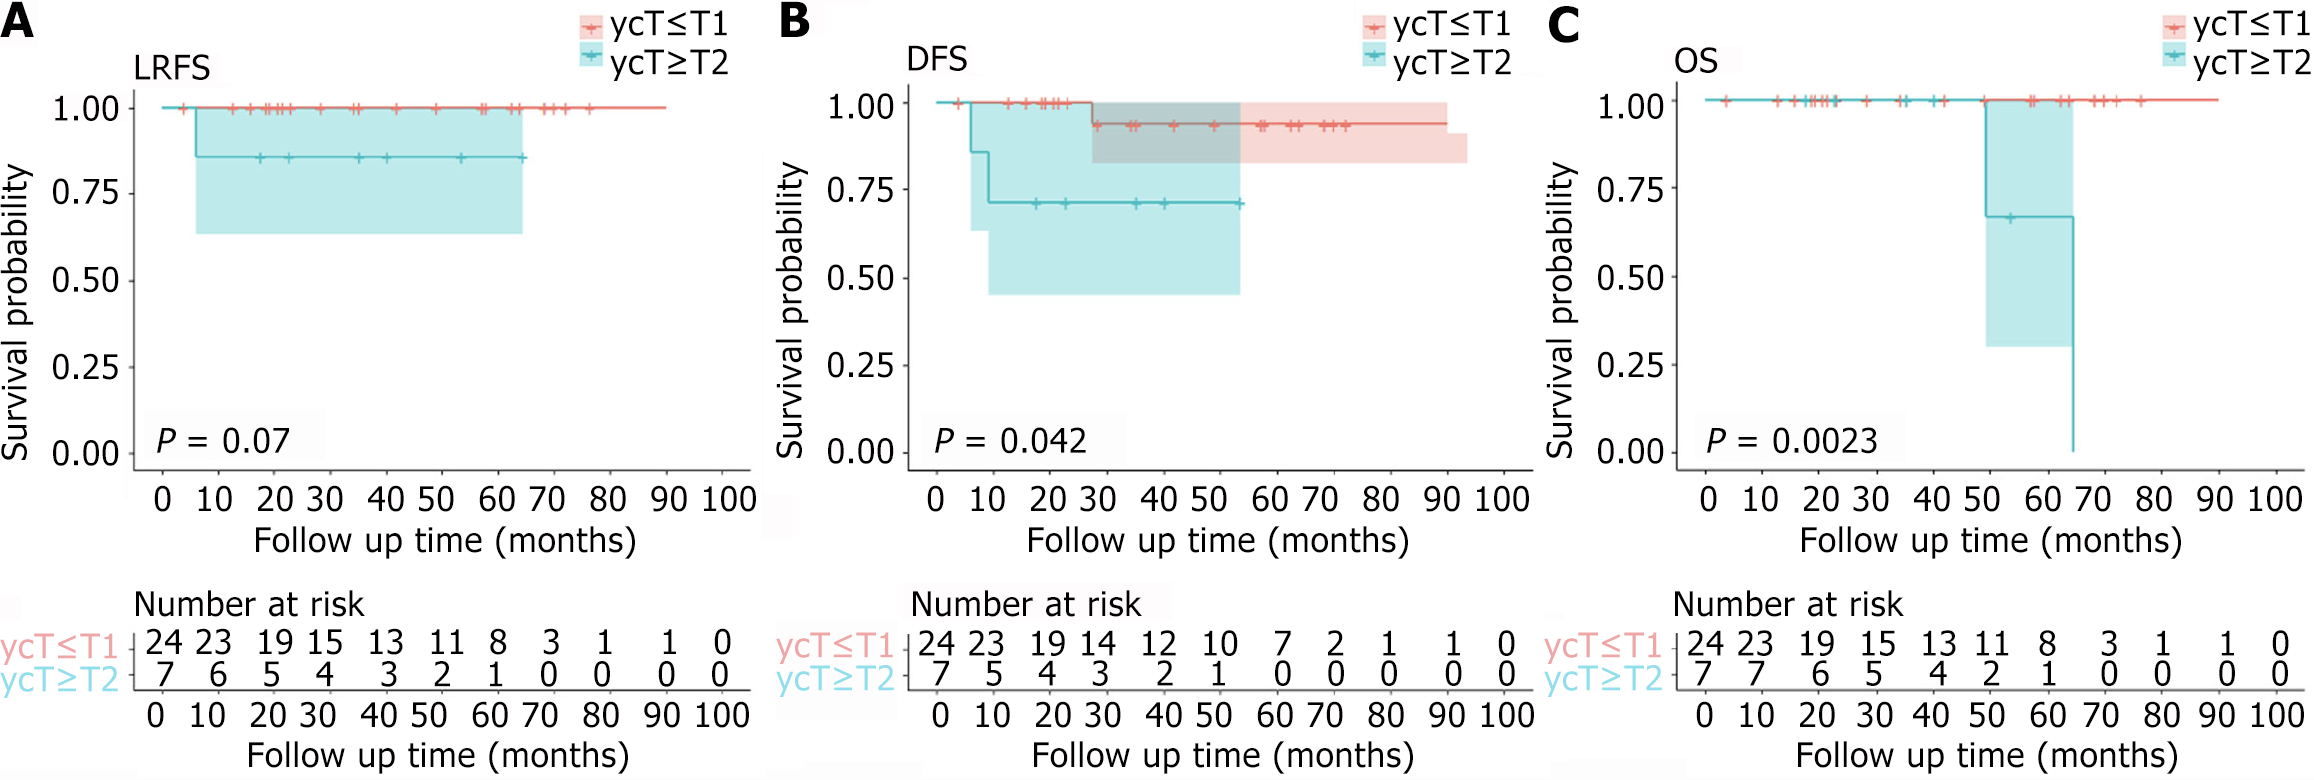
Figure 2 The prognosis analysis of 31 cM0 patients by Kaplan– Meier curves for ycT stage groups.
A: Local recurrence-free survival curves (P = 0.070); B: Disease-free survival curves (P = 0.042); C: Overall survival curves (P = 0.002). LRFS: Local recurrence-free survival; DFS: Disease-free survival; OS: Overall survival.
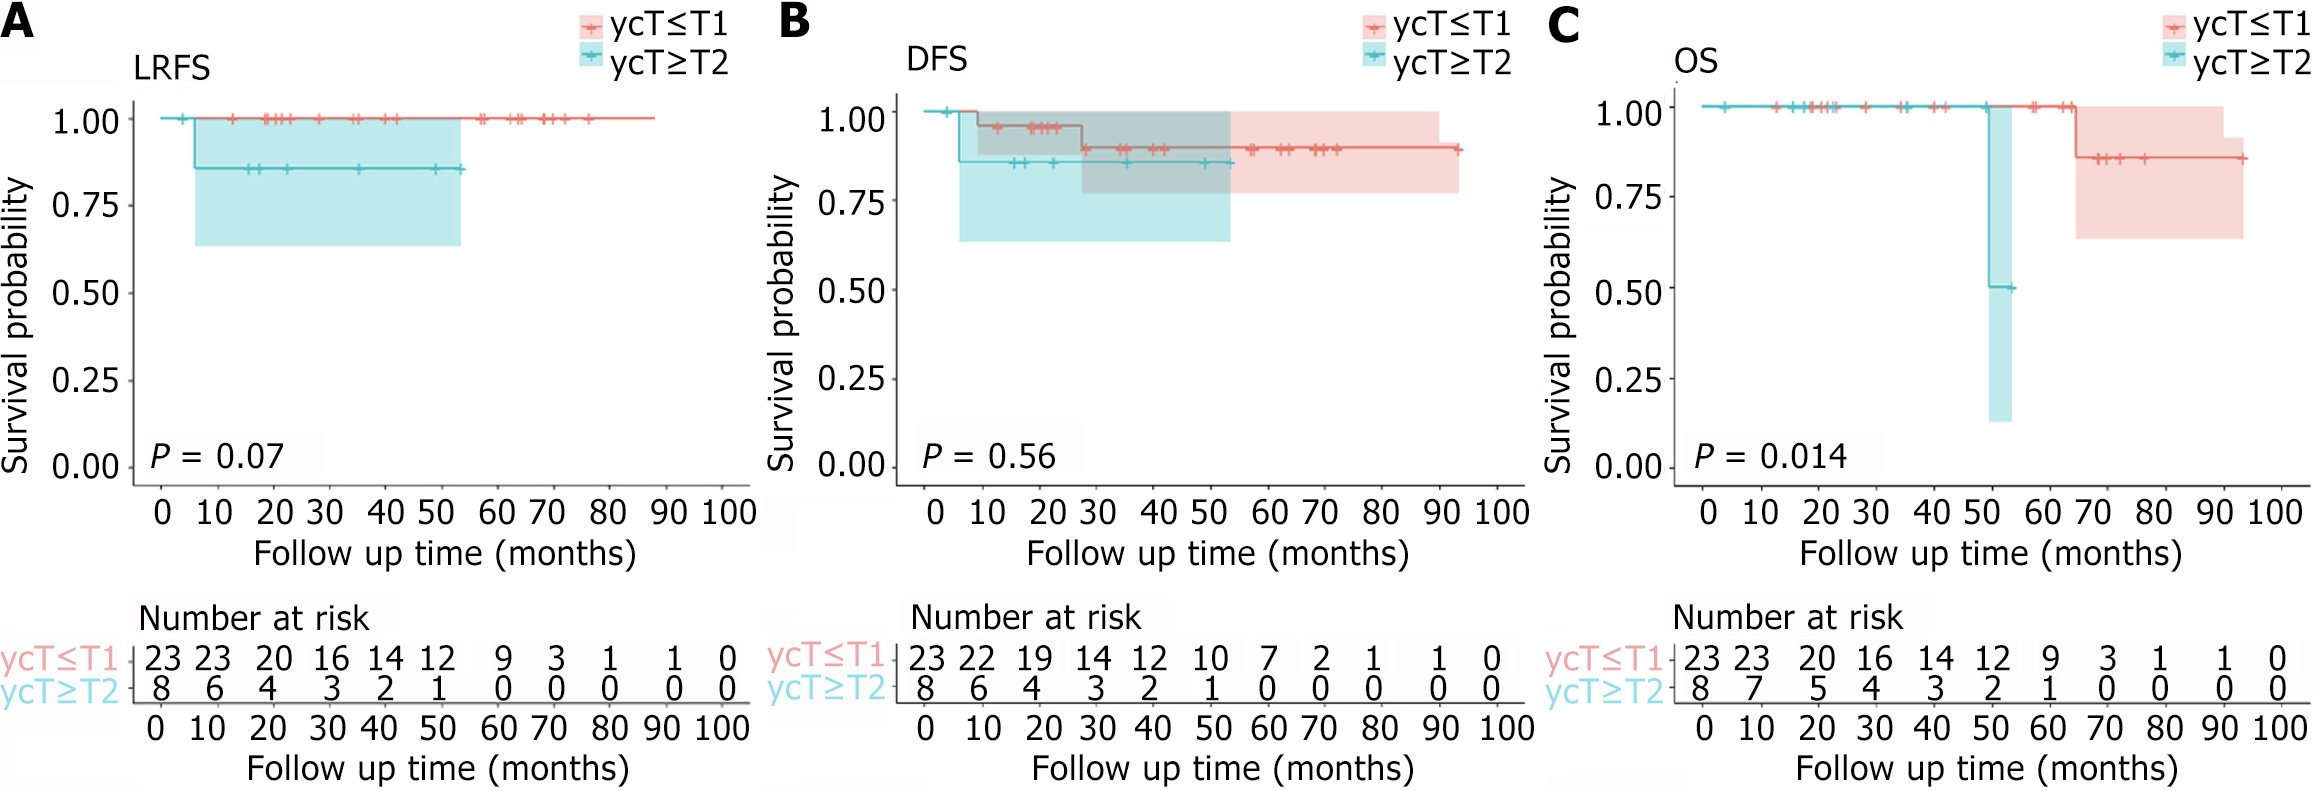
Figure 3 The prognosis analysis of 31 cM0 patients by Kaplan–Meier curves for ypT stage groups.
A: Local recurrence-free survival curves (P = 0.070); B: Disease-free survival curves (P = 0.560); C: Overall survival curves (P = 0.014). LRFS: Local recurrence-free survival; DFS: Disease-free survival; OS: Overall survival.
- Citation: Chen N, Li CL, Wang L, Yao YF, Peng YF, Zhan TC, Zhao J, Wu AW. Local excision for middle-low rectal cancer after neoadjuvant chemoradiation: A retrospective study from a single tertiary center. World J Gastrointest Oncol 2024; 16(12): 4614-4624
- URL: https://www.wjgnet.com/1948-5204/full/v16/i12/4614.htm
- DOI: https://dx.doi.org/10.4251/wjgo.v16.i12.4614


