©The Author(s) 2023.
World J Gastrointest Oncol. Jul 15, 2023; 15(7): 1295-1310
Published online Jul 15, 2023. doi: 10.4251/wjgo.v15.i7.1295
Published online Jul 15, 2023. doi: 10.4251/wjgo.v15.i7.1295
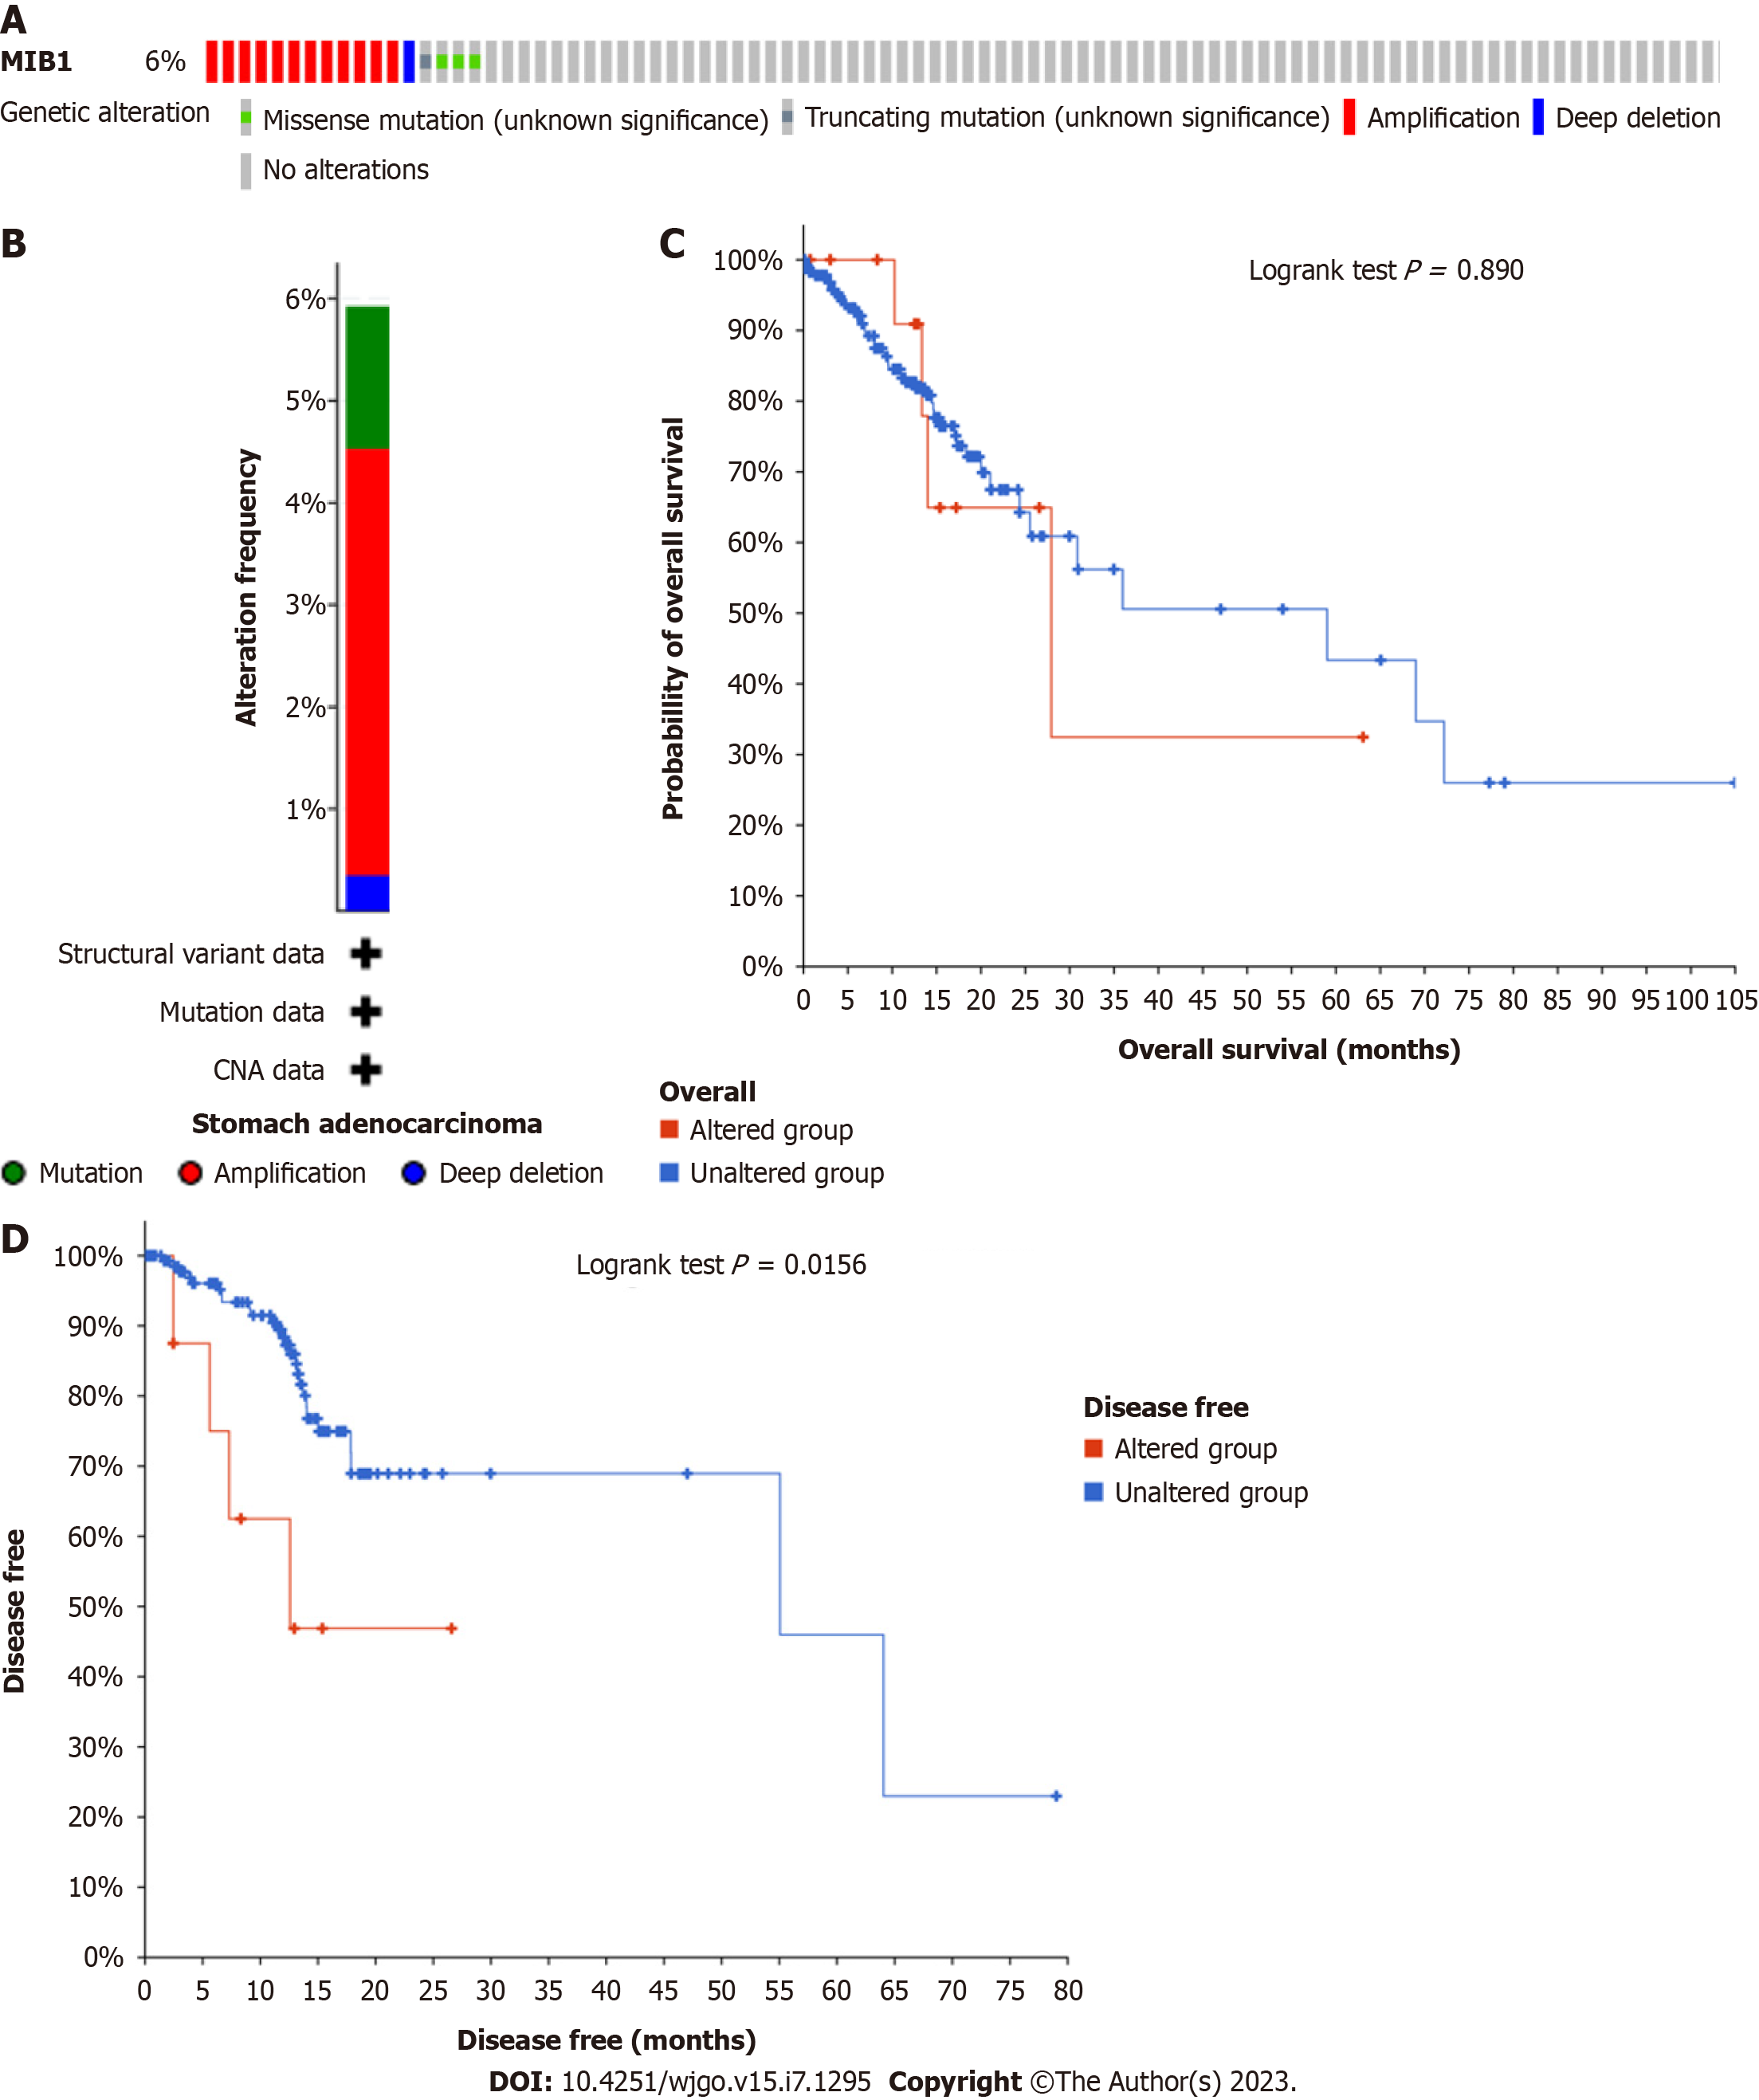
Figure 1 Mutation of mind bomb 1 gene in stomach adenocarcinoma is found in cBioPortal database.
A: OncoPrint indicate different types and proportions of mind bomb 1 (MIB1) mutations; B: Summary of cancer types shows the type of genomic alterations in stomach adenocarcinoma; C: Kaplan-Meier showed the overall survival rate of patients with and without copy number alteration (CNA) of MIB1; D: Kaplan-Meier showed the disease-free survival rate of patients with and without CNA of MIB1.
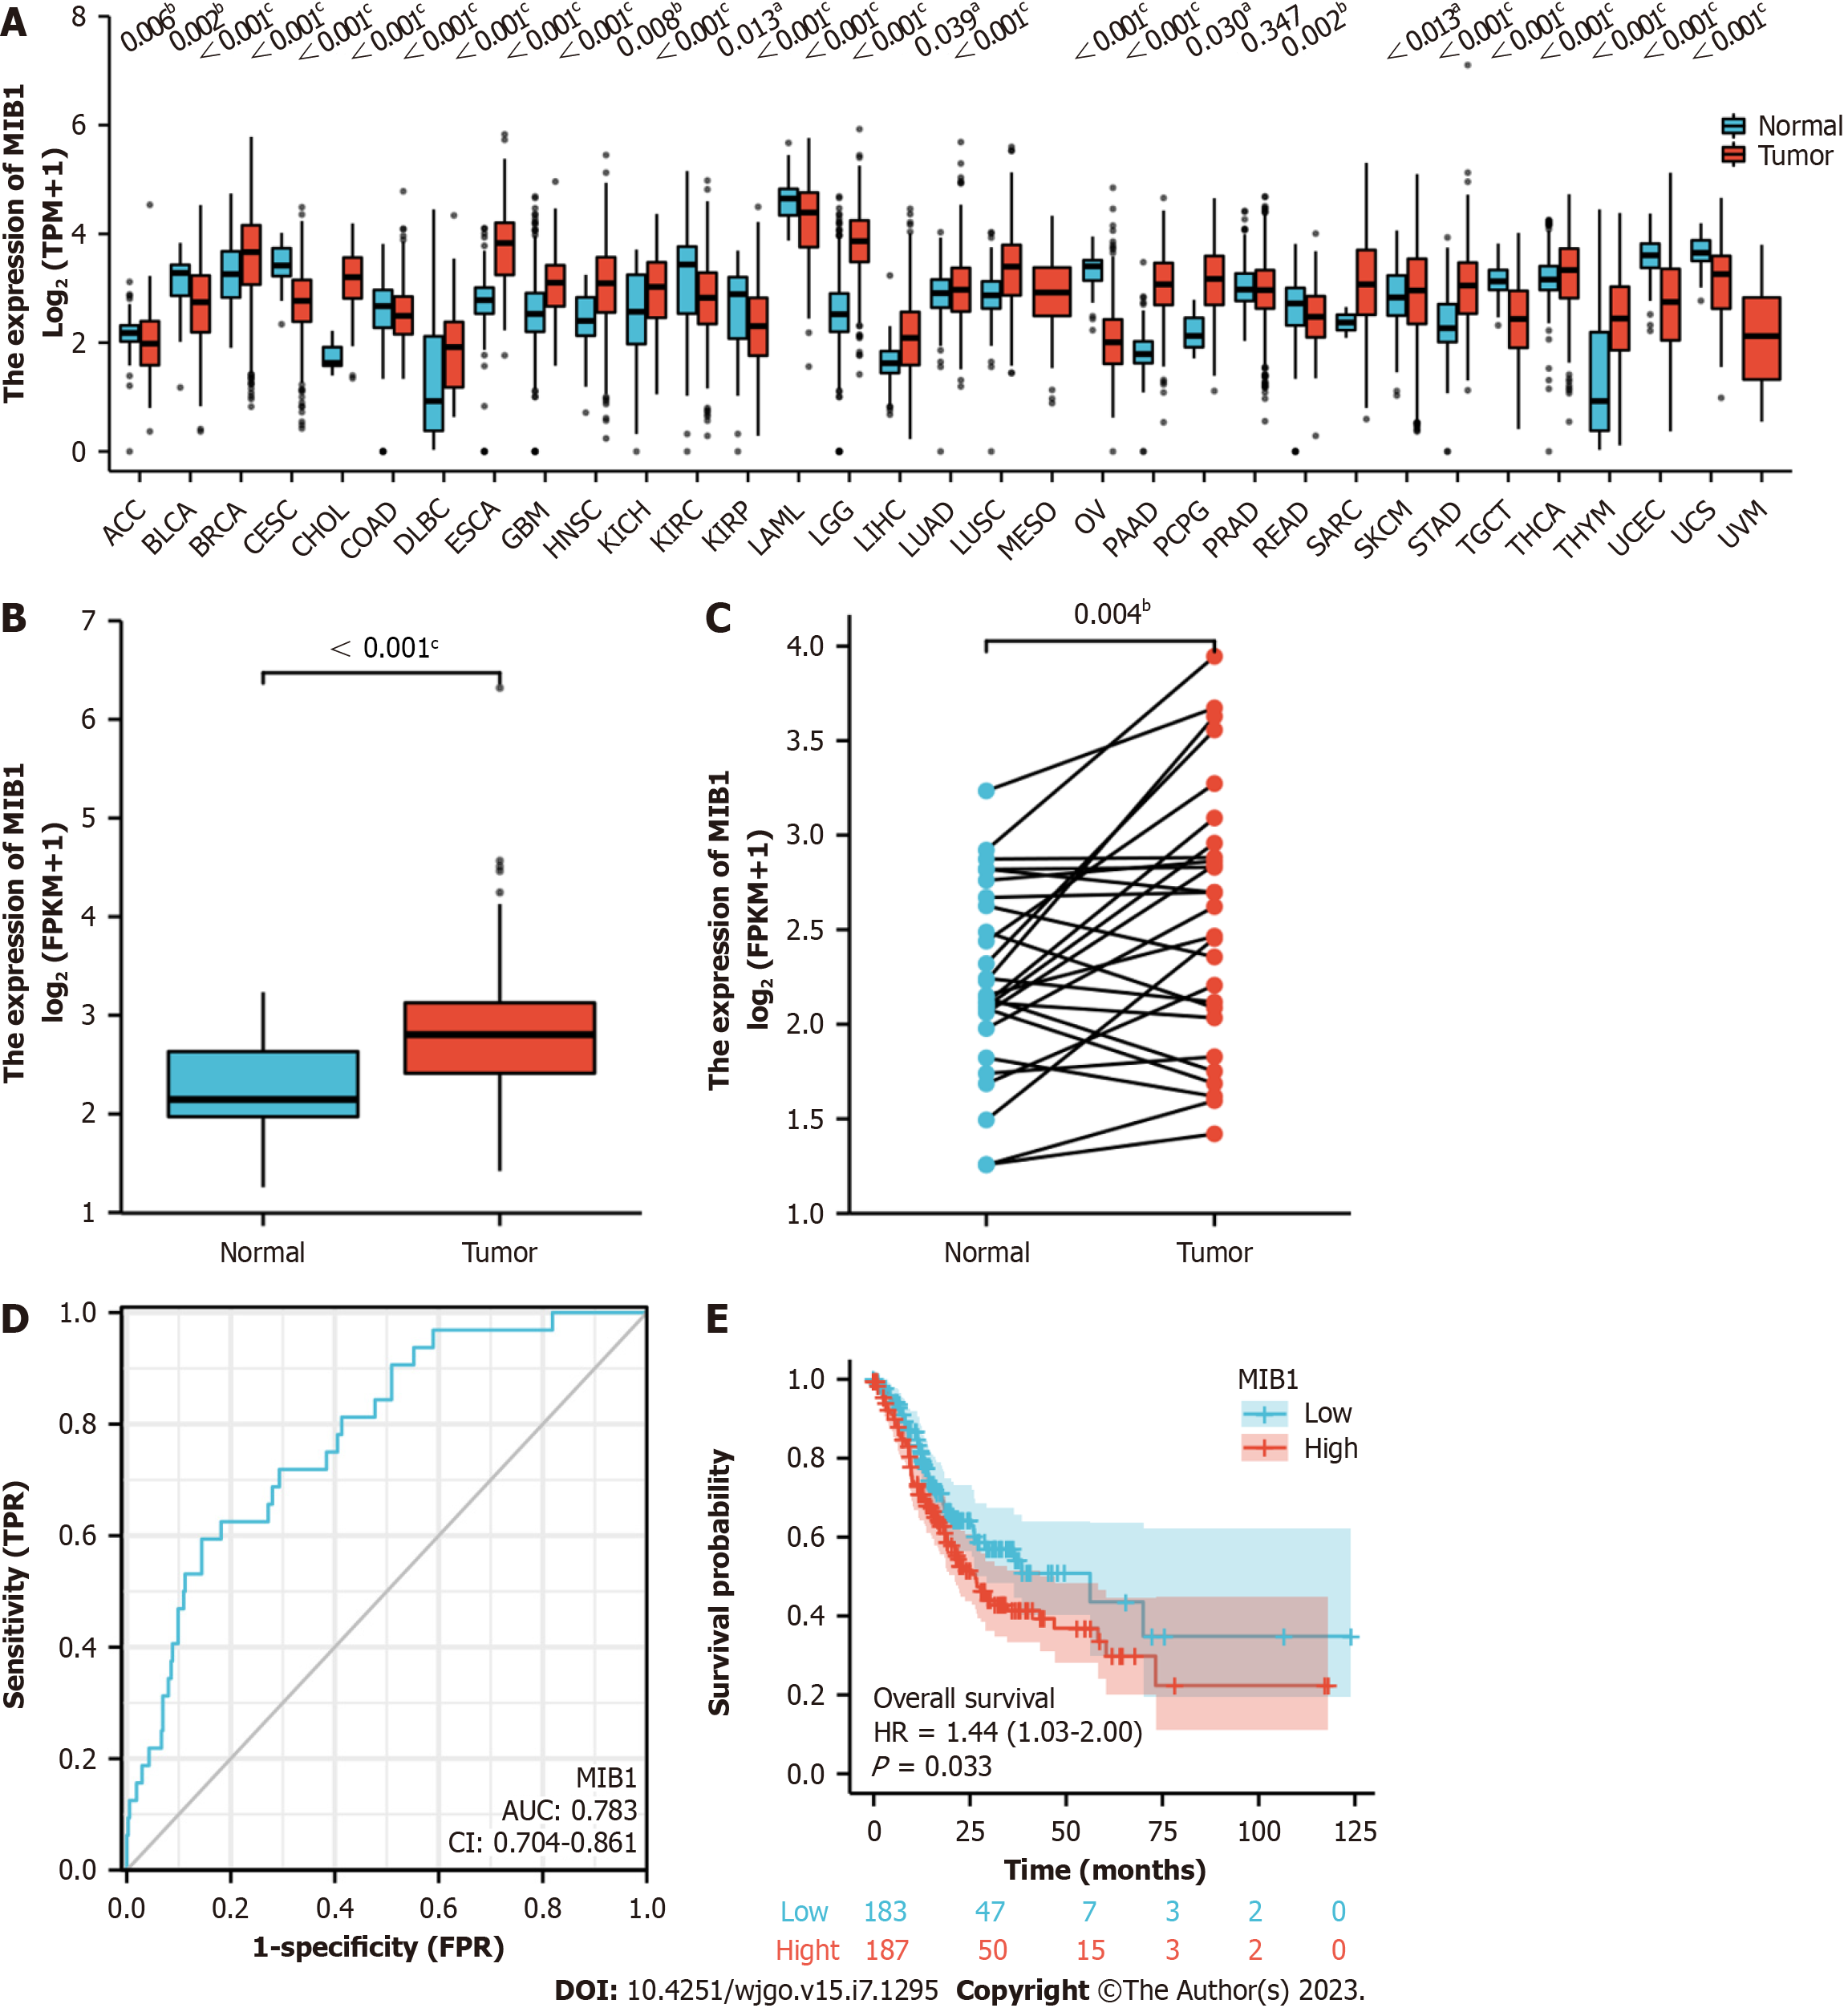
Figure 2 Expression,diagnostic value and prognosis of mind bomb 1 gene.
A: Mind bomb 1 (MIB1) expression from pan-cancer perspective; B: MIB1 mRNA expression levels in 375 gastric adenocarcinoma samples and 32 normal samples; C: MIB1 mRNA expression levels in 27 gastric adenocarcinomas and matched adjacent normal samples; D: Receiver operating characteristic curve showed that the area under the curve value of MIB1 in distinguishing gastric adenocarcinoma tissues from healthy controls was 0.783. The cutoff was 2.248, and the sensitivity, specificity and accuracy were 59.4% and 85.6%, respectively; E: Kaplan-Meier showed that the overall survival of gastric adenocarcinoma patients with high mRNA expression of MIB1 was shorter than that of patients with low expression (26.4 mo vs 56.2 mo, P = 0.033). aP < 0.05; bP < 0.01, cP < 0.001.
Figure 3 Coexpression analysis of mind bomb 1 gene.
A: A volcano plot of the mind bomb 1 (MIB1) and its co-expressed genes in gastric cancer; B: The Gene Ontology (GO) enrichment of the BP terms of 200 co-expressed genes; C: The GO enrichment of the CC terms of 200 co-expressed genes; D: The GO enrichment of the MF terms of 200 co-expressed genes; E: The Kyoto Encyclopedia of Genes and Genomes (KEGG) enrichment of the 200 co-expressed genes; F: The top 50 genes with a positive correlation with MIB1 gene are visualized in a heatmap; G: The top 50 genes with a negative correlation with the MIB1 gene are visualized in a heatmap; H: The protein-protein interaction network associated with the MIB1 in gastric cancer; I: The GO enrichment of the 11 genes with the strongest interaction with MIB1 proteins; J: The KEGG pathway terms of the 11 genes with the strongest interaction with MIB1 proteins. MIB1: Mind bomb 1.
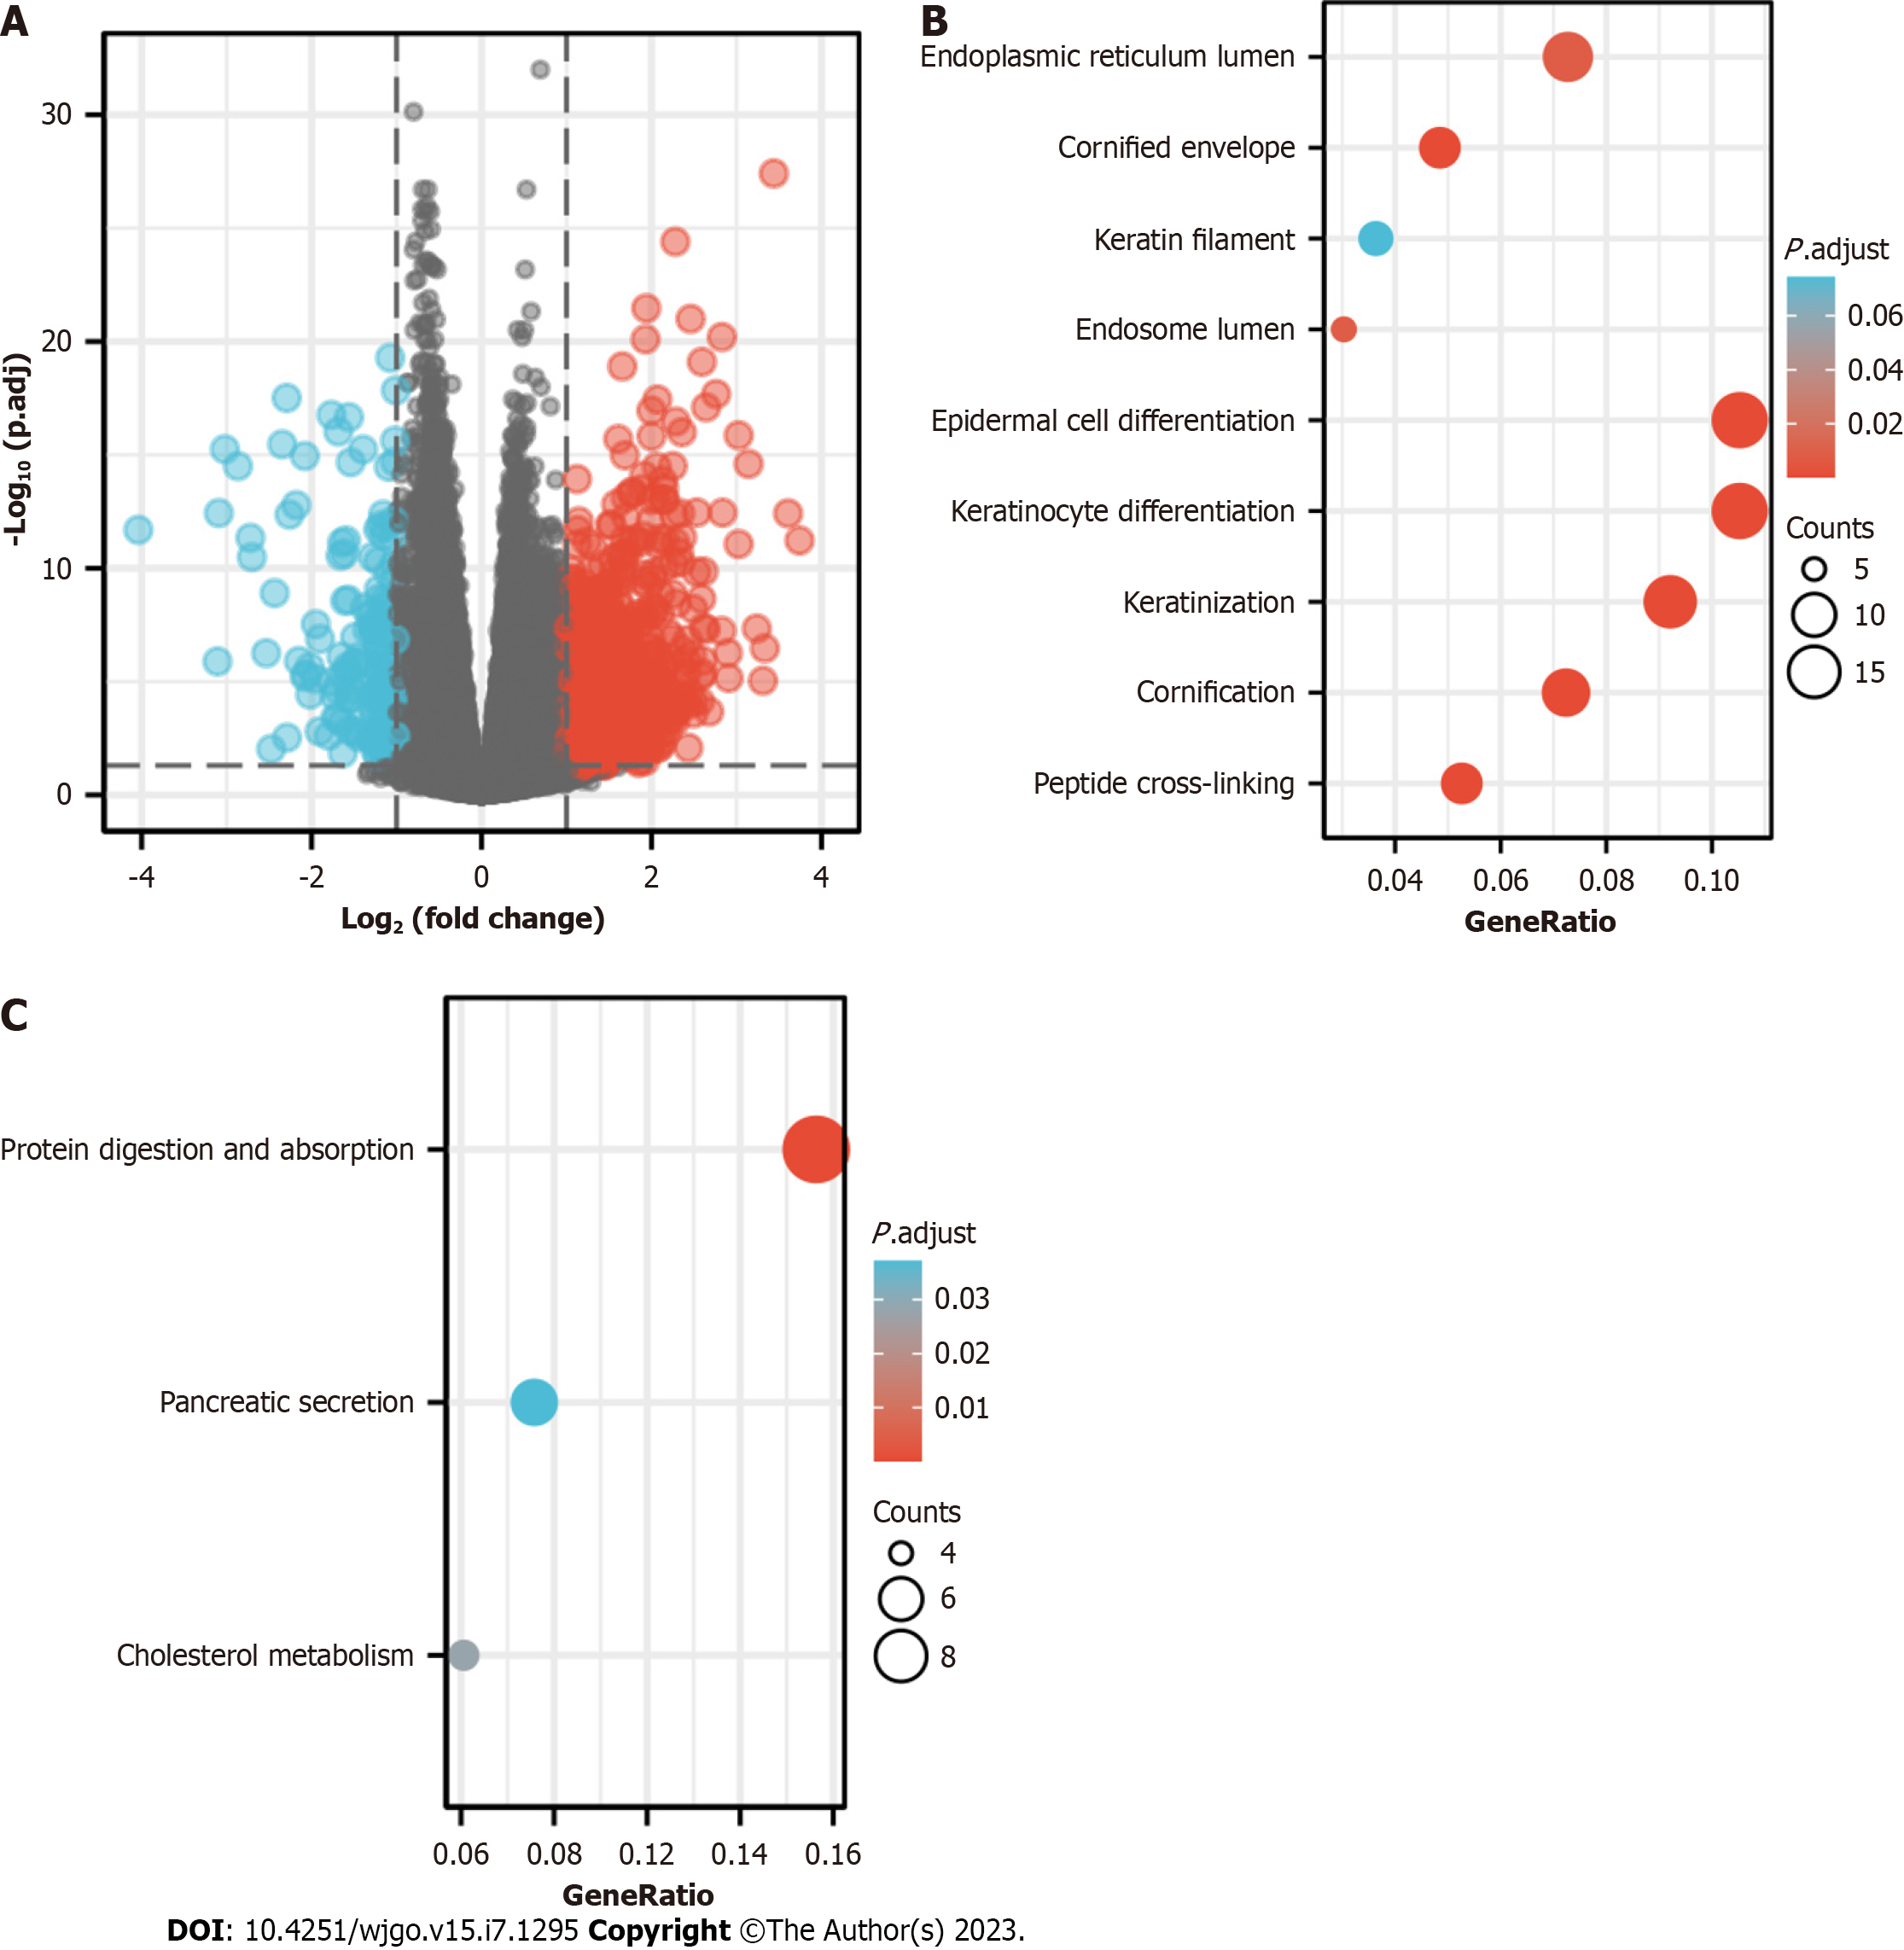
Figure 4 Enrichment analysis of mind bomb 1 in stomach adenocarcinoma.
A: Volcanic map of differential expression in gastric adenocarcinoma with |logFC| < 1.5 and adjusted P < 0.05; B: Gene Ontology enrichment analysis of differentially expressed genes; C: Kyoto Encyclopedia of Genes and Genomes enrichment analysis of differentially expressed genes.
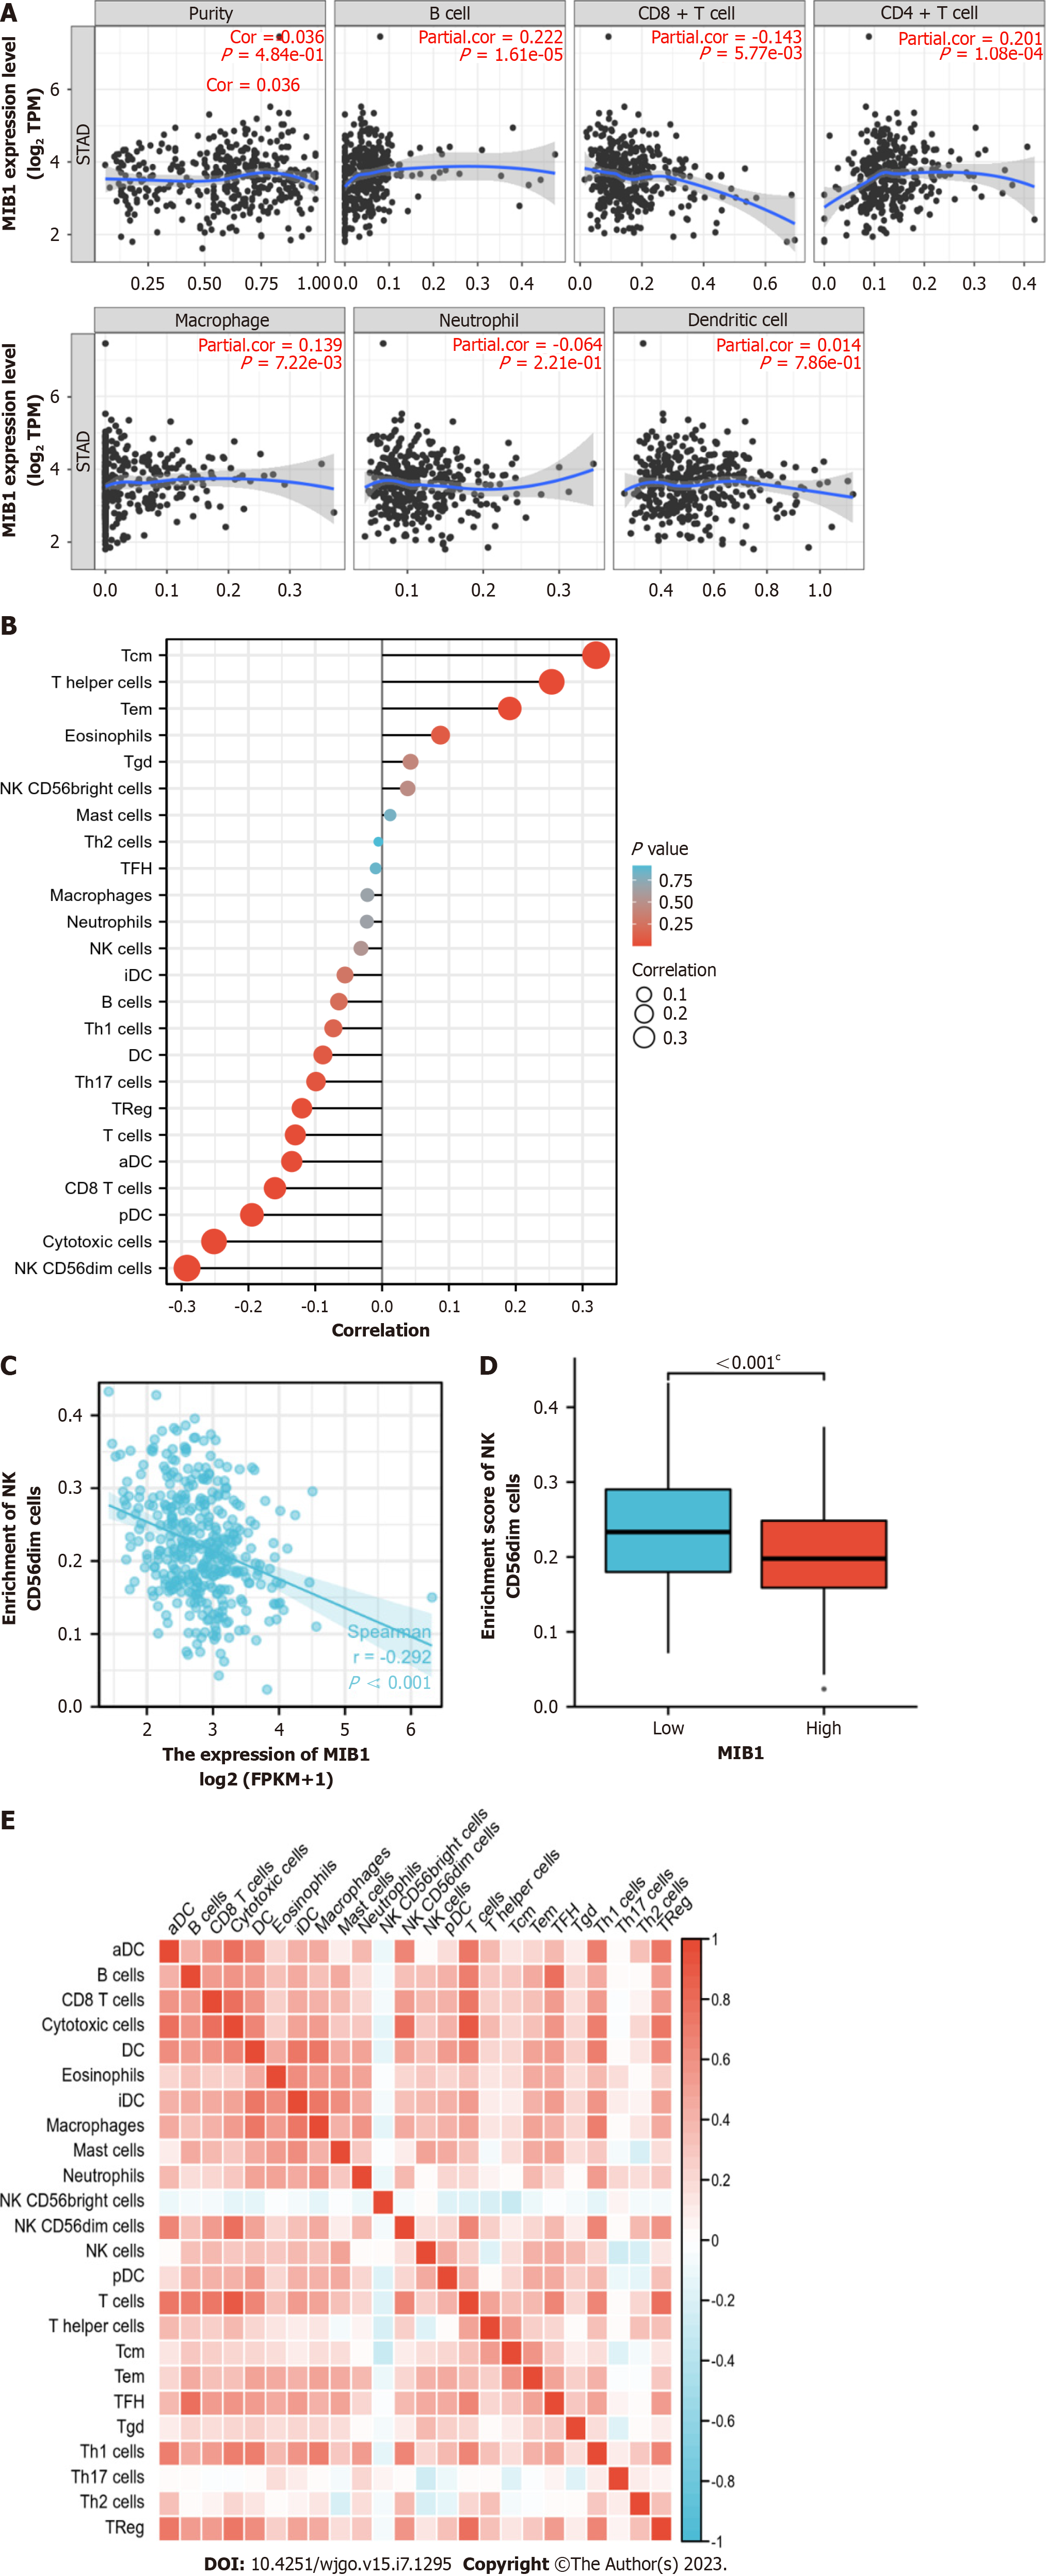
Figure 5 Analysis of the relationship between mind bomb 1 expression and immune infiltration.
A: In gastric adenocarcinoma, the expression of mind bomb 1 (MIB1) was negatively correlated with CD8+ T cells, and correlated with B cells, CD4+ T cells and macrophages; B: The correlation between the expression level of MIB1 and the relative abundance of 24 immune cells; C: The expression of MIB1 was negatively correlated with NK CD56dim cells; D: NK CD56dim cell infiltration level in different expression groups of MIB1; E: Heat map of 24 immune infiltrating cells in stomach adenocarcinoma.
- Citation: Wang D, Wang QH, Luo T, Jia W, Wang J. Comprehensive bioinformatic analysis of mind bomb 1 gene in stomach adenocarcinoma. World J Gastrointest Oncol 2023; 15(7): 1295-1310
- URL: https://www.wjgnet.com/1948-5204/full/v15/i7/1295.htm
- DOI: https://dx.doi.org/10.4251/wjgo.v15.i7.1295


