©The Author(s) 2023.
World J Gastrointest Oncol. Jun 15, 2023; 15(6): 1005-1018
Published online Jun 15, 2023. doi: 10.4251/wjgo.v15.i6.1005
Published online Jun 15, 2023. doi: 10.4251/wjgo.v15.i6.1005
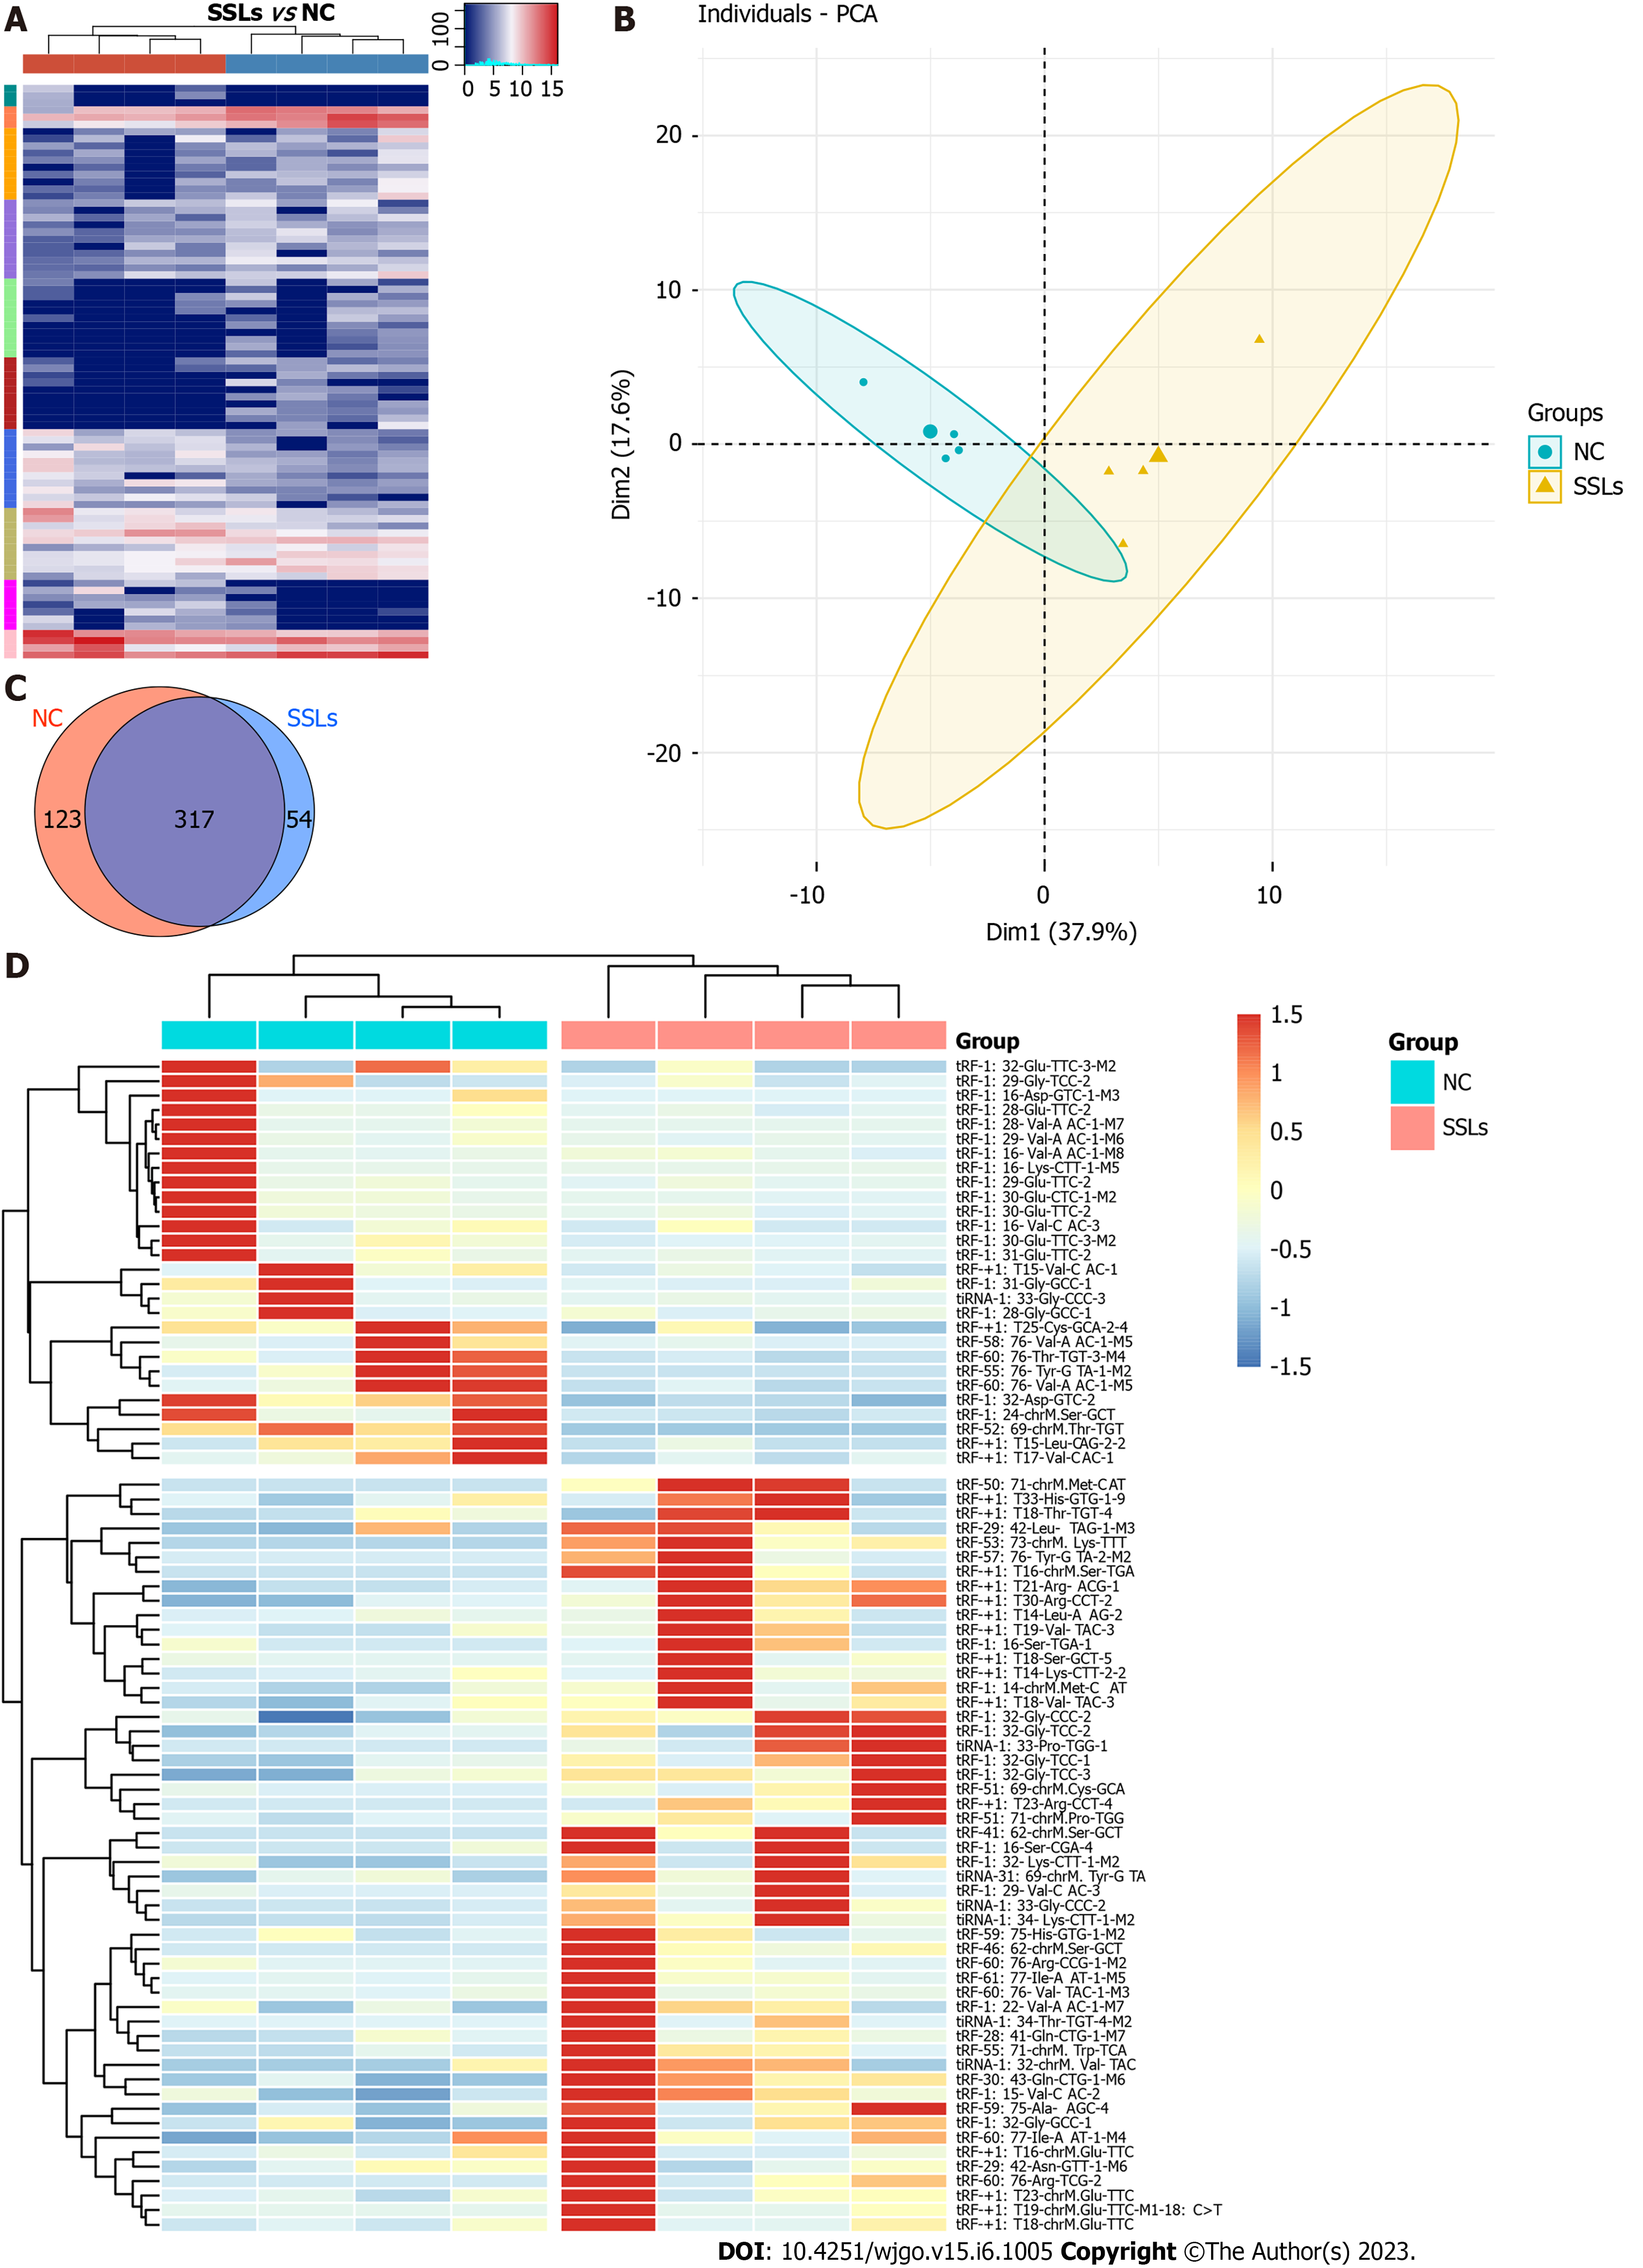
Figure 1 Expression profiles of transfer RNA-related fragments and transfer RNA halves in paired sessile serrated lesions and normal control groups.
A: Hierarchical clustering analysis of transfer RNA (tRNA)-related fragment (tRF)- and tRNA halves (tiRNAs)-expression data obtained from paired sessile serrated lesions (SSLs) and normal control (NC) groups. Cluster analysis arranged samples into groups based on the counts per million. All samples were categorized in 10 clusters using K-means clustering. B: Principal component analysis showed a distinguishable tRF- and tiRNA-expression profile among SSLs and NC. C: Venn diagram based on the number of basically expressed and specifically expressed tRFs and tiRNAs. D: Heatmap revealed results of dysregulated tRFs and tiRNAs obtained using hierarchical clustering analysis. SSLs: Sessile serrated lesions; NC: Normal control; PCA: Principal component analysis.
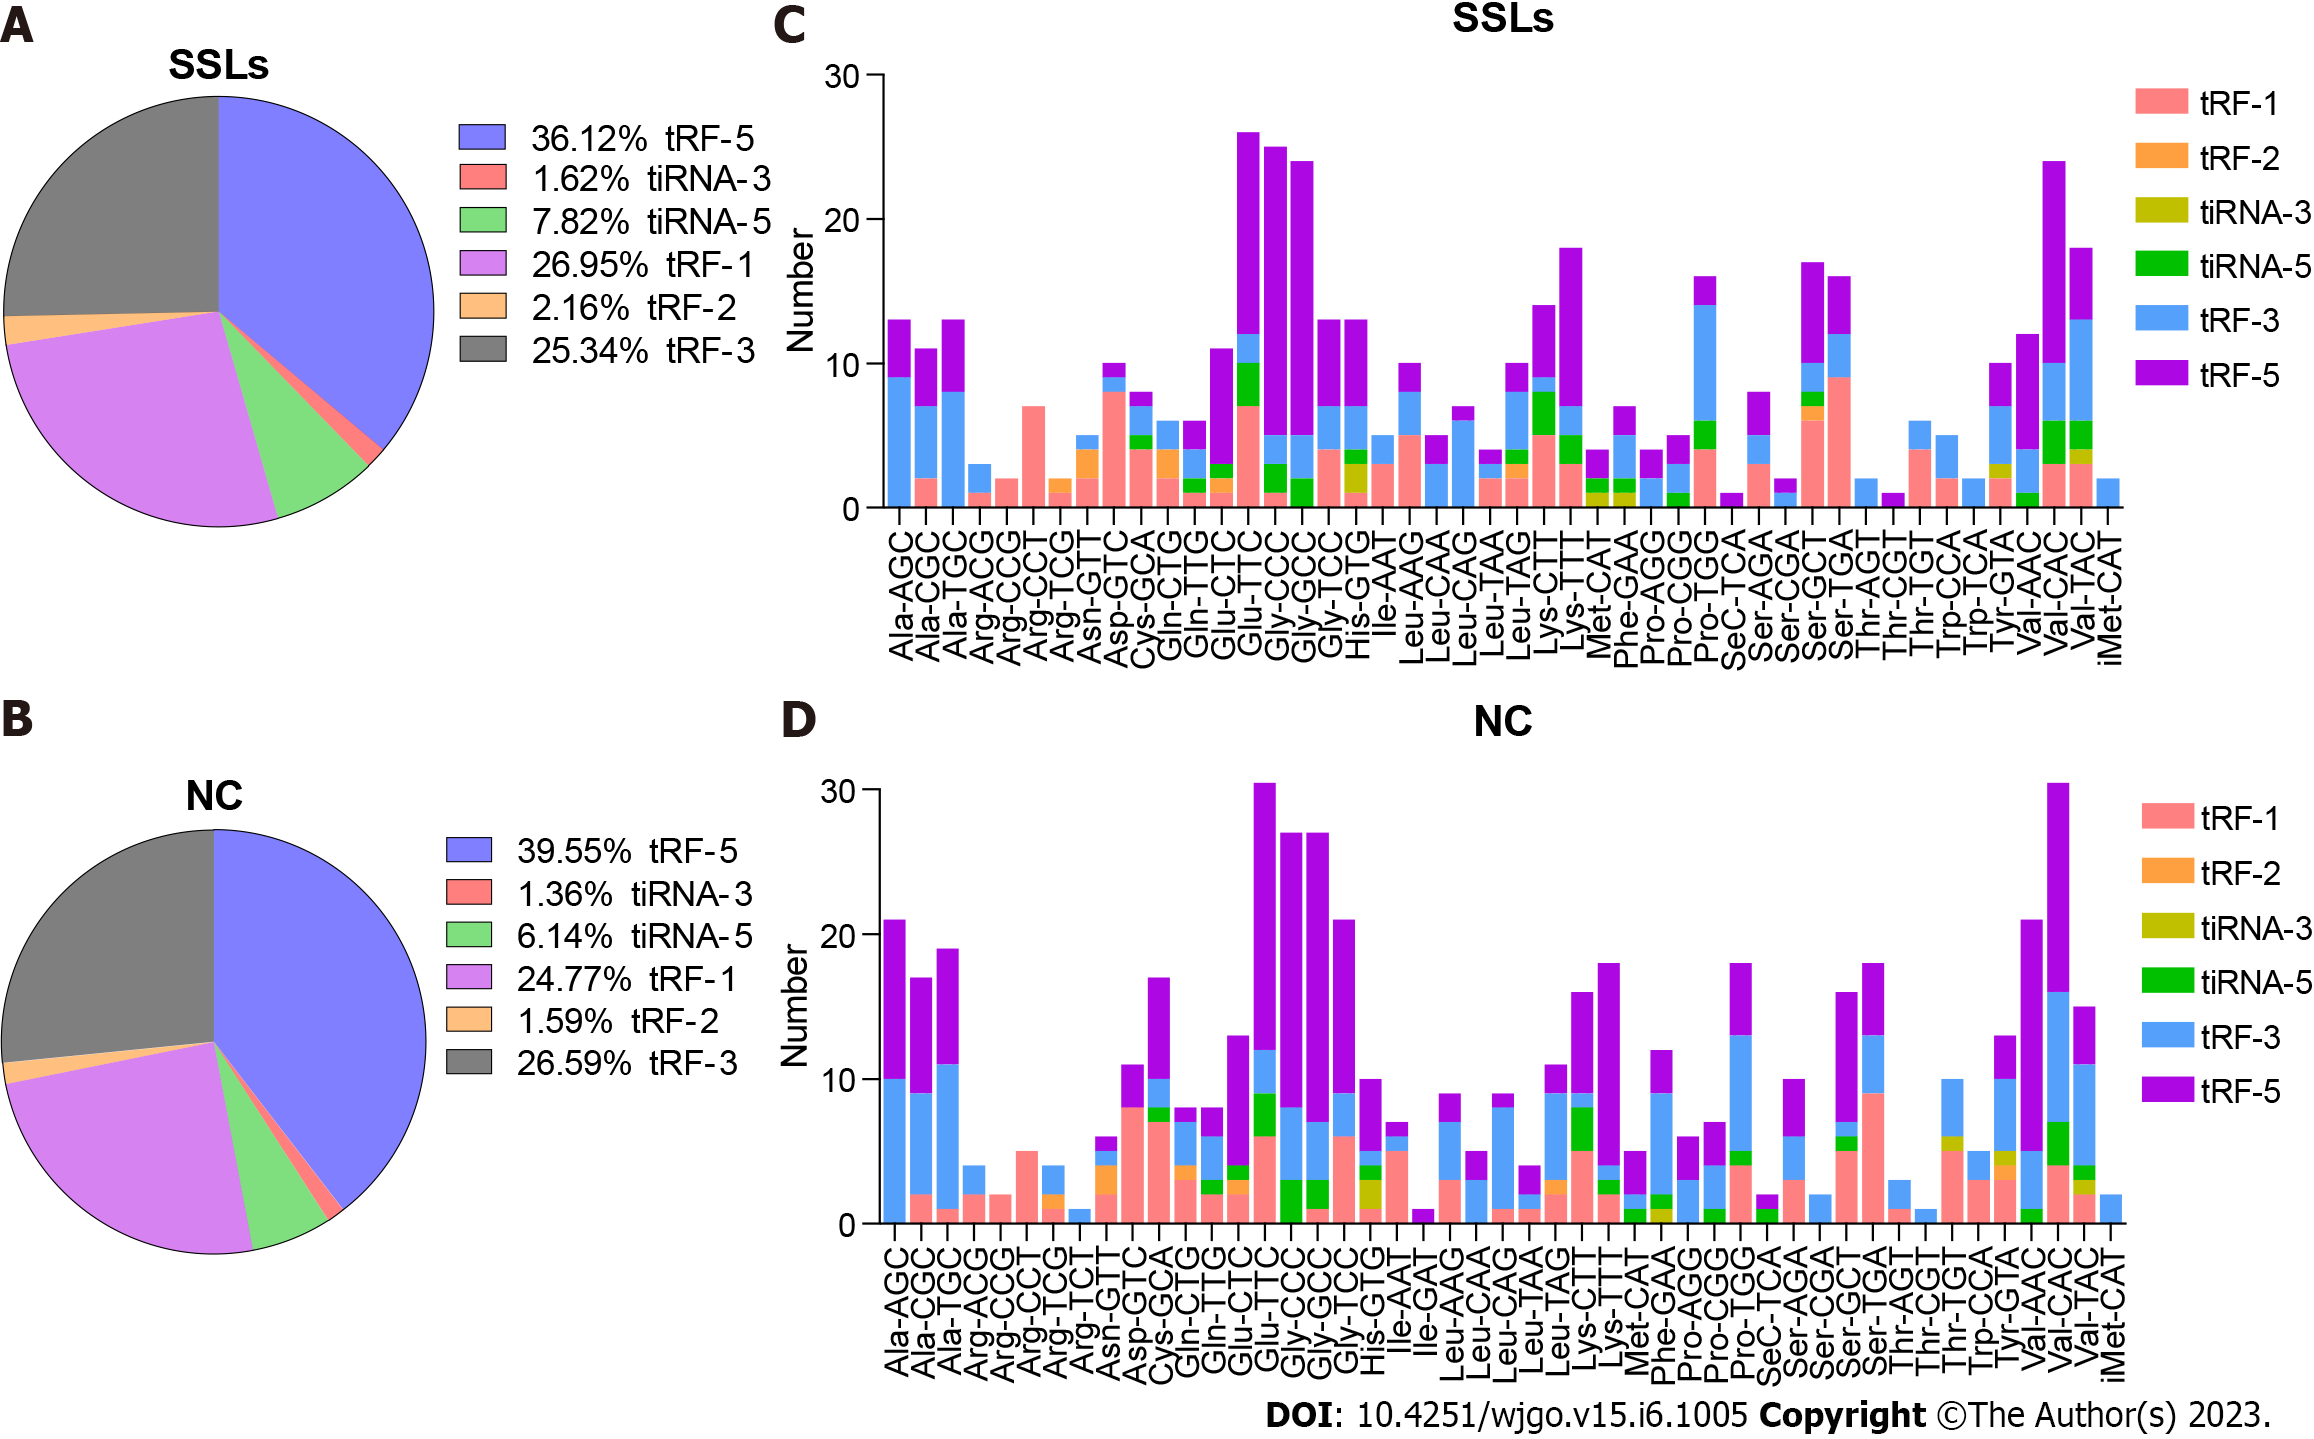
Figure 2 Distribution of transfer RNA-related fragment and transfer RNA halves subtypes in sessile serrated lesions and normal control groups.
A and B: Pie charts for all kinds of subtype of transfer RNA-related fragment (tRFs) and transfer RNA halves (tiRNAs) in the two separated groups. The values in the pie chart are ratios of each subtype of tRFs and tiRNAs in sessile serrated lesions (SSLs) and normal control (NC), respectively. C and D: Stacked plot for all subtypes of tRFs and tiRNAs of each group clustered based on the anticodons of tRNAs. The X-axis represents tRNAs with the same anticodon and the Y-axis shows the number of all subtype tRFs and tiRNAs derived from the same anticodon tRNA. The color bar represents the number of each subtype tRFs and tiRNAs. SSLs: Sessile serrated lesions; NC: Normal control; tRF: Transfer RNA-related fragment; tiRNA: Transfer RNA halves.
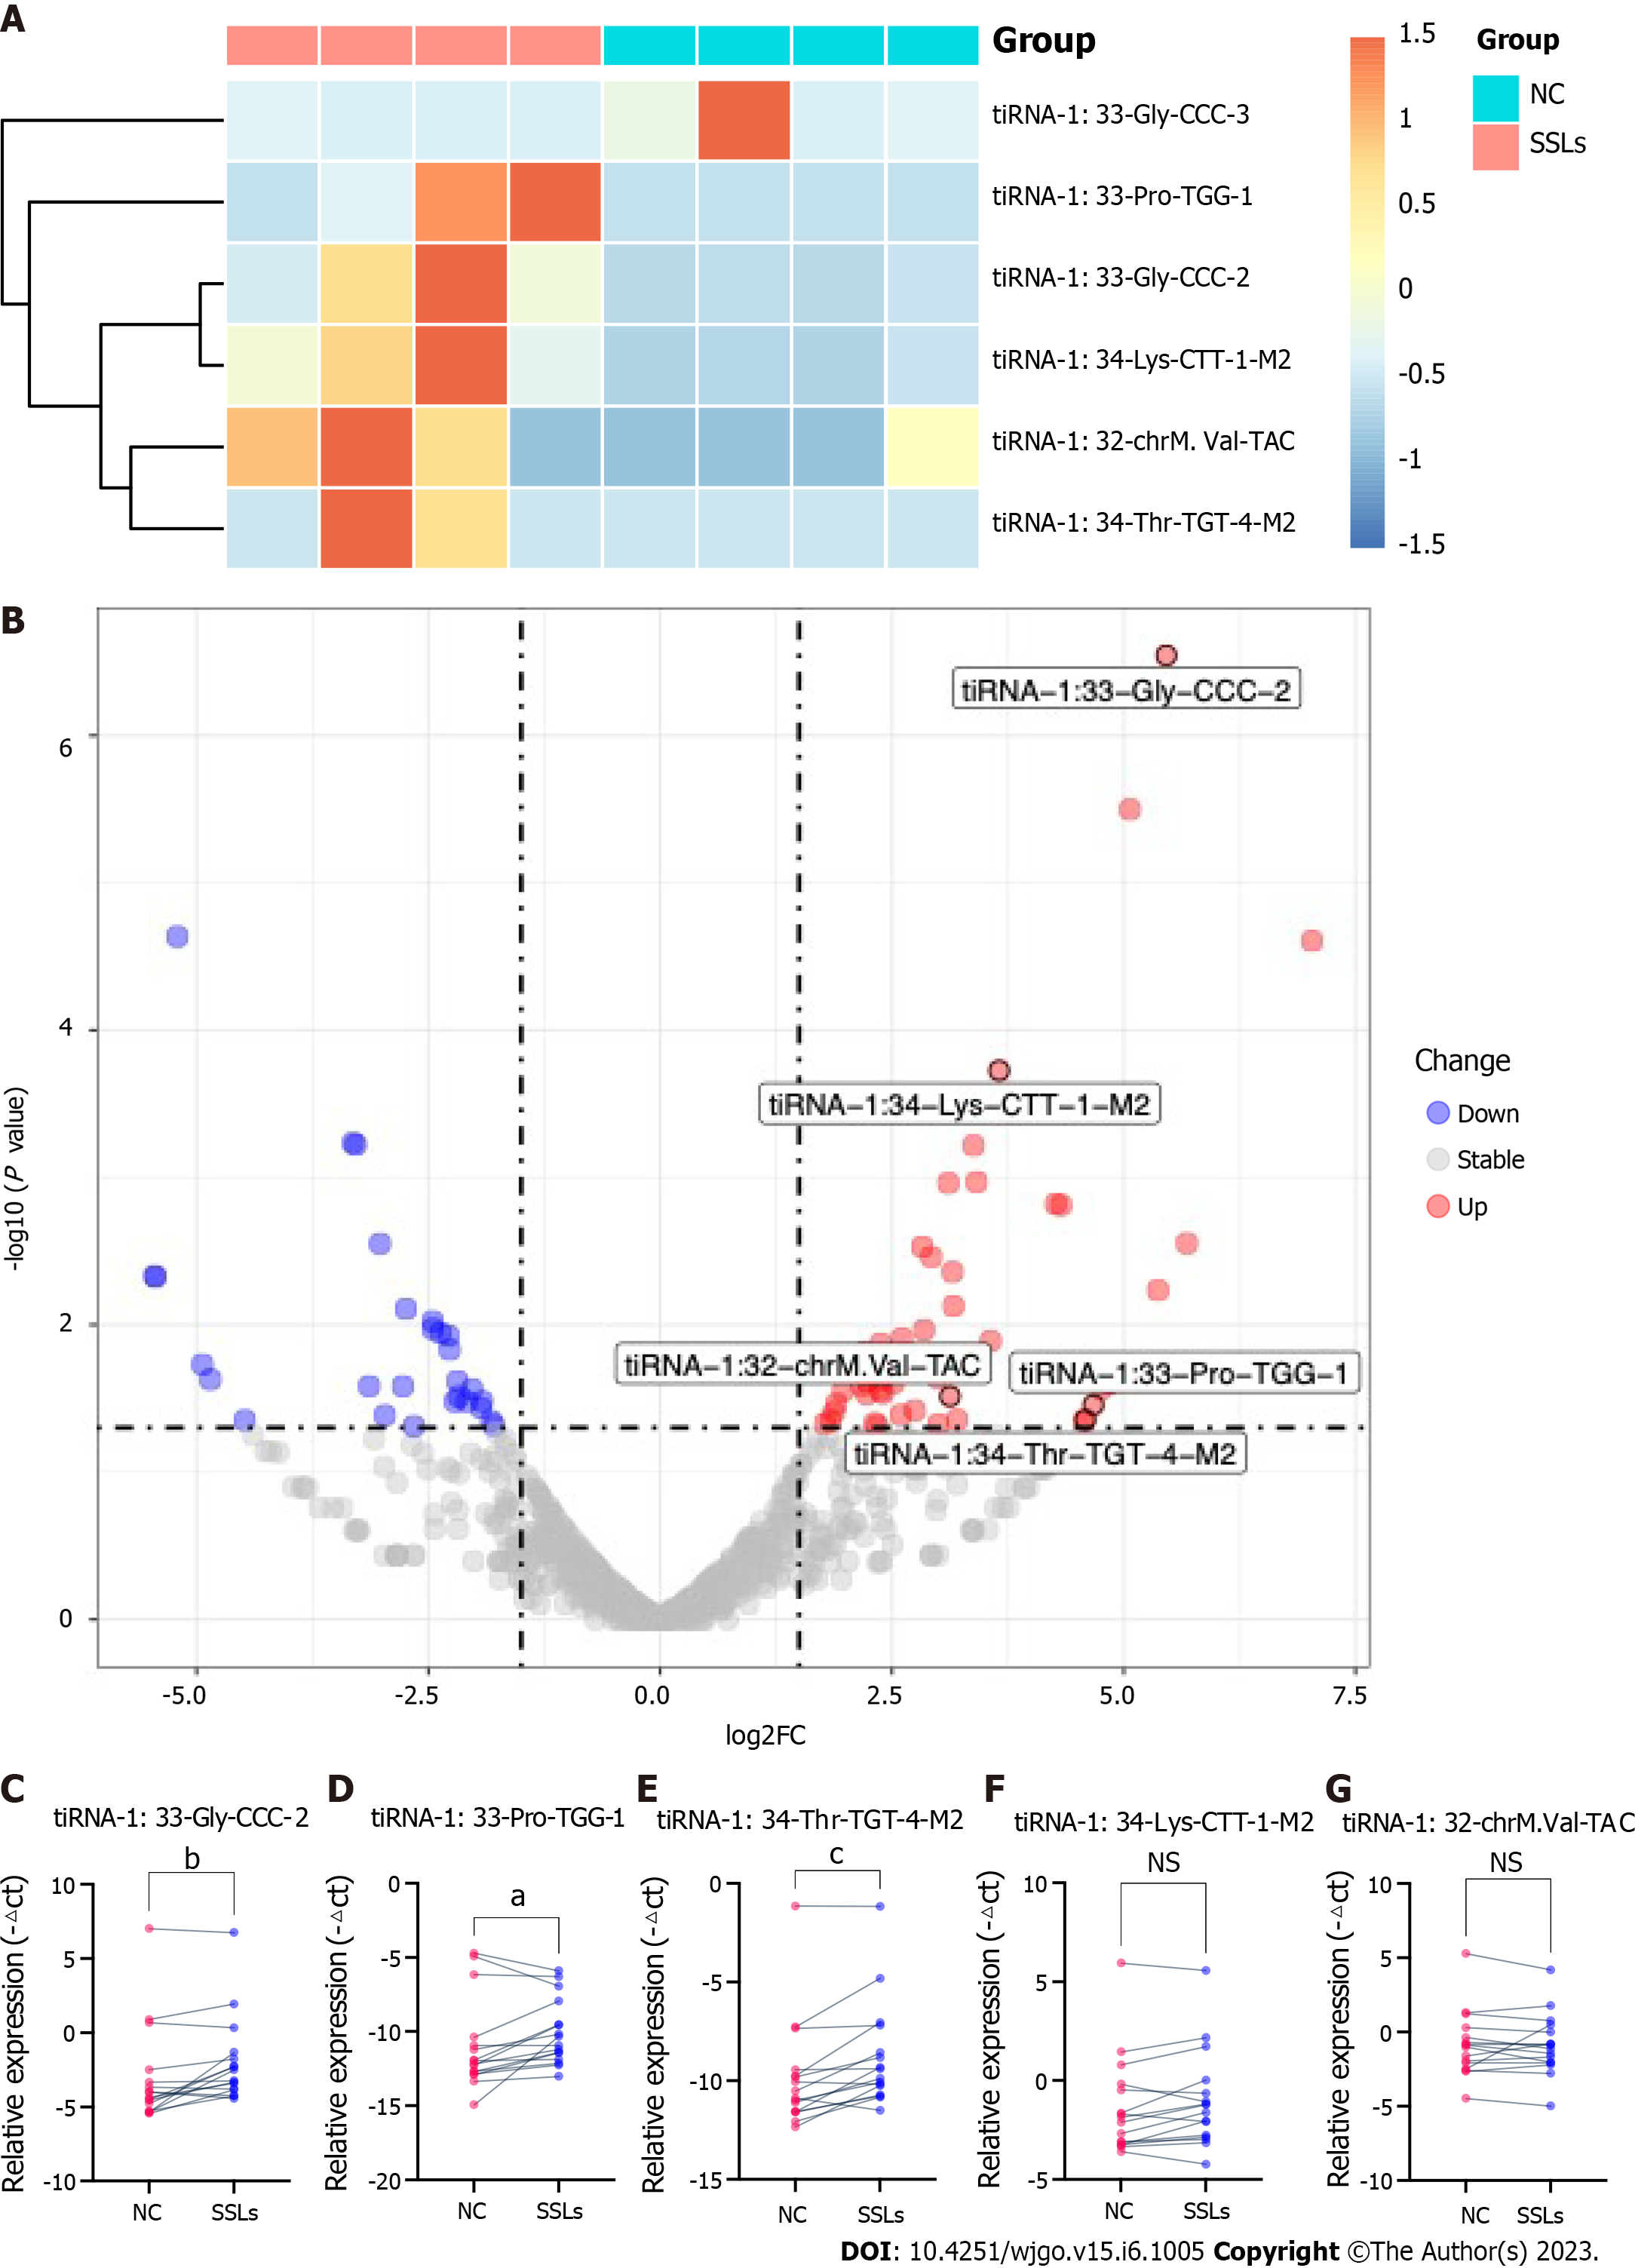
Figure 3 Validation for the discrepant expression levels of 5′transfer RNA halves.
A: Heatmap of the expression levels of six differently expressed 5′transfer RNA halves (tiRNAs) in sessile serrated lesions (SSLs) vs normal control (NC). B: Volcano chart of transfer RNA-related fragments (tRFs) and tiRNAs. Red/blue circles indicate statistically significant differentially expressed tRFs and tiRNAs with the absolute log2 (fold change) of no < 1.5 and a P value ≤ 0.05 (red: Upregulated; blue: Downregulated). Gray circles indicate nondifferentially expressed tRFs and tiRNAs, with fold changes and/or P values not meeting the cutoff thresholds. C-G: qRT-polymerase chain reaction for the validation of five upregulated 5′tiRNAs in 16 paired SSLs and NC tissues. All data were analyzed using paired Student′s t-test. The asterisk indicates a significant difference between the two groups (aP < 0.05, bP < 0.01, cP < 0.001). NS: Not significant; SSLs: Sessile serrated lesions; NC: Normal control; tRF: Transfer RNA-related fragment; tiRNA: Transfer RNA halves.
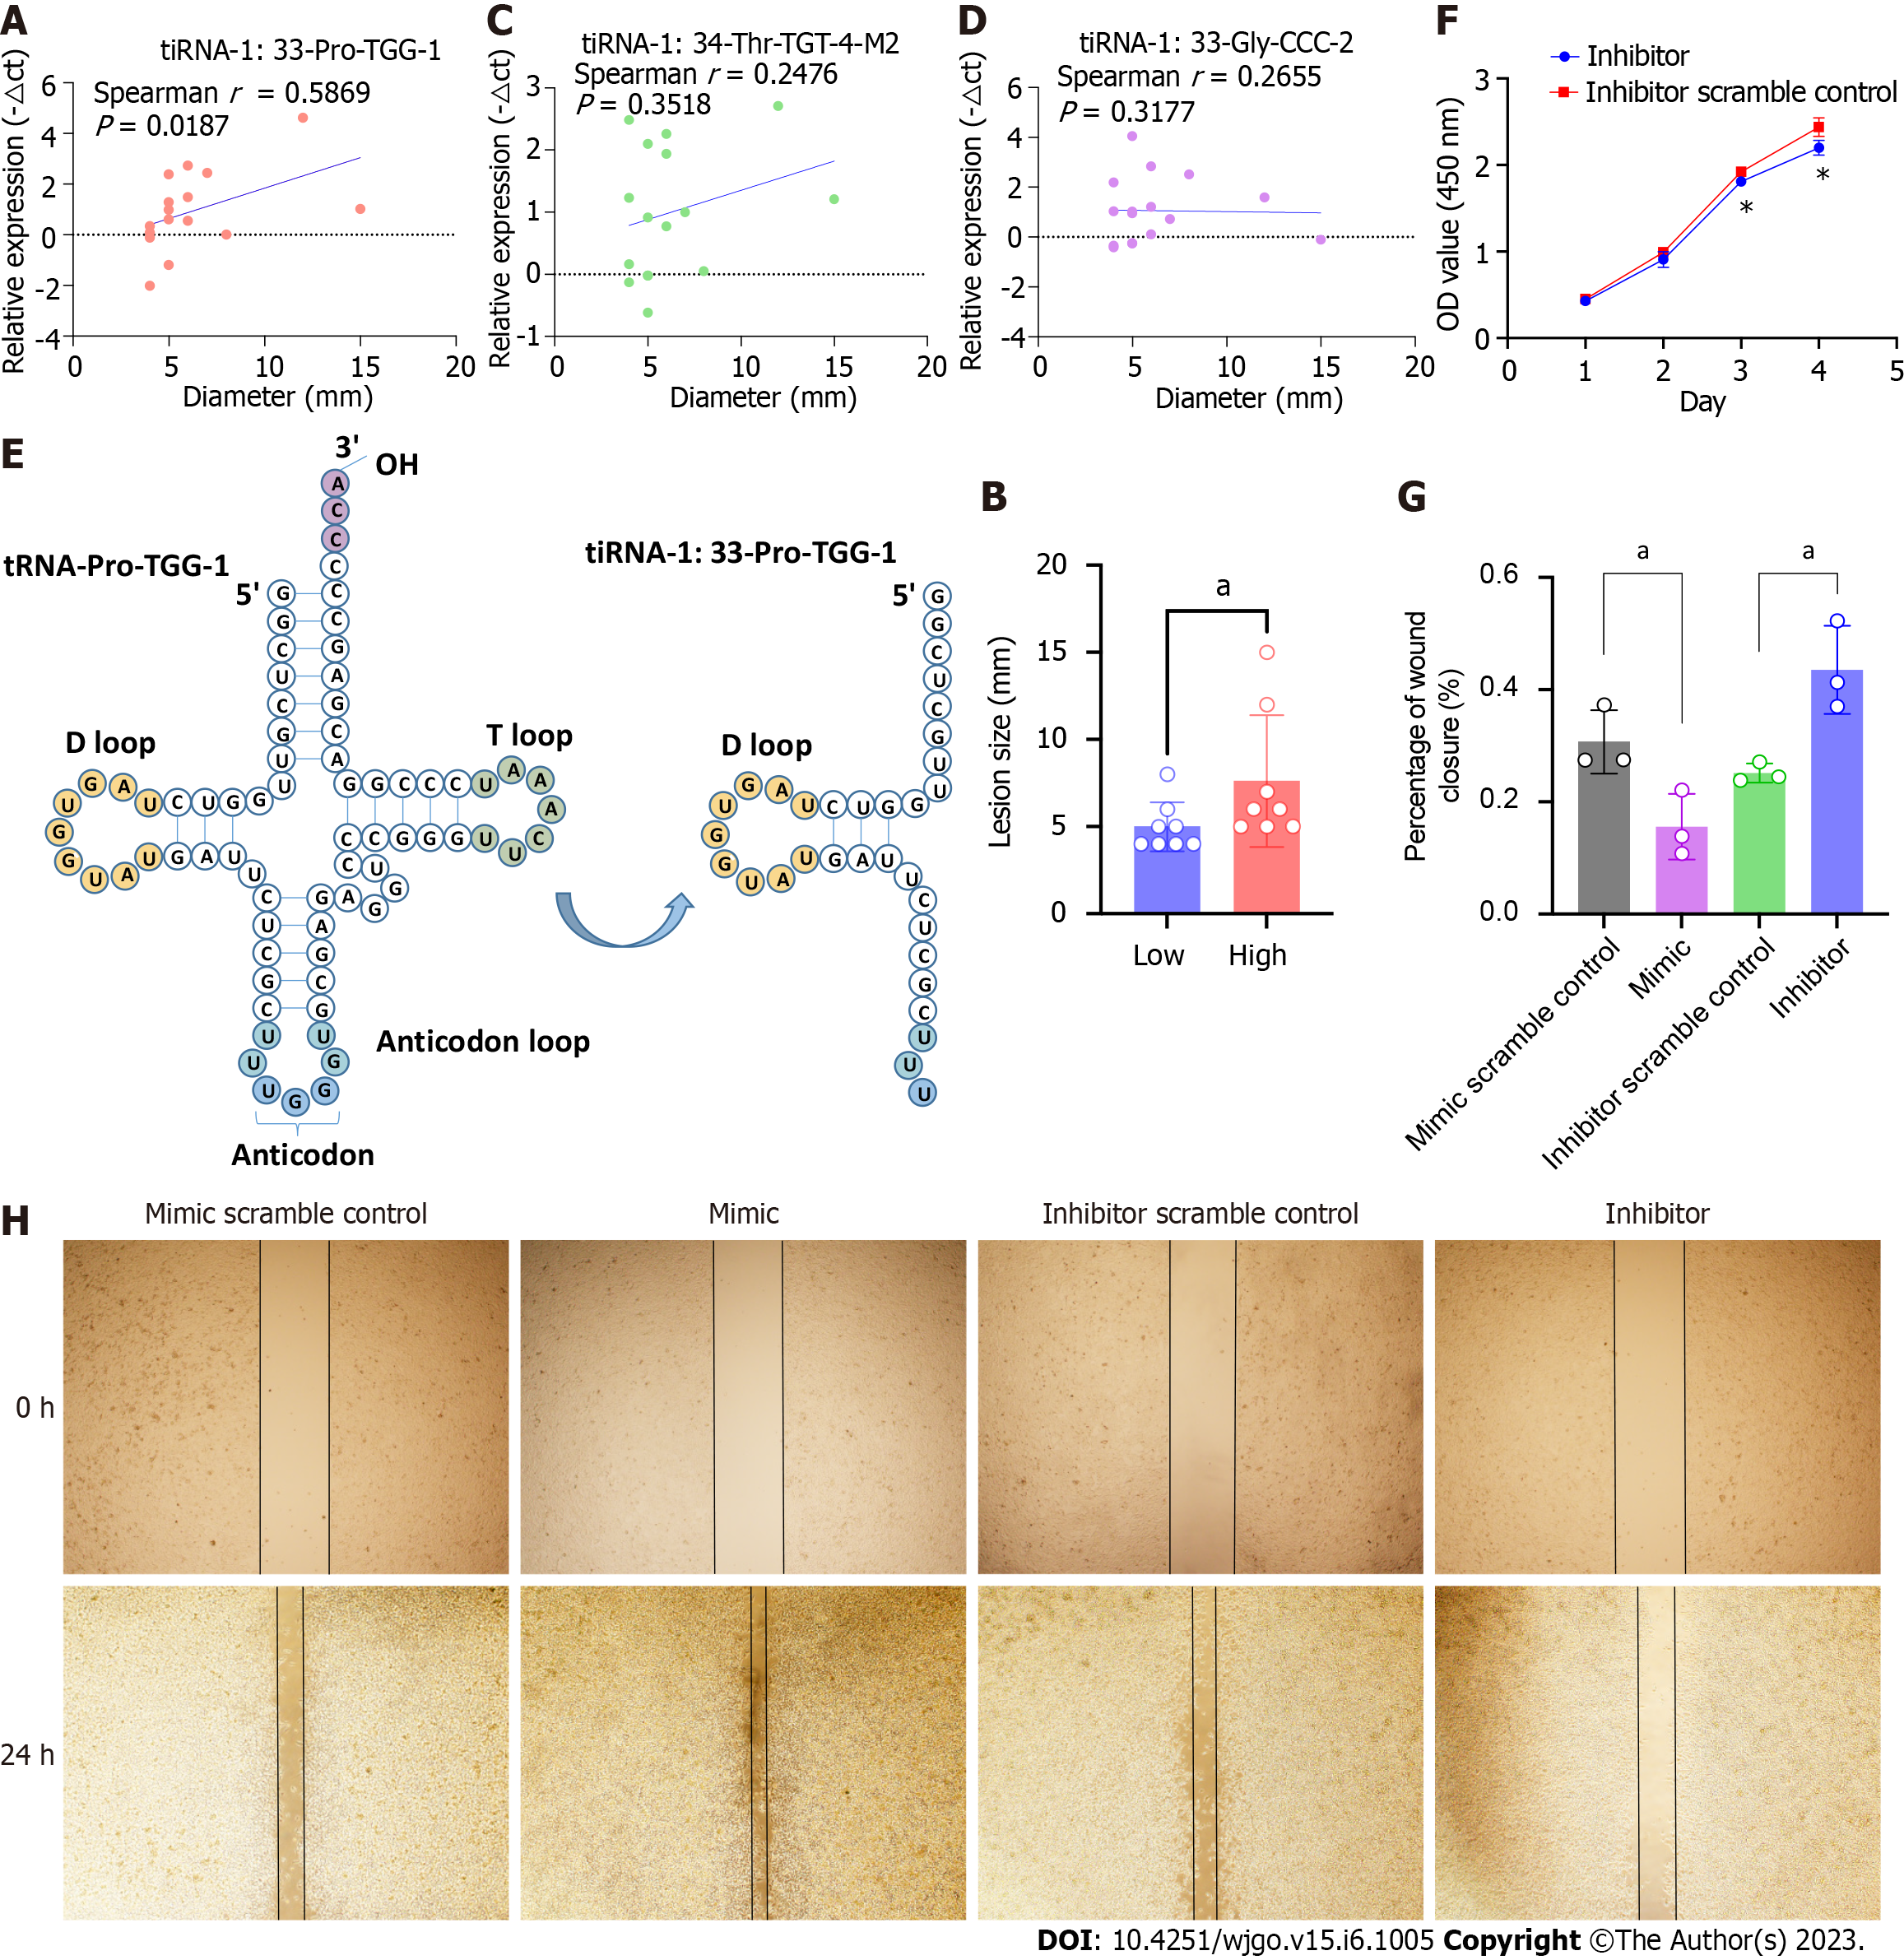
Figure 4 Transfer RNA halves-1:33-Pro-TGG-1 is associated with lesion size and promotes oncogenesis in colorectal cancer cells.
A: Correlation analysis of the lesion sizes and expressions of transfer RNA halves (tiRNA)-1:33-Pro-TGG-1 of SSLs. The X-axis represents the diameter of the lesion and the Y-axis represents the expression level of tiRNA-1:33-Pro-TGG-1. B: Lesions in the tiRNA-1:33-Pro-TGG-1 high-expression group are larger than that of the low-expression group. Lesions are divided into high- and low-expression groups based on the median tiRNA-1:33-Pro-TGG-1 expression levels. The lesion sizes are compared between the two groups. C and D: Correlation analysis of lesion sizes and the expressions of tiRNA-1:34-Thr-TGT-4-M2 and tiRNA-1:33-Gly-CCC-2 of SSLs. E: 5′tiRNA-Pro-TGG is a type of 5′tiRNA that originated in tRNA-Pro-TGG-1. F: 5′tiRNA-Pro-TGG knockdown suppressed the proliferation of RKO cells compared to that of the scramble control as determined by CCK-8 assays. G and H: Wound-healing assays demonstrated that the overexpression of 5′tiRNA-Pro-TGG promotes cell migration and knockdown of 5′tiRNA-Pro-TGG inhibits cell migration when compared to those of the corresponding scramble control, respectively. The asterisk indicates a significant difference between the two groups (aP < 0.05). SSLs: Sessile serrated lesions; tiRNA: Transfer RNA halves.
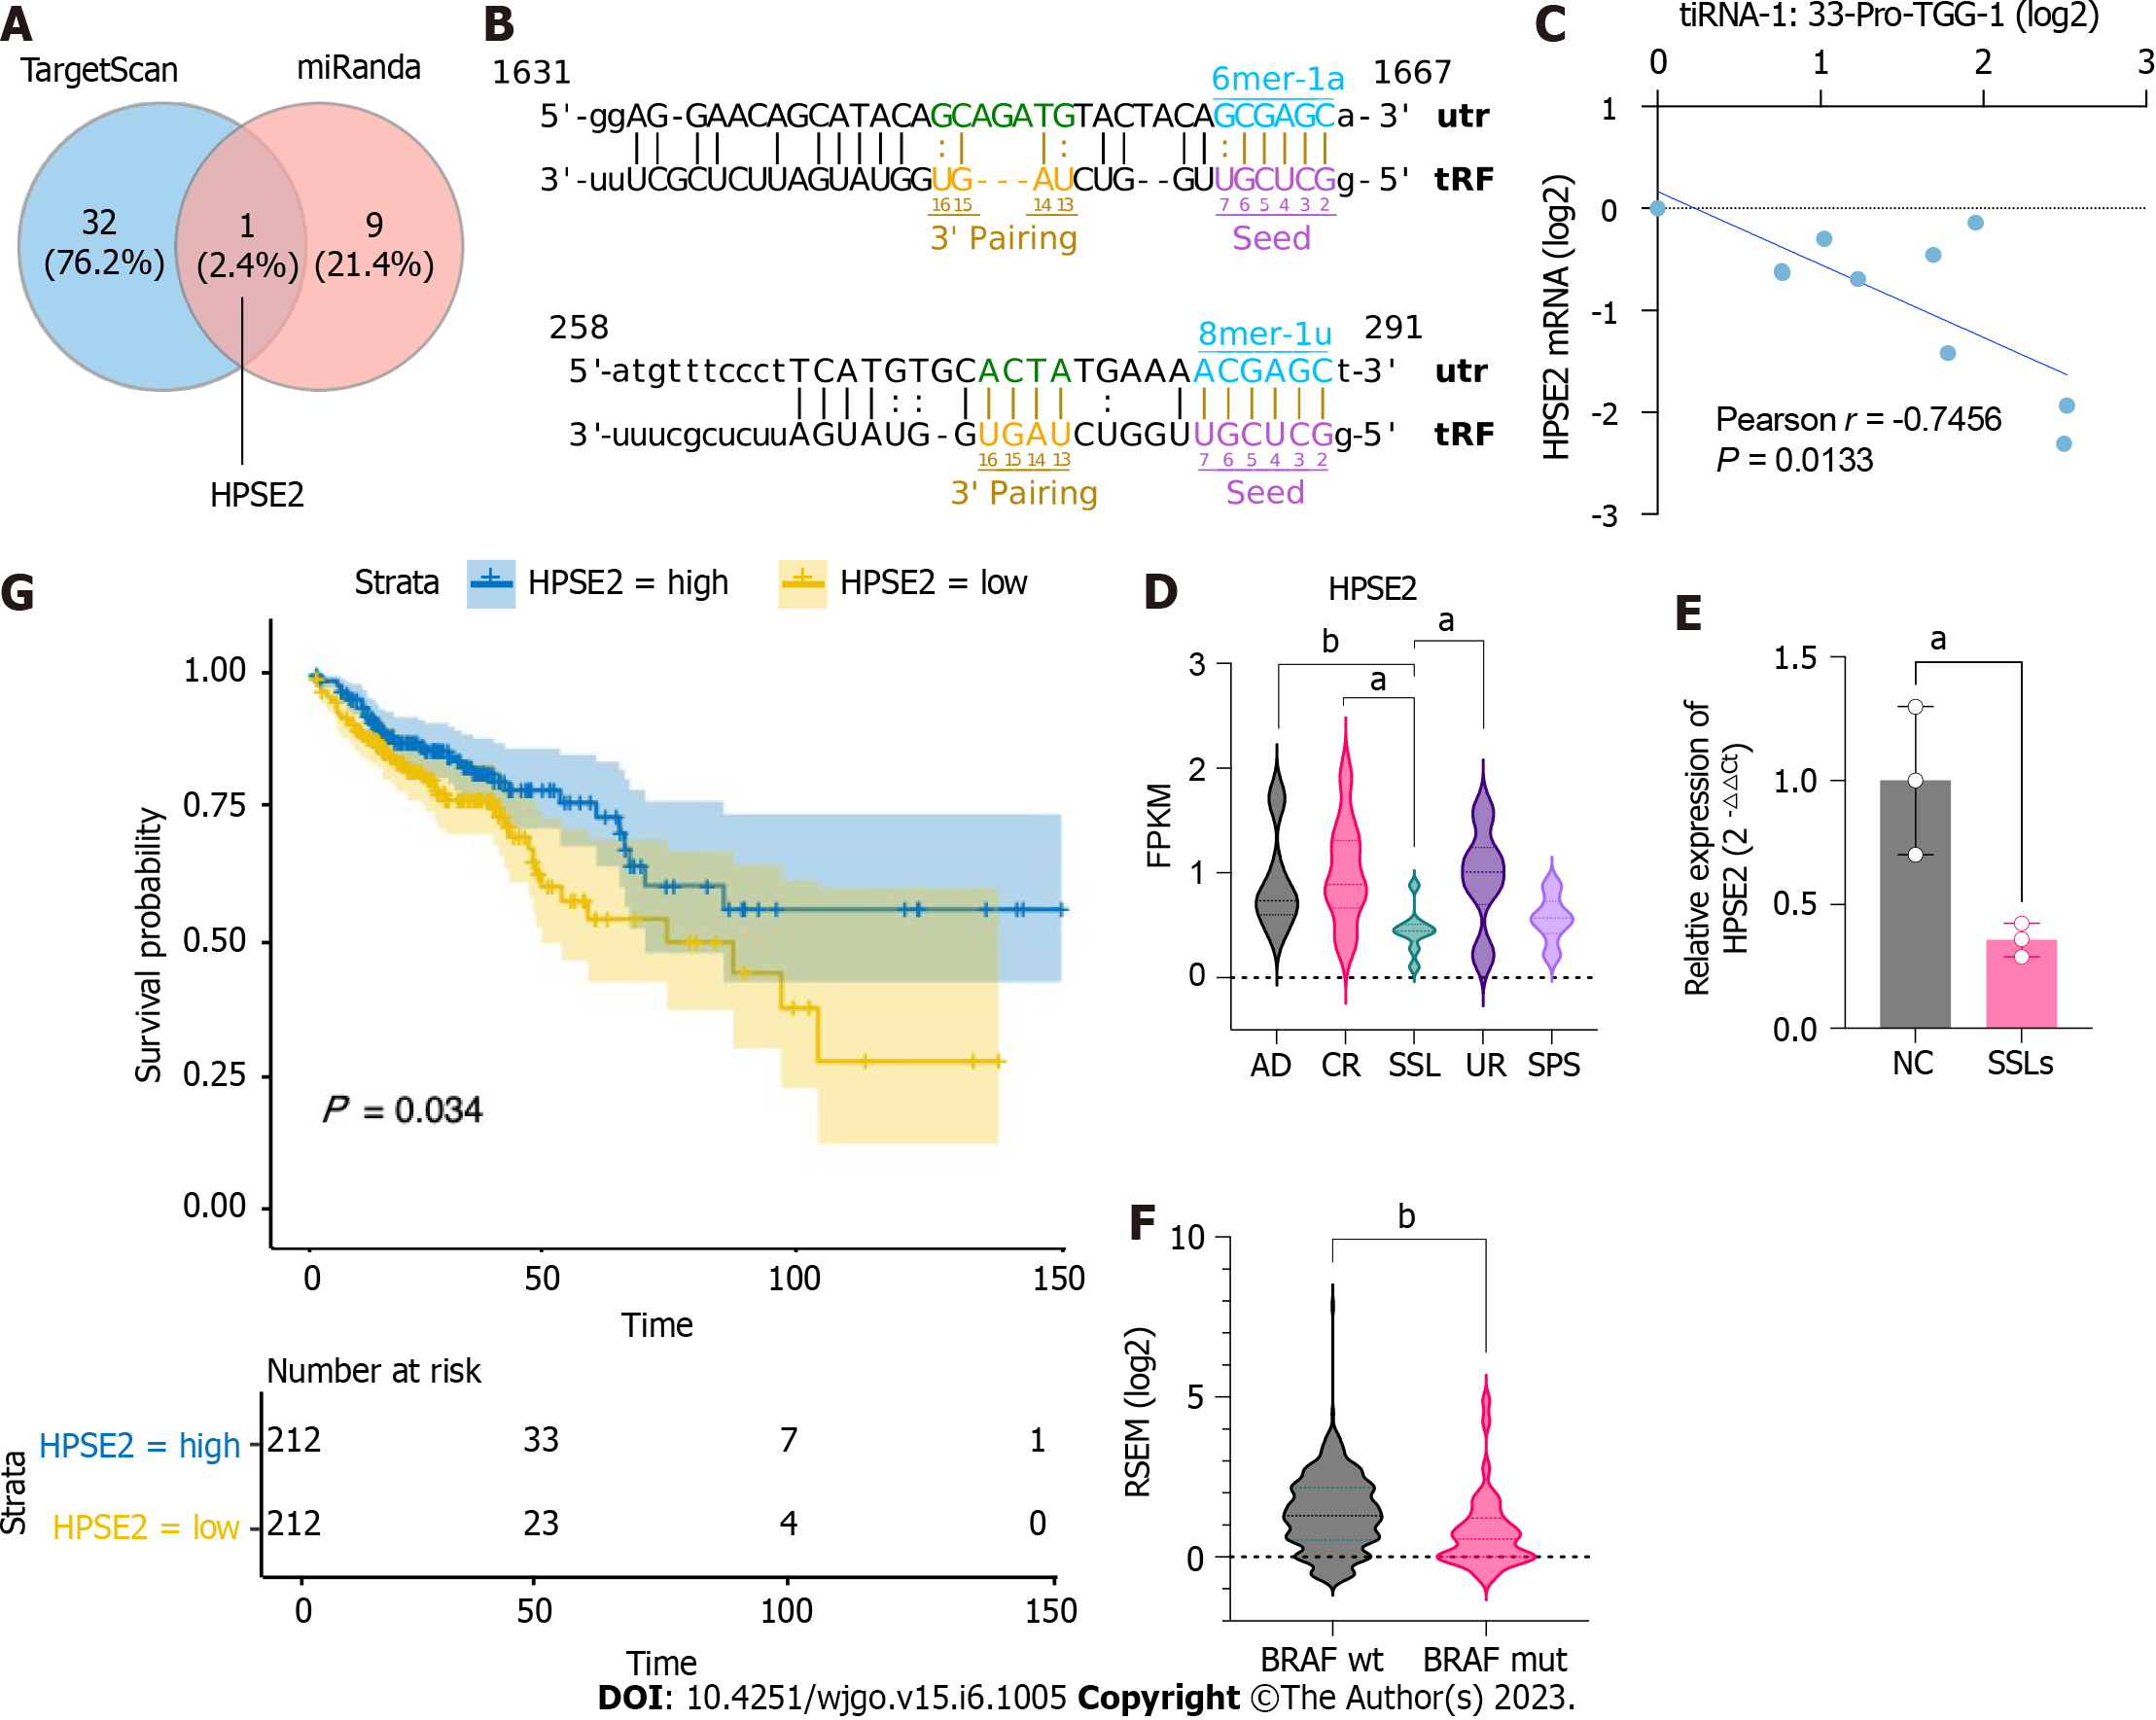
Figure 5 Potential target gene HPSE2 is involved in the serrated pathway.
A: Schematic Venn diagram of transfer RNA halves (5′tiRNA)-Pro-TGG target gene prediction. B: Predicted interaction position between 5′tiRNA-Pro-TGG and 3′UTR of HPSE2. C: Correlation analysis of the expression of 5′tiRNA-Pro-TGG and HPSE2 (n = 10). D: Expression level of HPSE2 in common adenoma, right control colon tissue, sessile serrated lesion (SSL), right uninvolved colon, and serrated polyp syndrome in GSE76987. E: Expression level of HPSE2 in SSLs and normal control (n = 3). F: HPSE2 expression in BRAF-mut colorectal cancer (CRC) was lower in BRAF-wild CRC. G: Kaplan–Meier survival curves for the overall survival (OS) of CRC patients in HPSE2-high and HPSE2-low groups. The OS of patients with HPSE2-low was worse compared to that of patients with HPSE2-high. aP < 0.05, bP < 0.01. AD: Common adenoma; CR: Right control colon tissue; SSL: Sessile serrated lesion; UR: Right uninvolved colon; SPS: Serrated polyp syndrome; OS: Overall survival; CRC: Colorectal cancer; NC: Normal control; tRF: Transfer RNA-related fragment; tiRNA: Transfer RNA halves.
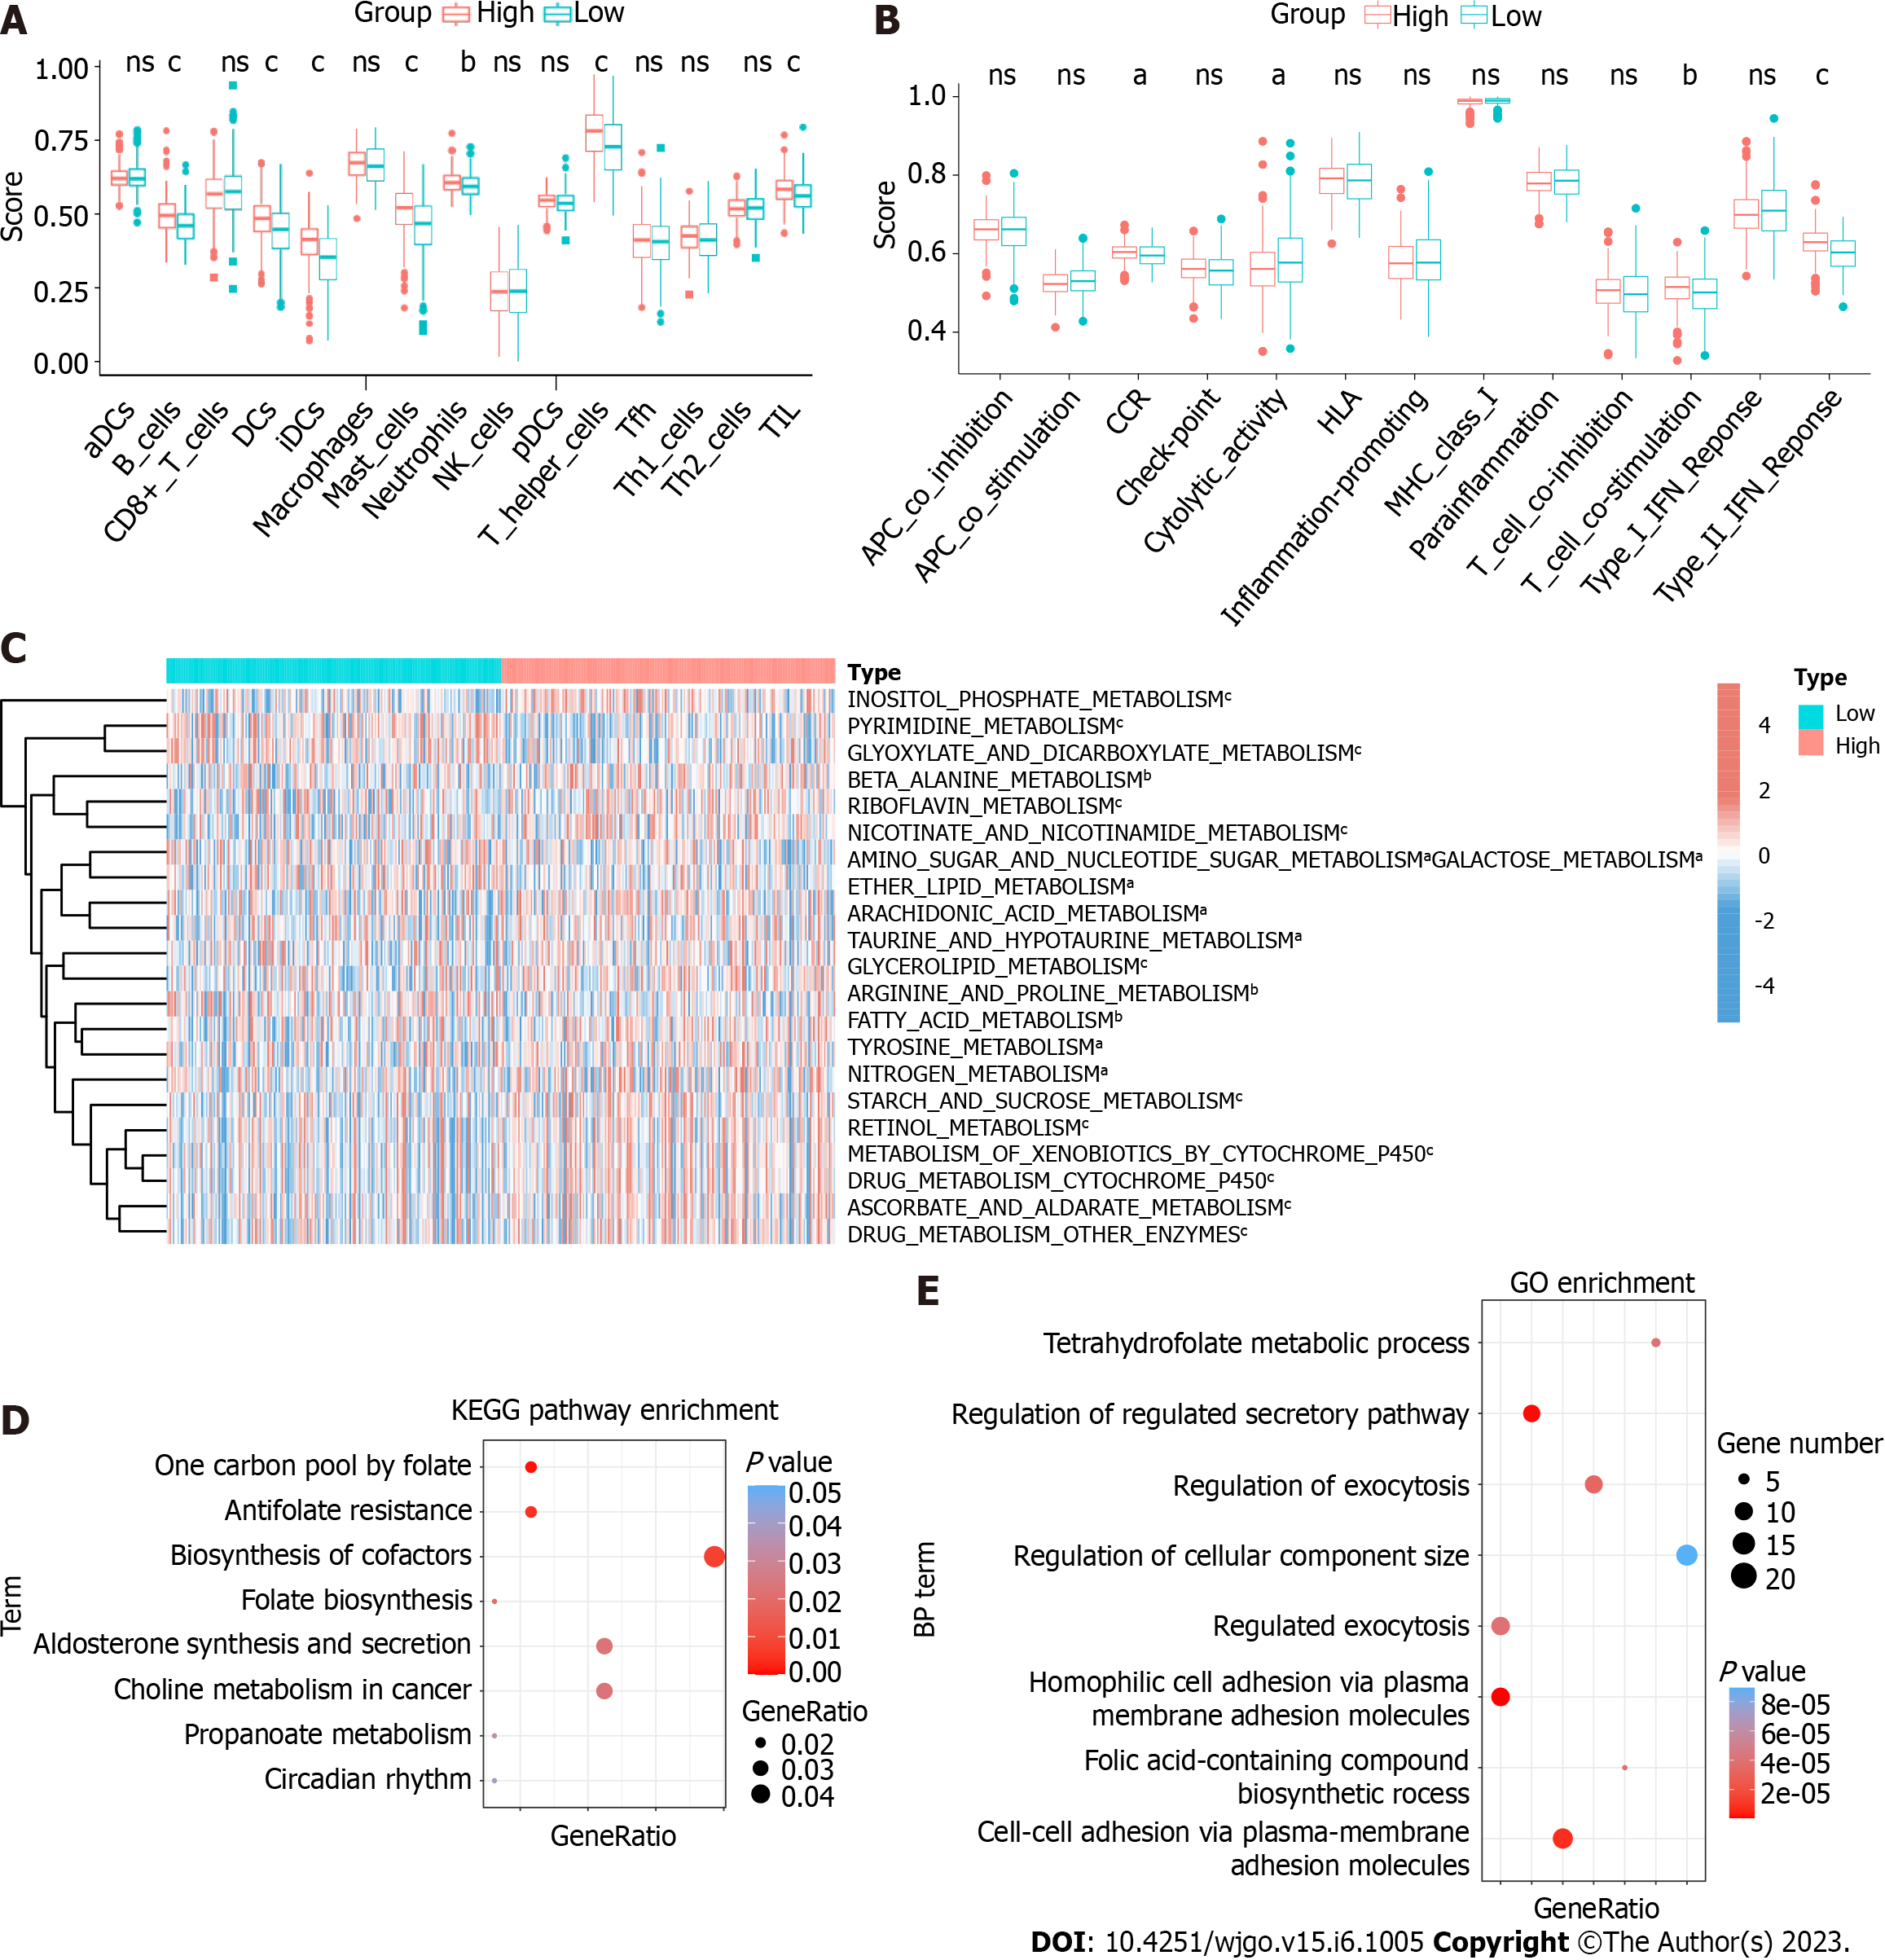
Figure 6 HPSE2-associated immune and metabolic profiles in colorectal cancer.
A and B: Scores of immune cells and immune functions by ssGSEA in the colorectal cancer (CRC) patients of HPSE2-low and HPSE2-high groups. C: Unsupervised clustering of metabolic pathways in CRC patients of HPSE2-low and HPSE2-high groups by ssGSEA. D: Kyoto Encyclopedia of Genes and Genome pathway analysis and gene ontology enrichment analysis; E: For 5′transfer RNA halves-Pro-TGG predicted genes. The vertical axis shows the annotated functions of the predicted genes. The horizontal axis shows the ratio of different genes in the specific pathway/progress and P value (showed by colors) of each cluster, respectively. aP < 0.05, bP < 0.01, cP < 0.001. ns: Not significant; CRC: Colorectal cancer; KEGG: Kyoto Encyclopedia of Genes and Genome; BP: Biological process; GO: Gene ontology; HLA: Human leukocyte antigen; IFN: Interferon.
- Citation: Wang XY, Zhou YJ, Chen HY, Chen JN, Chen SS, Chen HM, Li XB. 5’tiRNA-Pro-TGG, a novel tRNA halve, promotes oncogenesis in sessile serrated lesions and serrated pathway of colorectal cancer. World J Gastrointest Oncol 2023; 15(6): 1005-1018
- URL: https://www.wjgnet.com/1948-5204/full/v15/i6/1005.htm
- DOI: https://dx.doi.org/10.4251/wjgo.v15.i6.1005


