Copyright
©The Author(s) 2023.
World J Gastrointest Oncol. Dec 15, 2023; 15(12): 2225-2236
Published online Dec 15, 2023. doi: 10.4251/wjgo.v15.i12.2225
Published online Dec 15, 2023. doi: 10.4251/wjgo.v15.i12.2225
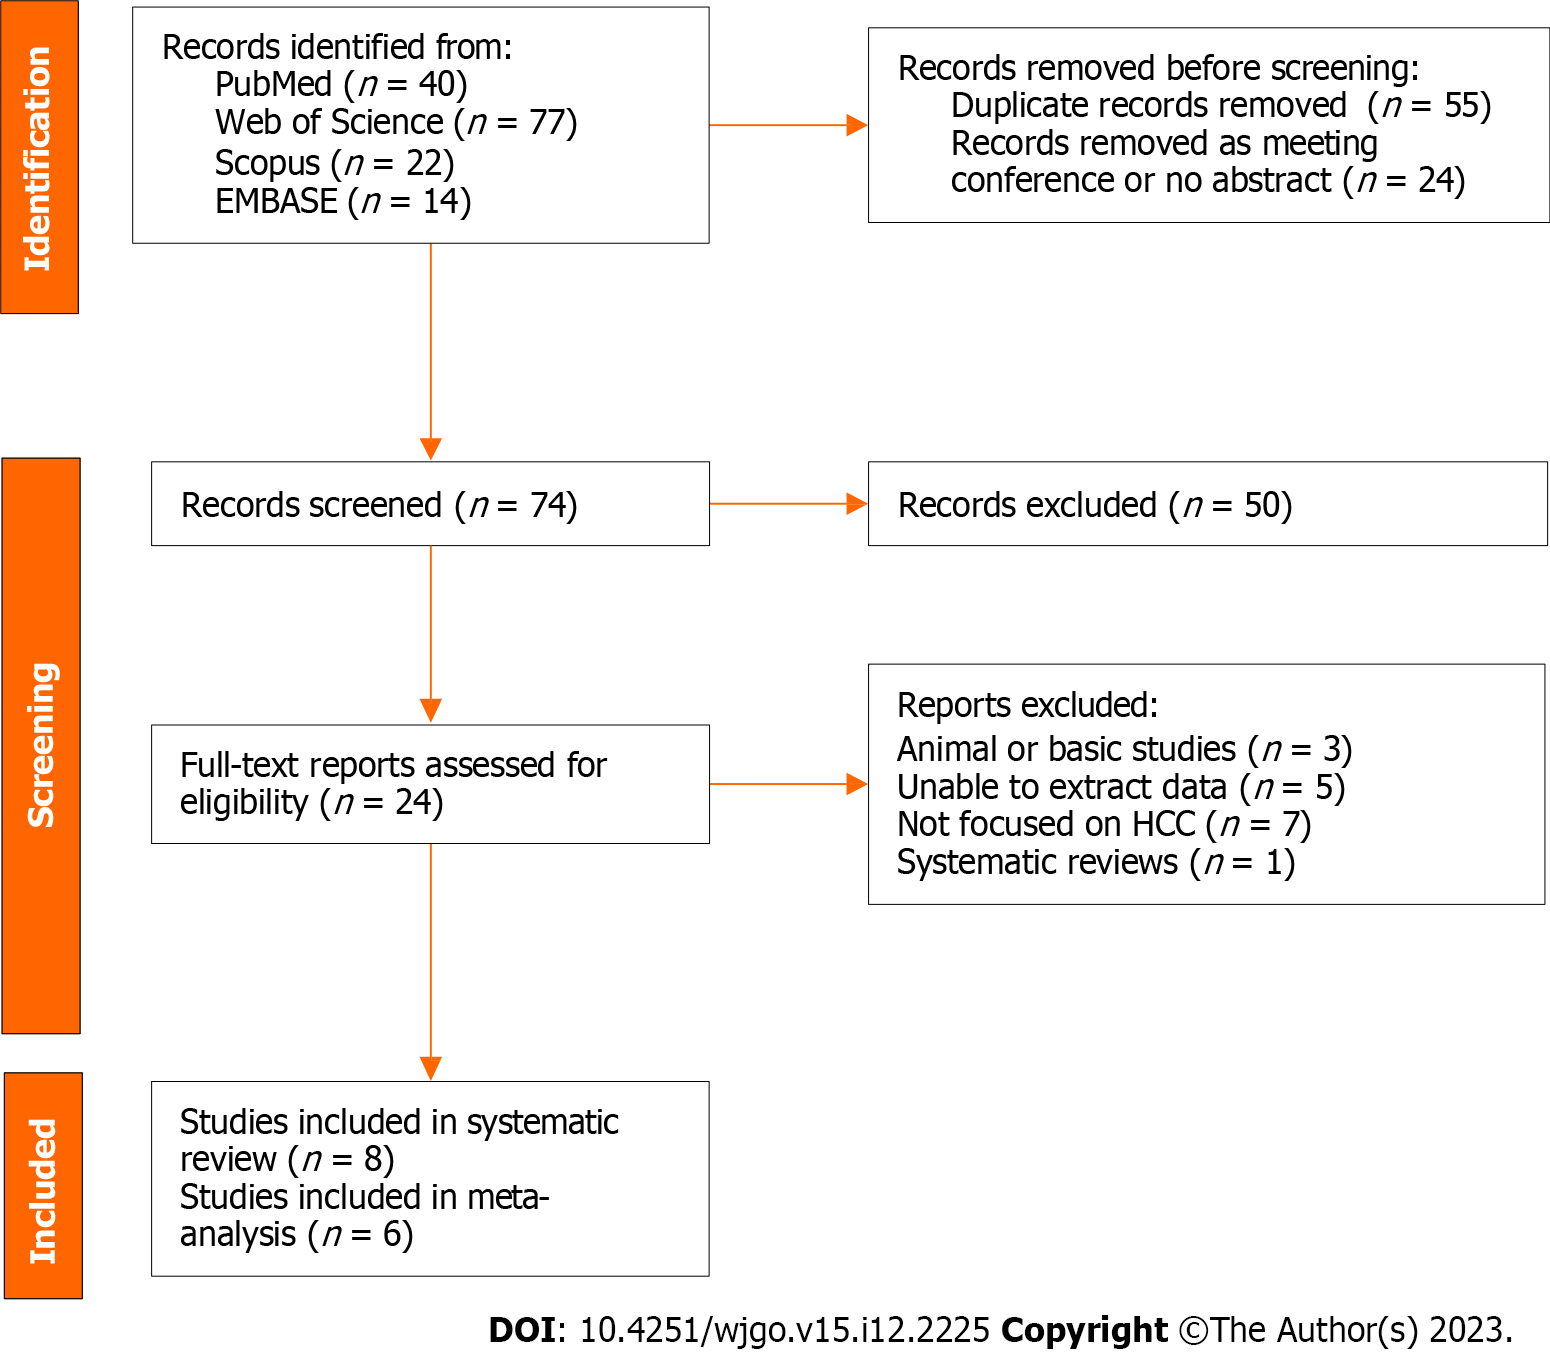
Figure 1 Flow diagram for literature search and study selection.
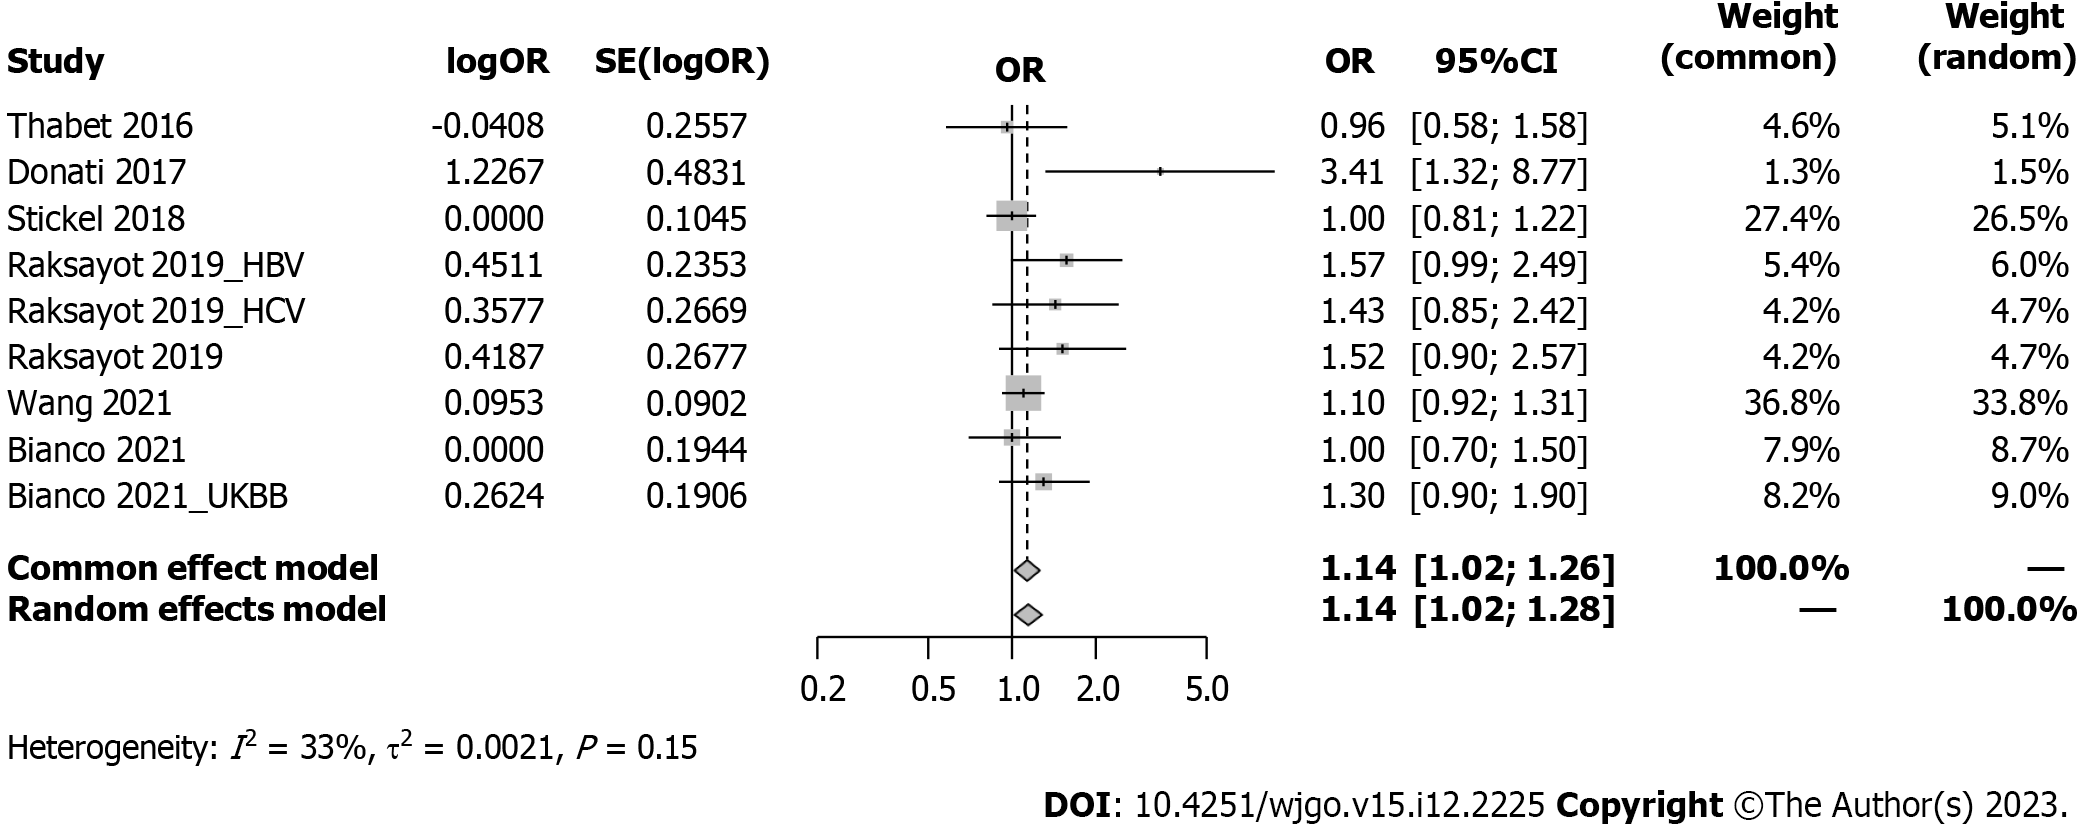
Figure 2 Forest plot of association between MBOAT7 rs641738 and hepatocellular carcinoma risk under the dominant model.
OR: Odds ratio; 95%CI: 95% confidence interval; HBV: Hepatitis B virus; HCV: Hepatitis C virus; UKBB: United Kingdom Biobank.
Figure 3 Forest plot of influence analysis under the dominant model.
OR: Odds ratio; 95%CI: 95% confidence interval; HBV: Hepatitis B virus; HCV: Hepatitis C virus; UKBB: United Kingdom Biobank.
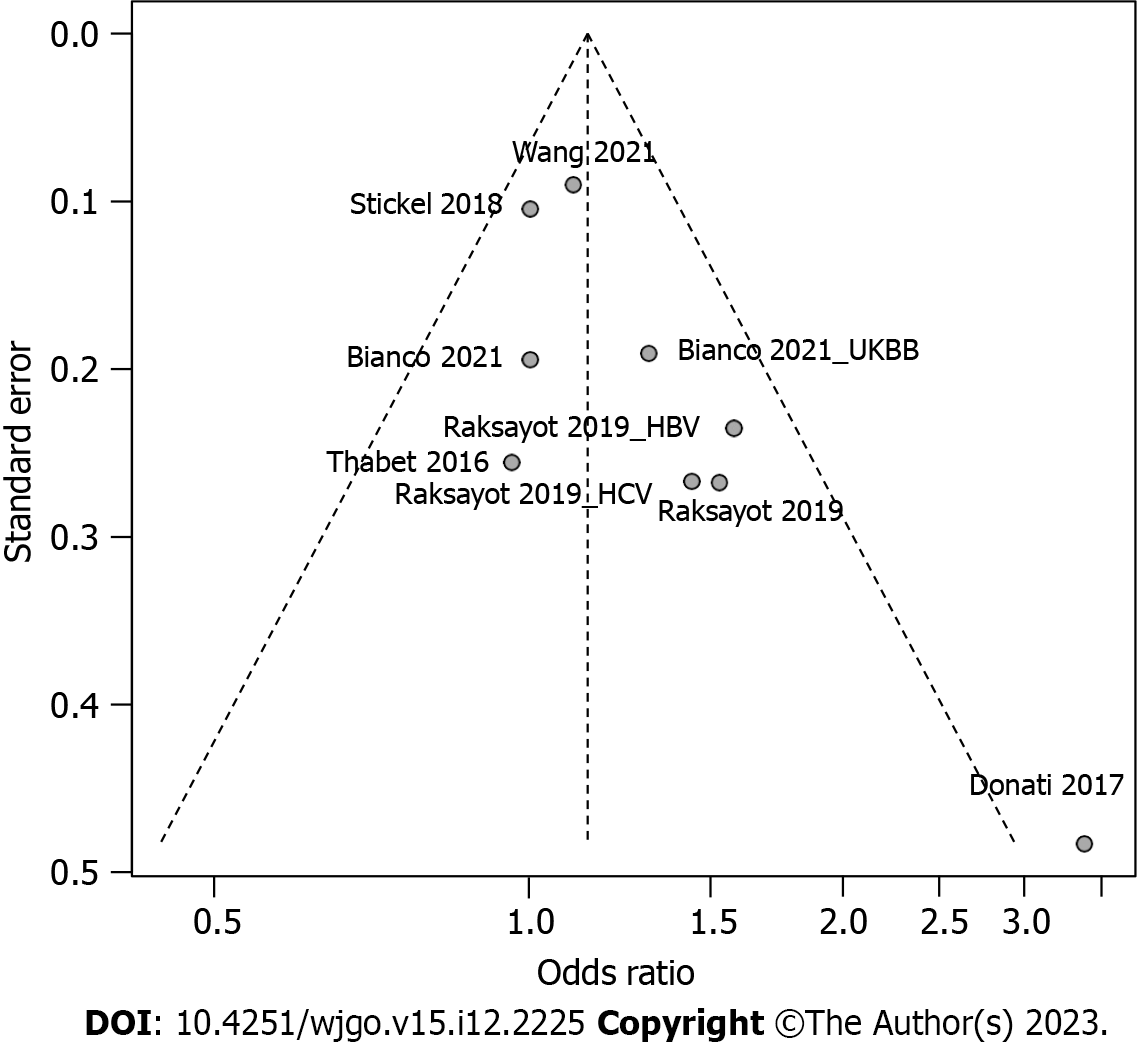
Figure 4 Funnel plot of included studies in meta-analysis under the dominant model.
HBV: Hepatitis B virus; HCV: Hepatitis C virus; UKBB: United Kingdom Biobank.
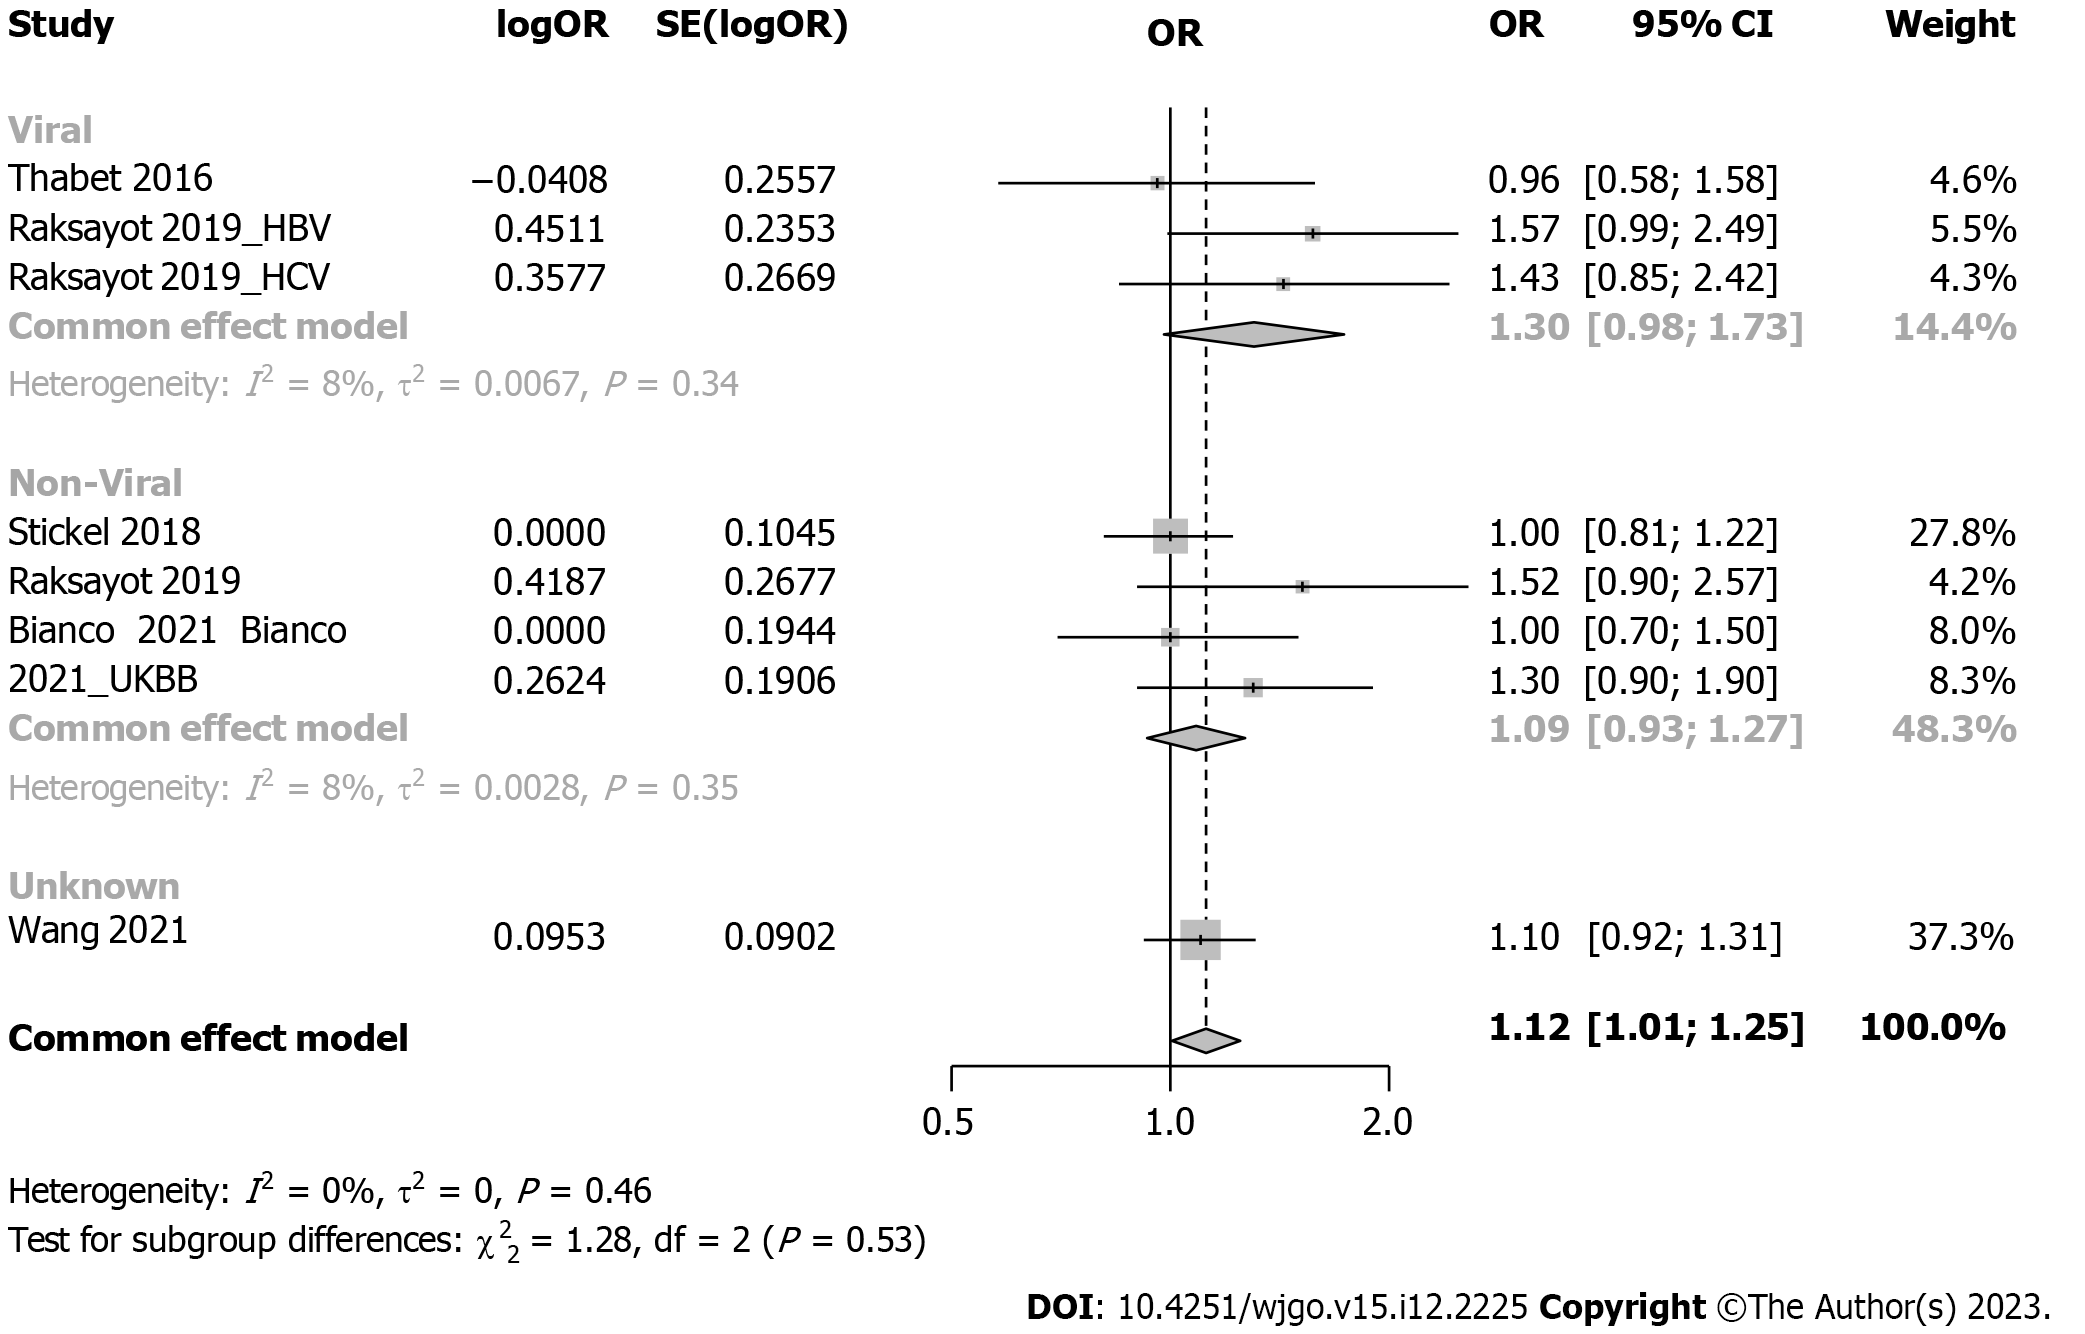
Figure 5 Forest plot of subgroup analysis under the dominant model (stratification by viral or non-viral related hepatocellular carcinoma).
OR: Odds ratio; 95%CI: 95% confidence interval; HBV: Hepatitis B virus; HCV: Hepatitis C virus; UKBB: United Kingdom Biobank.
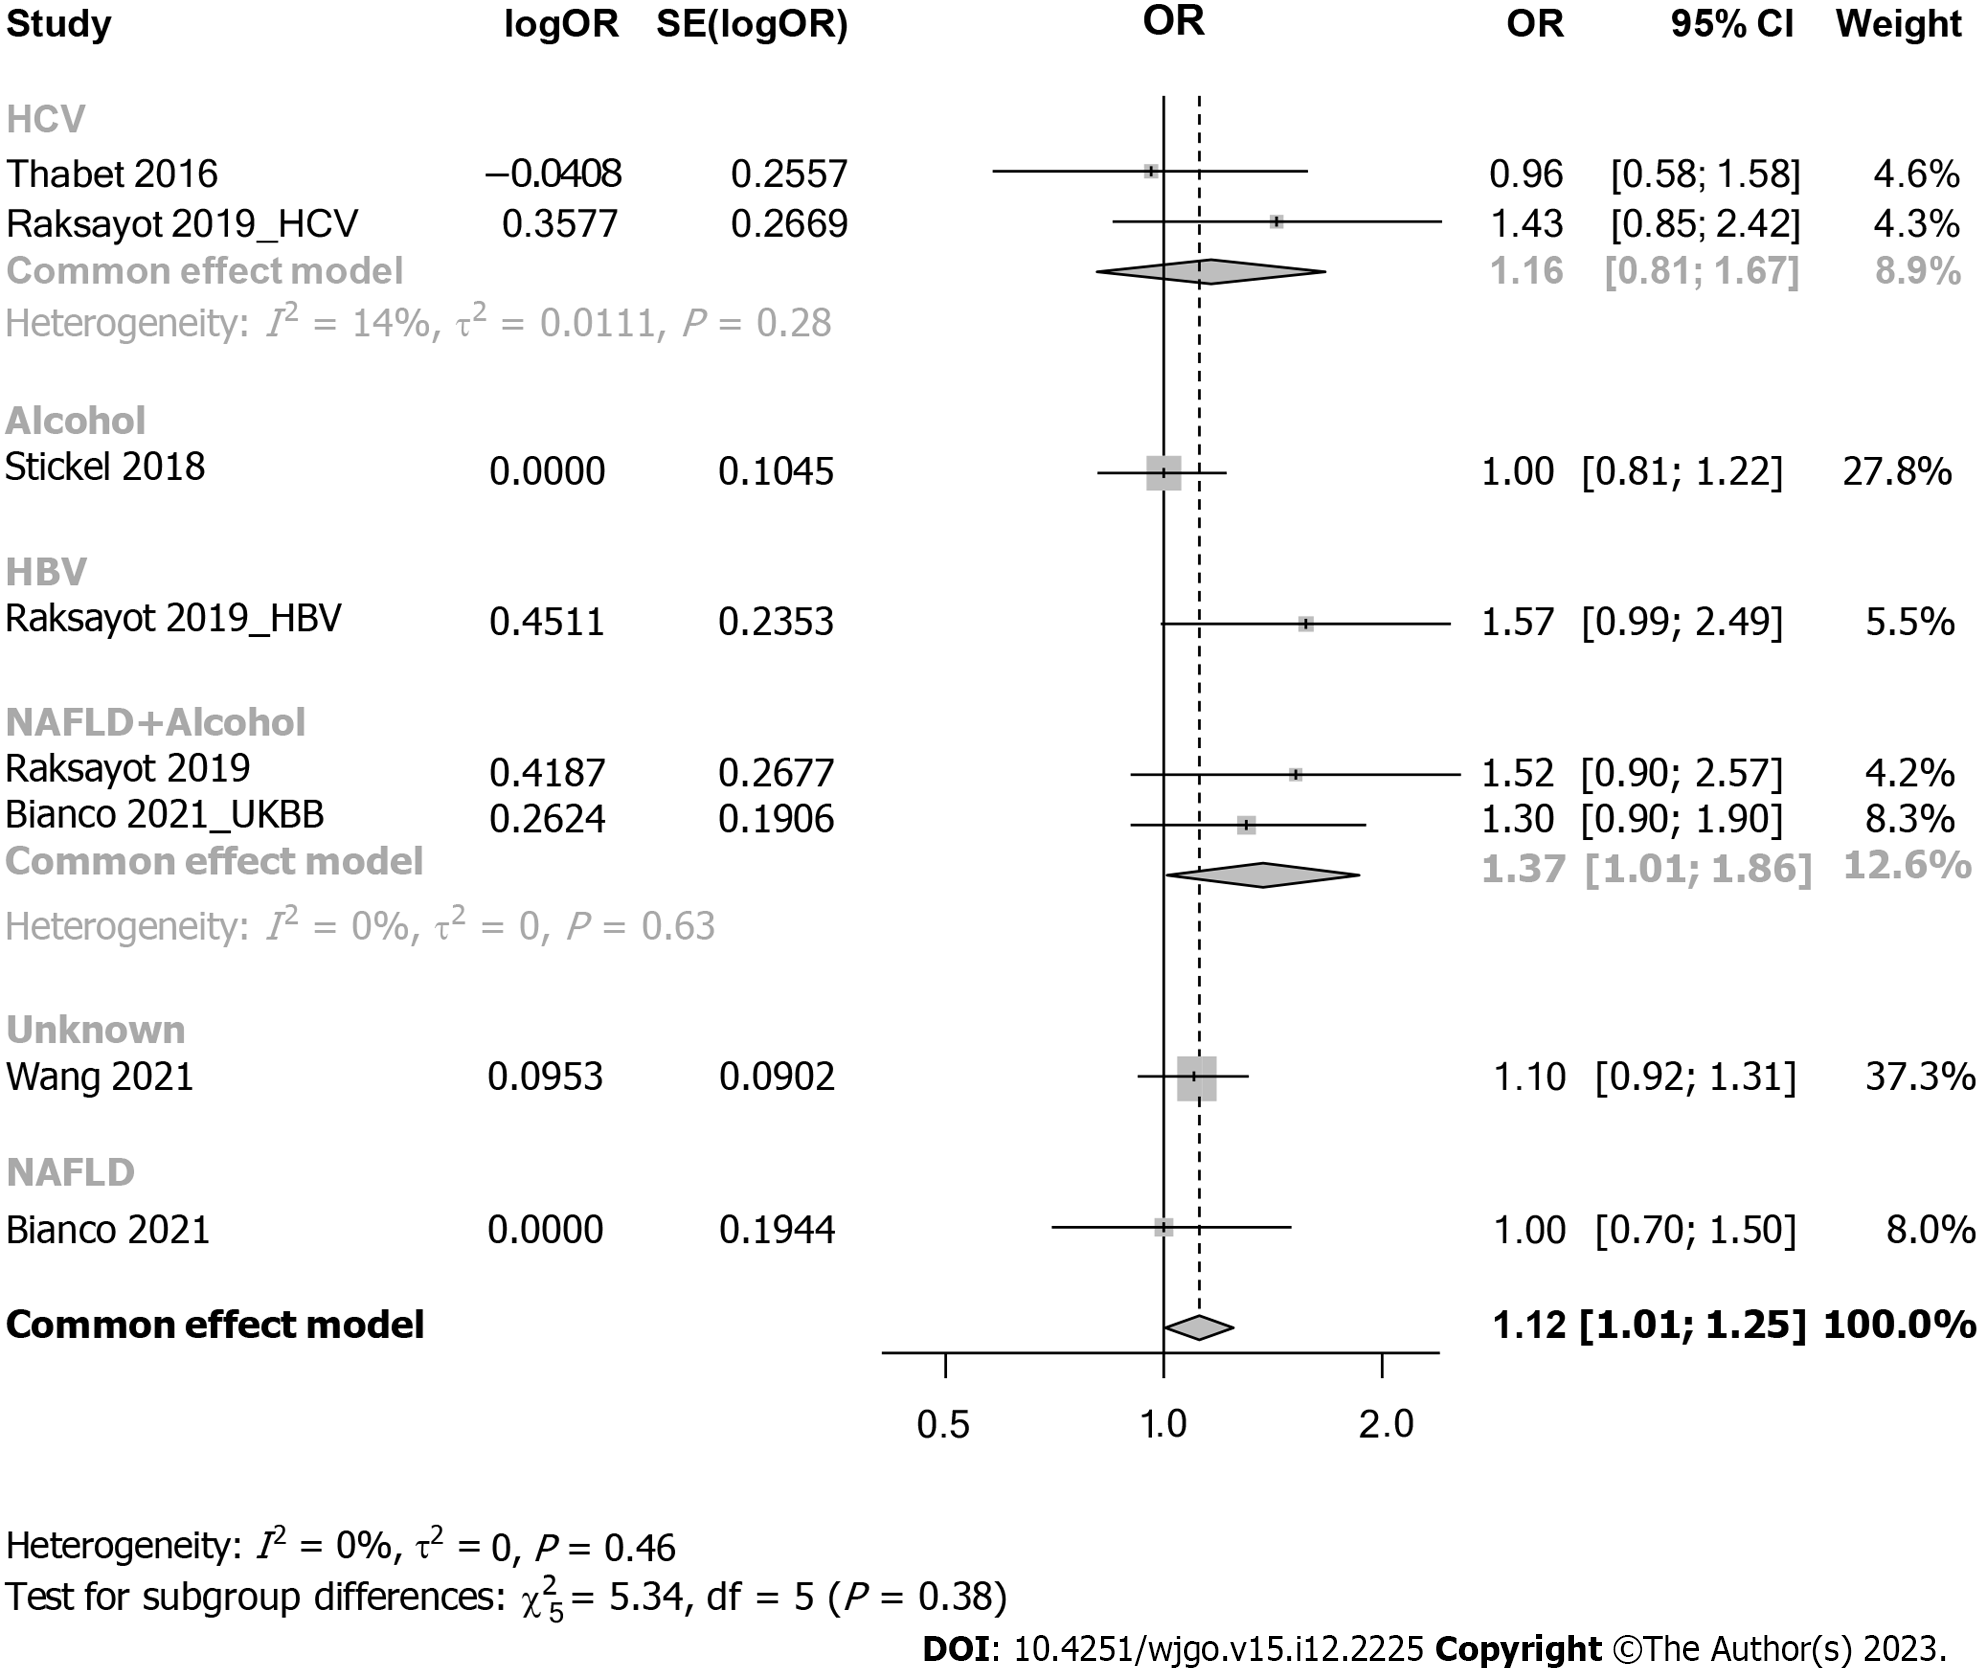
Figure 6 Forest plot of subgroup analysis under the dominant model (stratification by detailed etiology).
OR: Odds ratio; 95%CI: 95% confidence interval; HBV: Hepatitis B virus; HCV: Hepatitis C virus; UKBB: United Kingdom Biobank.
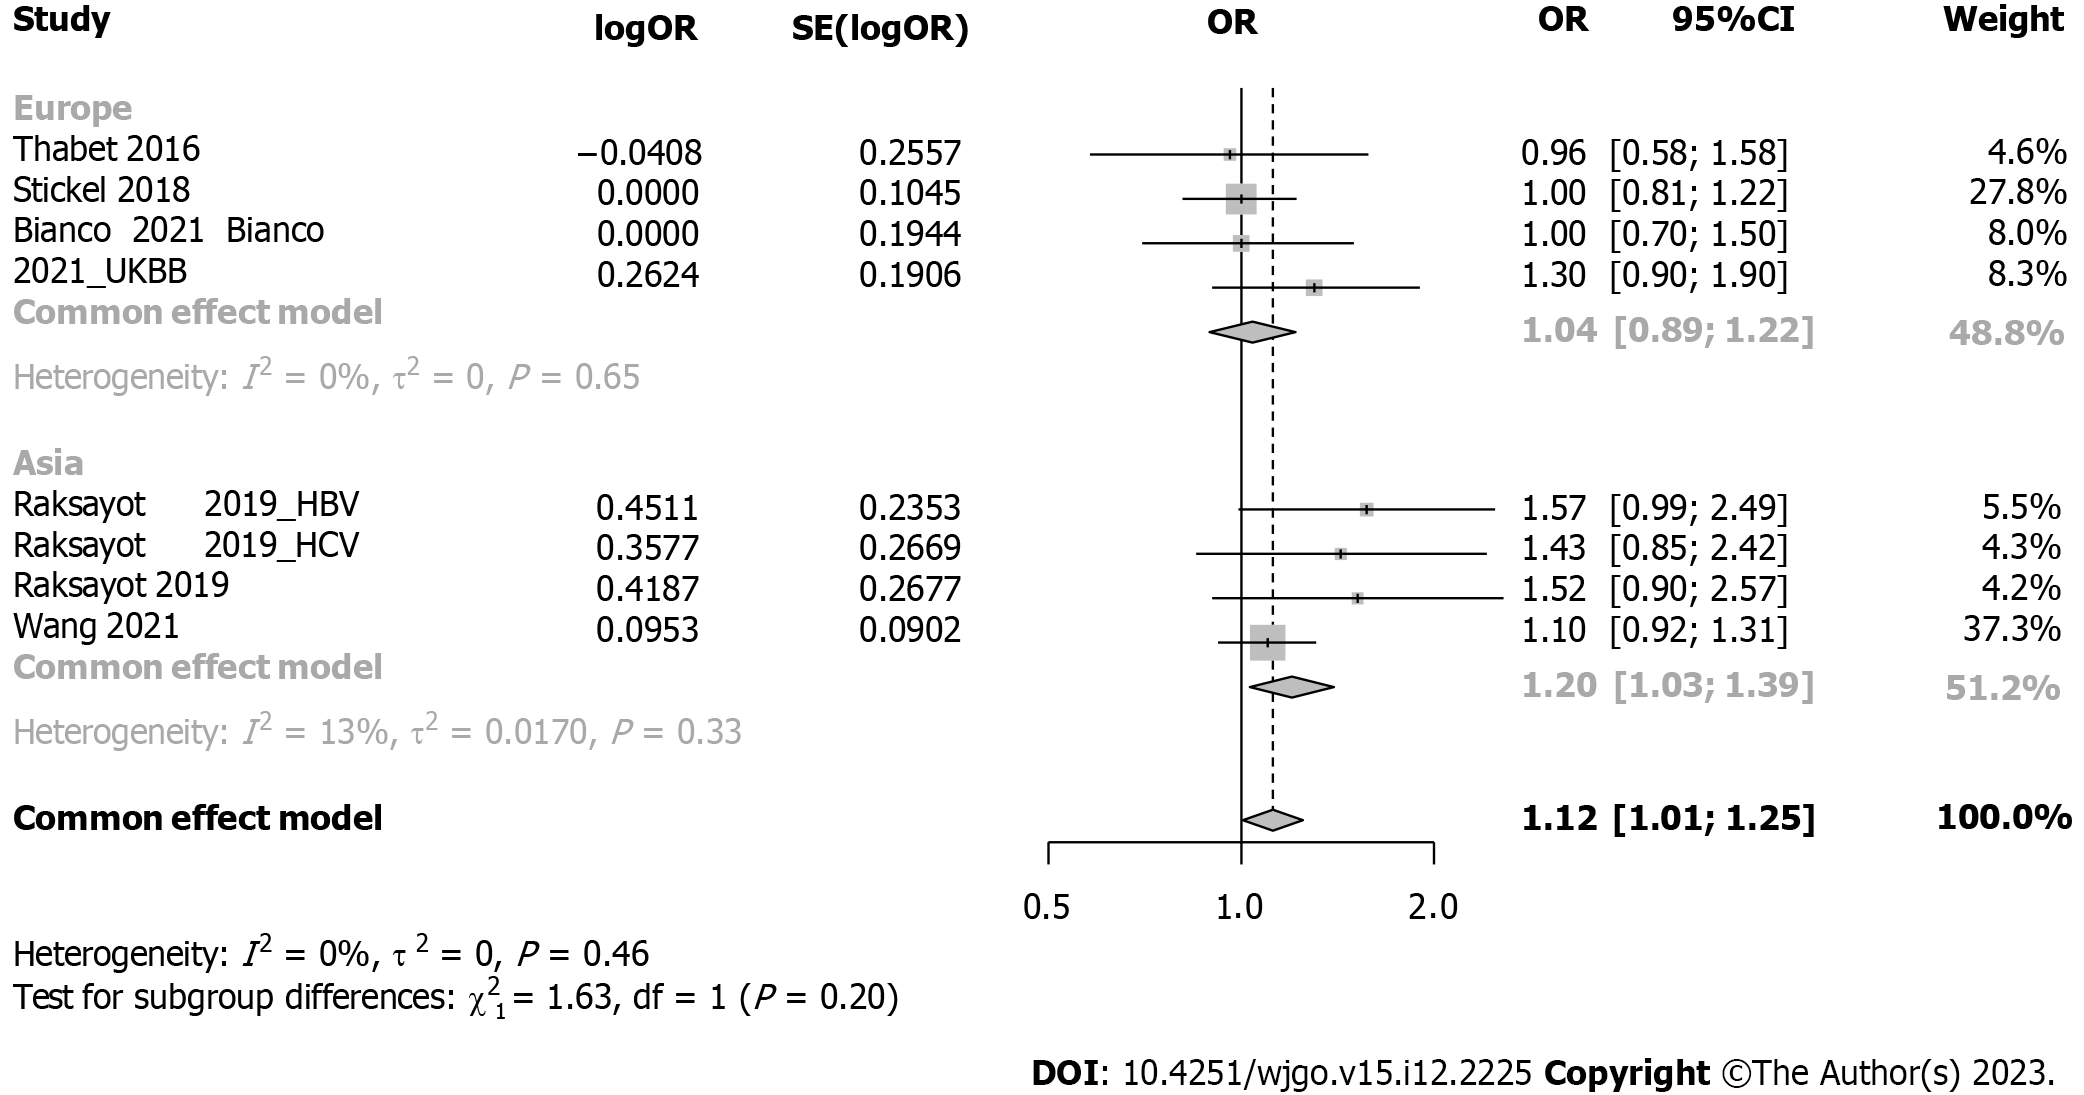
Figure 7 Forest plot of subgroup analysis under the dominant model (stratification by geographical origin).
OR: Odds ratio; 95%CI: 95% confidence interval; HBV: Hepatitis B virus; HCV: Hepatitis C virus; UKBB: United Kingdom Biobank.
- Citation: Lai M, Qin YL, Jin QY, Chen WJ, Hu J. Association of MBOAT7 rs641738 polymorphism with hepatocellular carcinoma susceptibility: A systematic review and meta-analysis. World J Gastrointest Oncol 2023; 15(12): 2225-2236
- URL: https://www.wjgnet.com/1948-5204/full/v15/i12/2225.htm
- DOI: https://dx.doi.org/10.4251/wjgo.v15.i12.2225


