Copyright
©The Author(s) 2023.
World J Gastrointest Oncol. Oct 15, 2023; 15(10): 1784-1795
Published online Oct 15, 2023. doi: 10.4251/wjgo.v15.i10.1784
Published online Oct 15, 2023. doi: 10.4251/wjgo.v15.i10.1784
Figure 1 Flowchart depicting the patient selection process.
KRS: Khorana risk score.
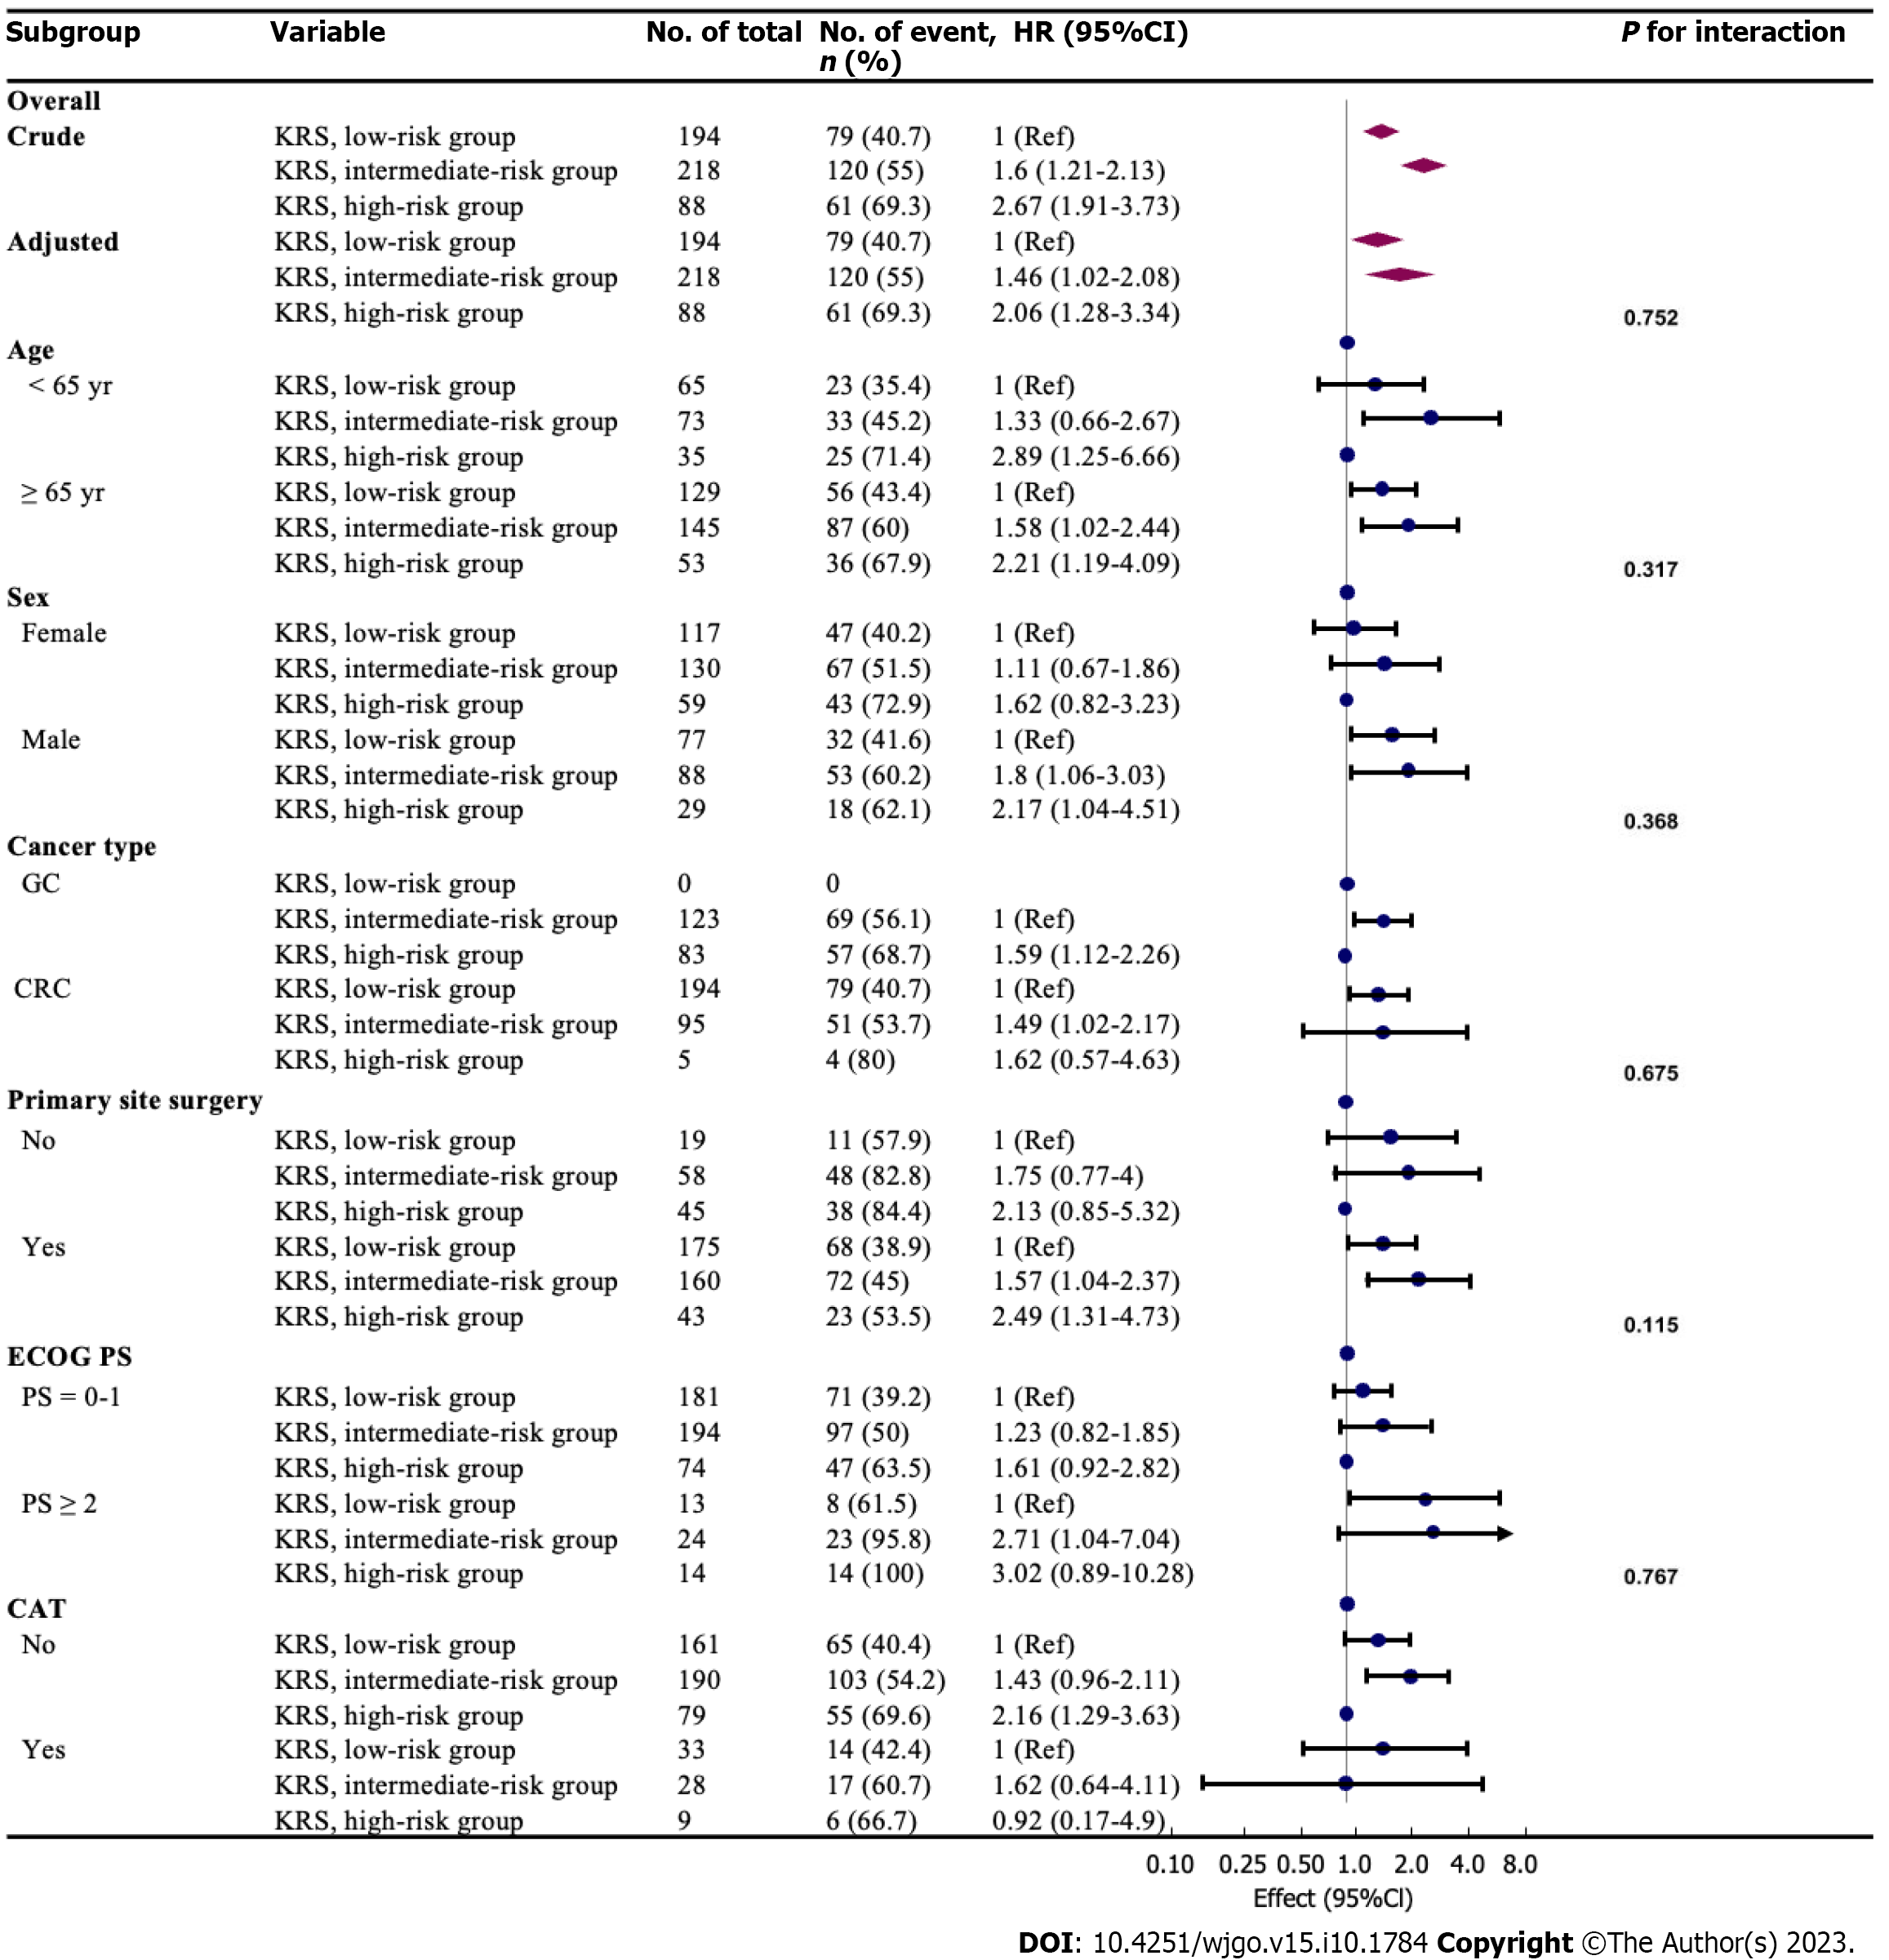
Figure 2 Stratified analyses of the association between Khorana risk score and all-cause death within 2 years in accordance to baseline characteristics.
The P value for interaction represents the likelihood of interaction between the variable and Khorana risk score. KRS: Khorana risk score; CAT: Cancer-associated thrombosis; ECOG PS: Eastern Cooperative Oncology Group; GC: Gastric cancer; CRC: Colorectal cancer; HR: Hazard ratios; CI: Confidence intervals.
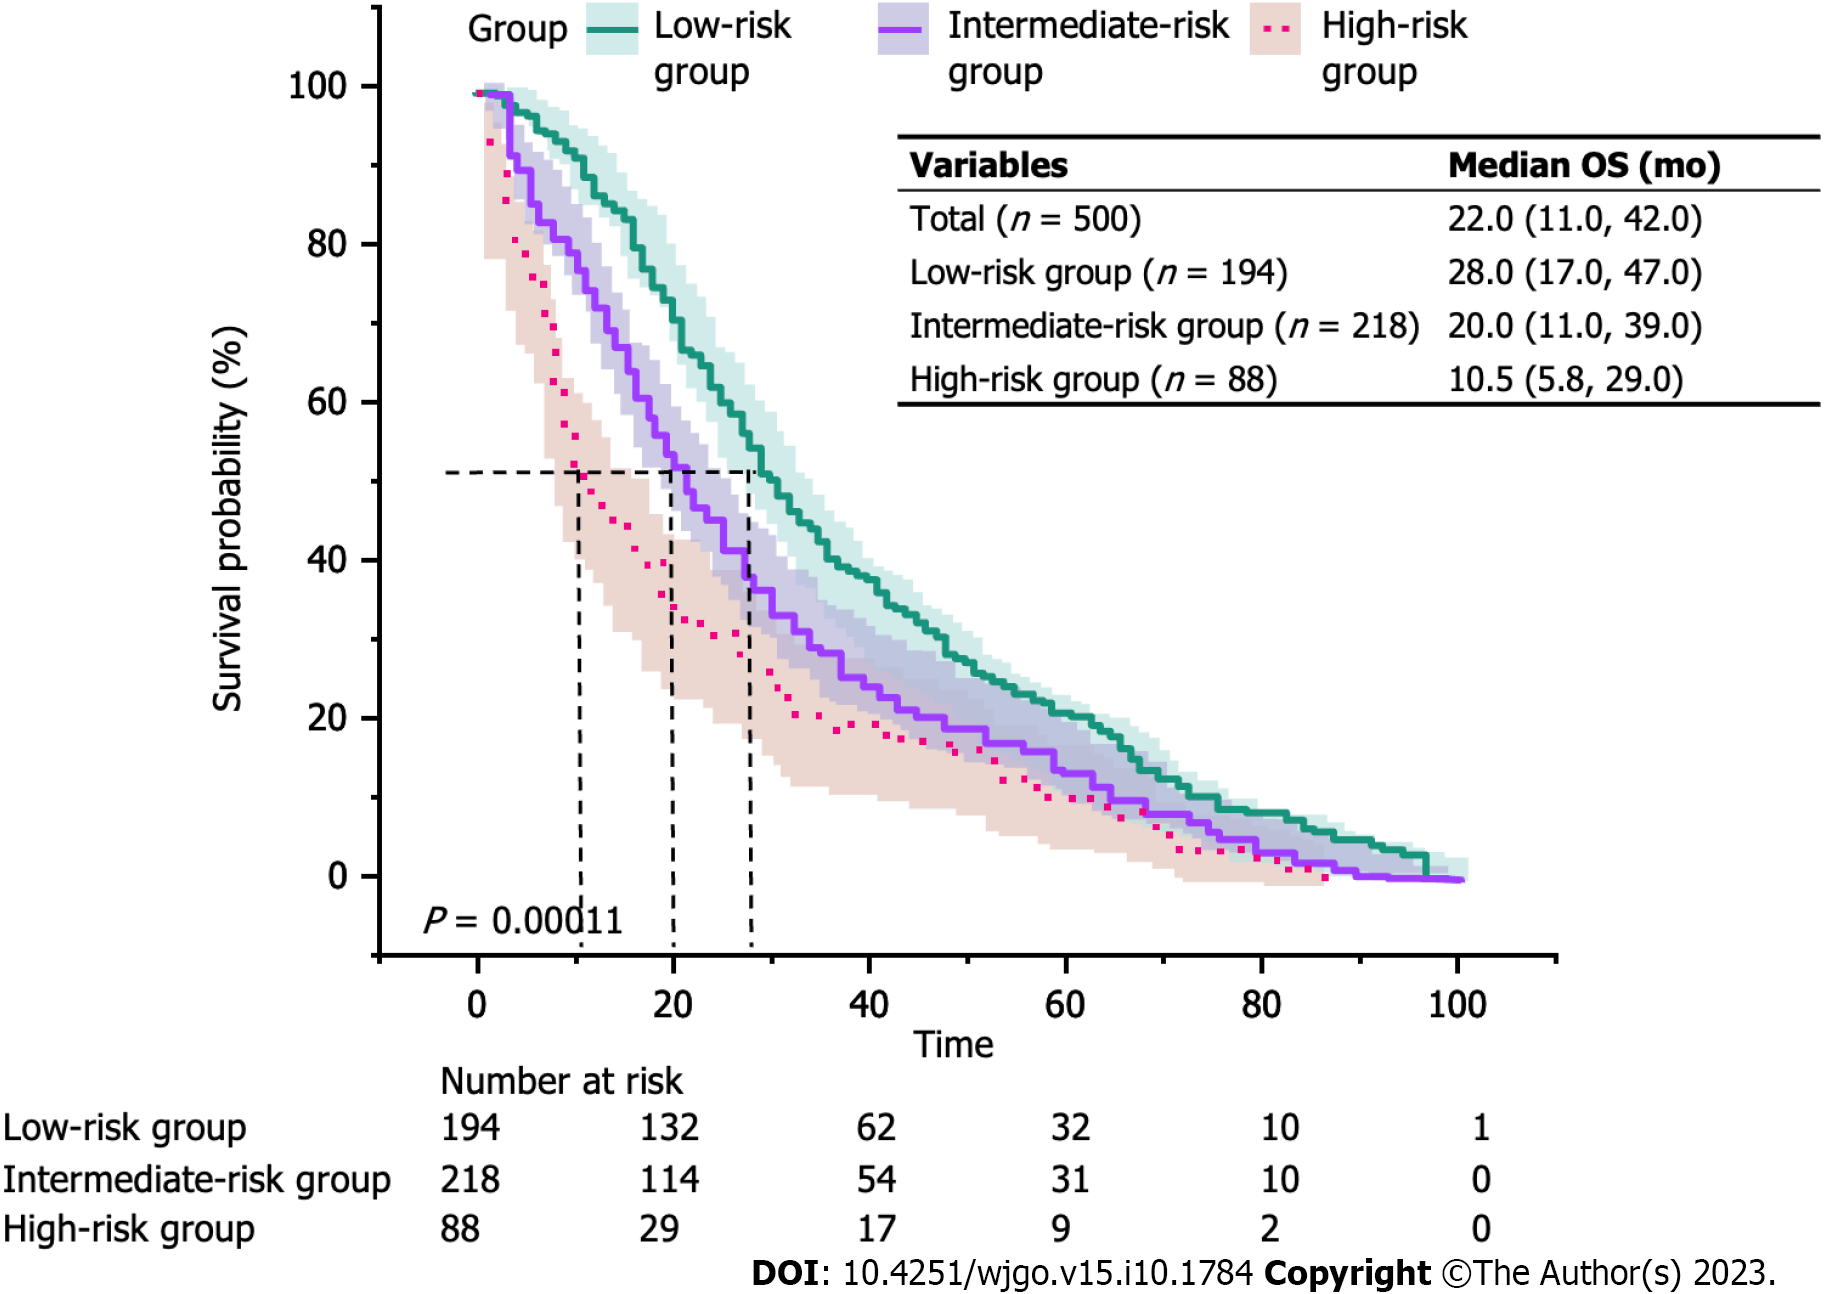
Figure 3 The Kaplan-Meier curves of overall survival in different risk groups.
The median overall survival for the three groups was 28.0 mo in the low-risk group, 20.0 mo in the intermediate-risk group, and 10.5 mo in the high-risk group (P < 0.001). OS: Overall survival.
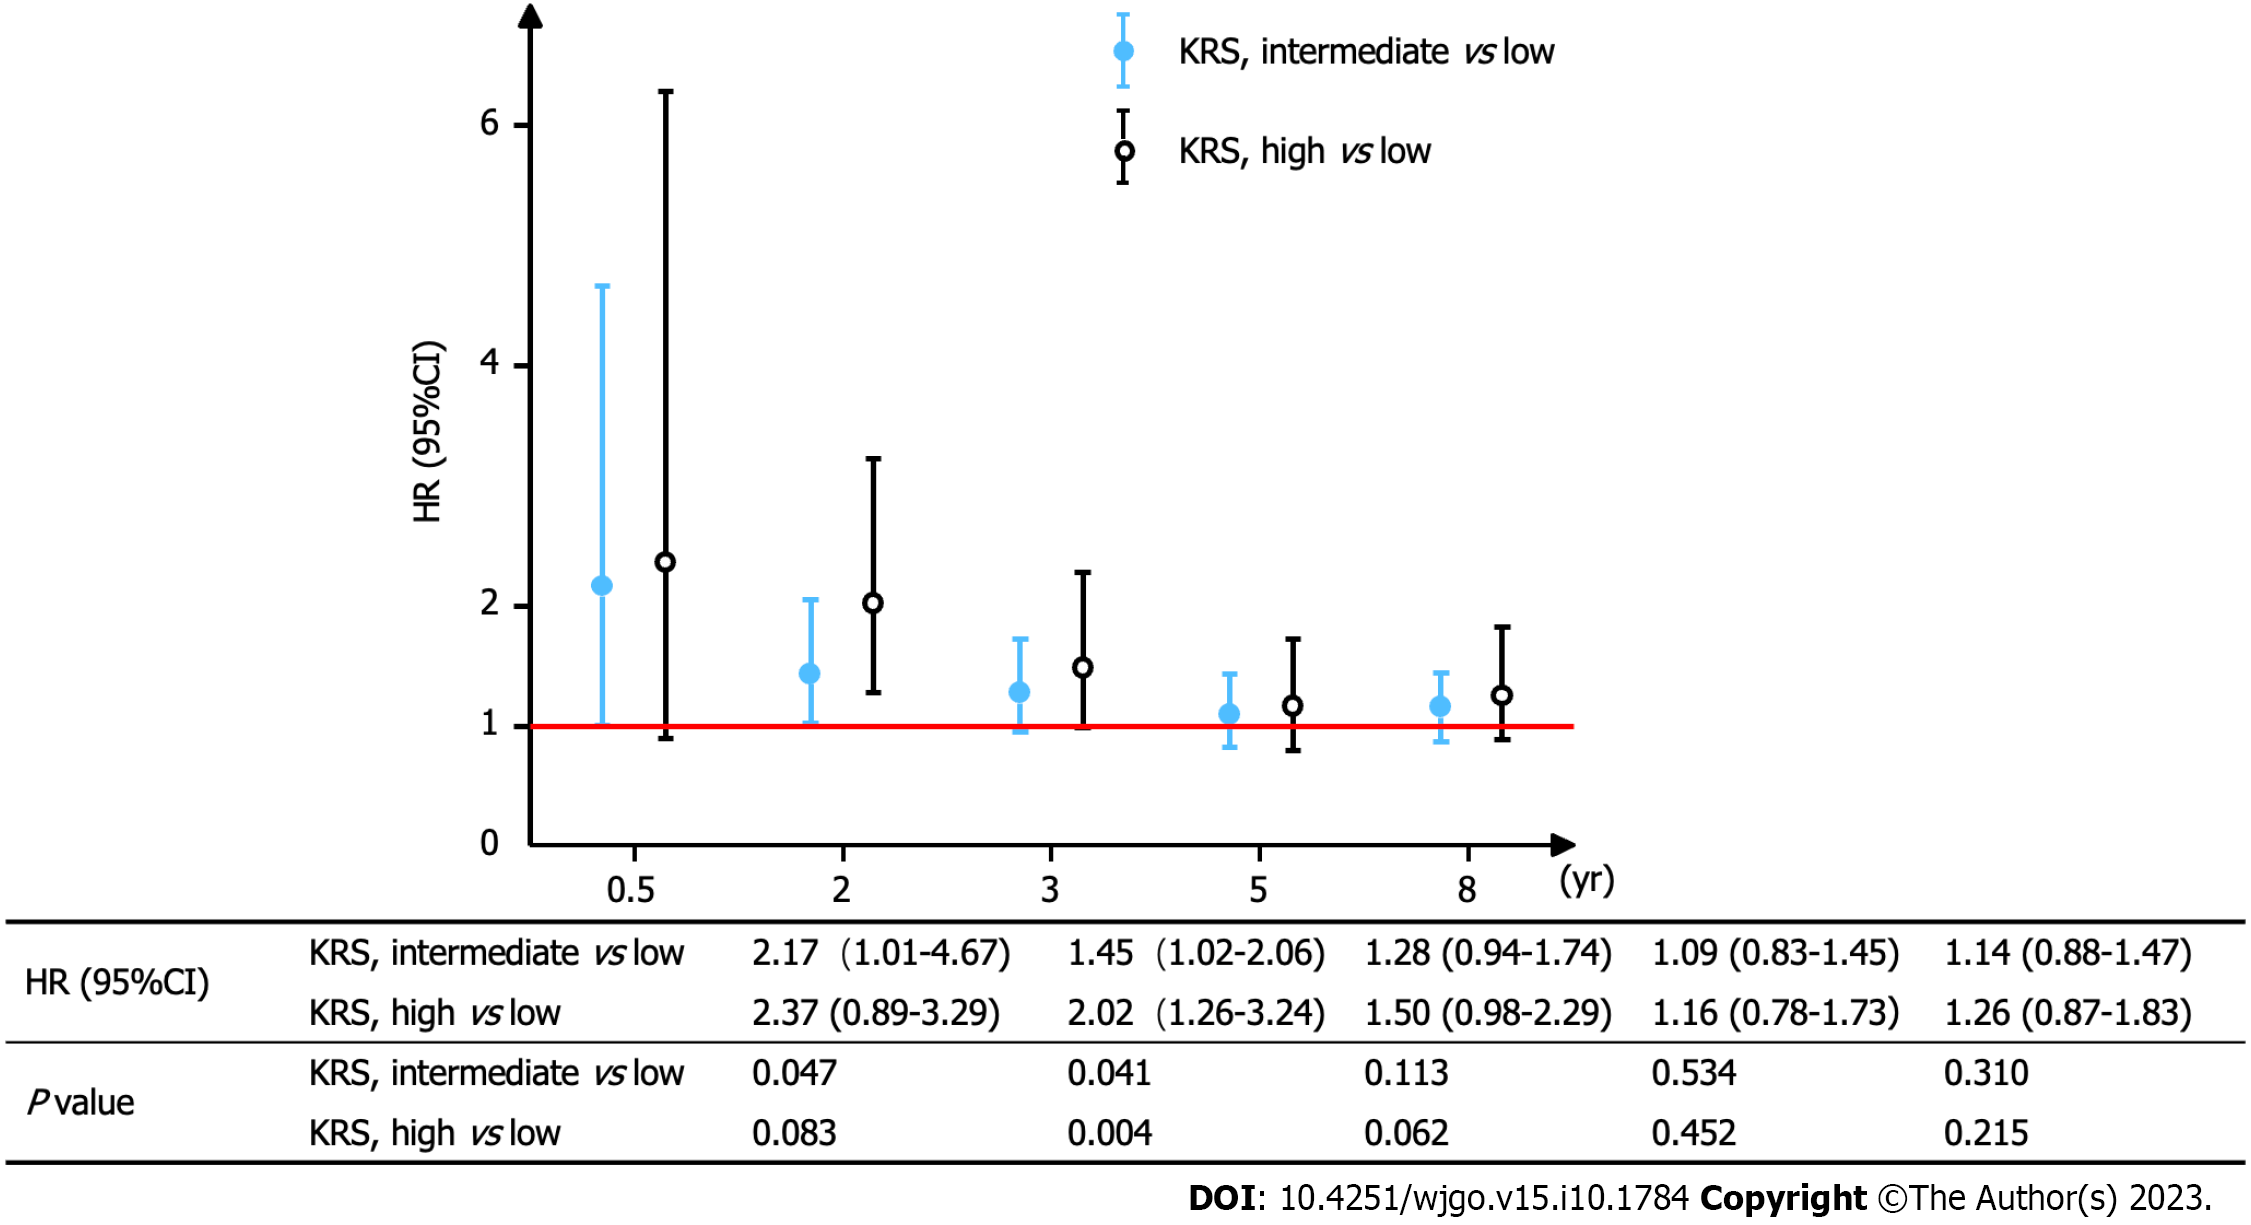
Figure 4 A multivariable-adjusted Cox proportional hazards models was applied to observe the mortality risk ratio over a given number of years.
Multivariable-adjusted Cox proportional hazards models: Adjusted for age, sex, cancer-associated thrombosis, Eastern Cooperative Oncology Group, cancer type, pathological type, primary site surgery, adjuvant chemotherapy, active cancer, single or multiple primary, central venous catheter, thrombosis treatment, opportunity for diagnosis. The graph depicts the risk ratios and their trends across different years. KRS: Khorana risk score; HR: Hazards ratio.
- Citation: Zhang YF, Wang GD, Huang MG, Qiu ZQ, Si J, Xu MY. Association between the Khorana risk score and all-cause mortality in Japanese patients with gastric and colorectal cancer: A retrospective cohort study. World J Gastrointest Oncol 2023; 15(10): 1784-1795
- URL: https://www.wjgnet.com/1948-5204/full/v15/i10/1784.htm
- DOI: https://dx.doi.org/10.4251/wjgo.v15.i10.1784


