Copyright
©The Author(s) 2022.
World J Gastrointest Oncol. Oct 15, 2022; 14(10): 2038-2047
Published online Oct 15, 2022. doi: 10.4251/wjgo.v14.i10.2038
Published online Oct 15, 2022. doi: 10.4251/wjgo.v14.i10.2038
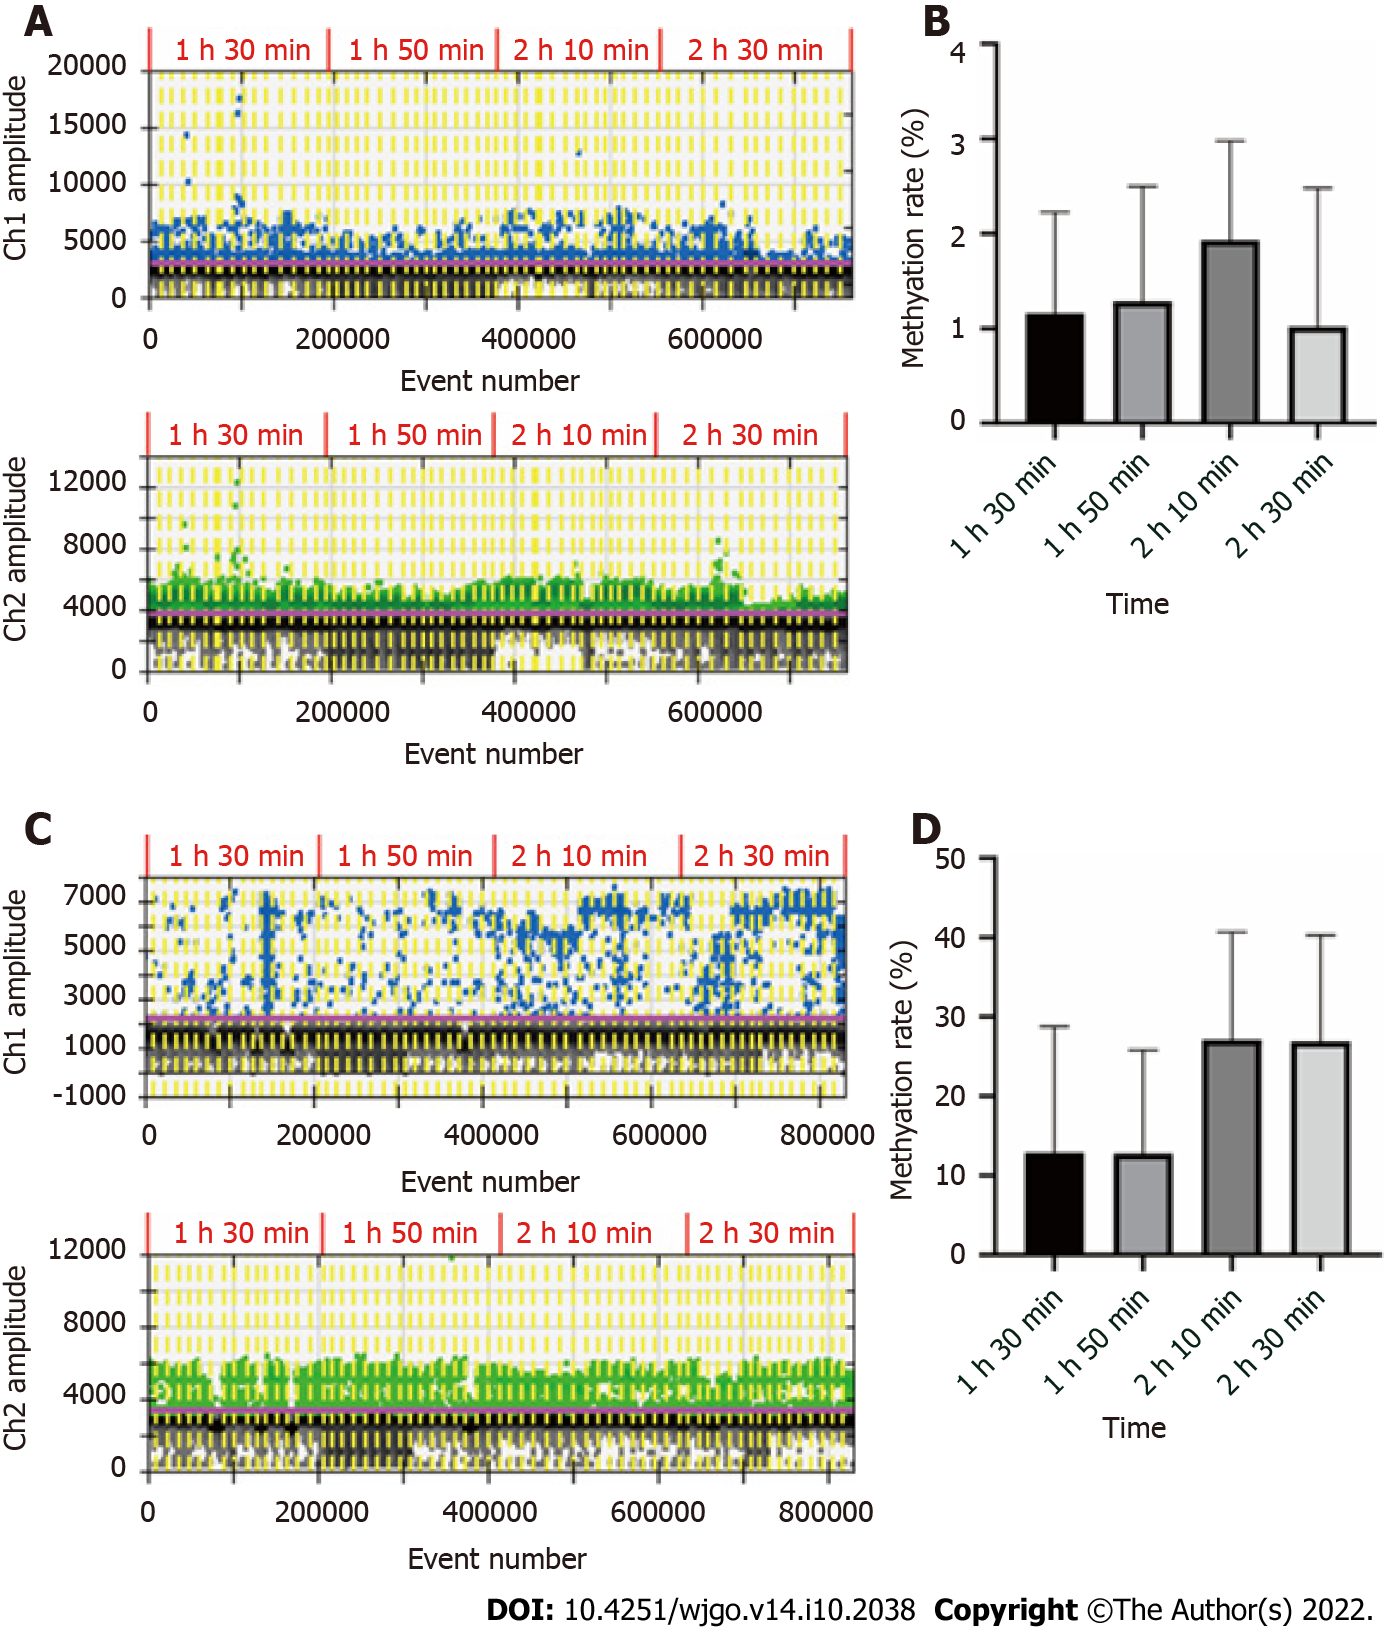
Figure 1 Conversion time of blood DNA and plasma DNA.
A: The droplet digital polymerase chain reaction (ddPCR) results of 16 blood DNA samples converted for different times. Above: Fluorescence channel 1, methylation droplets; below: Channel 2, unmethylation droplets; B: Histogram of methylation rate of blood DNA samples at different conversion times; C: The ddPCR results of 16 plasma DNA samples; D: Histogram of methylation rates of plasma DNA samples.
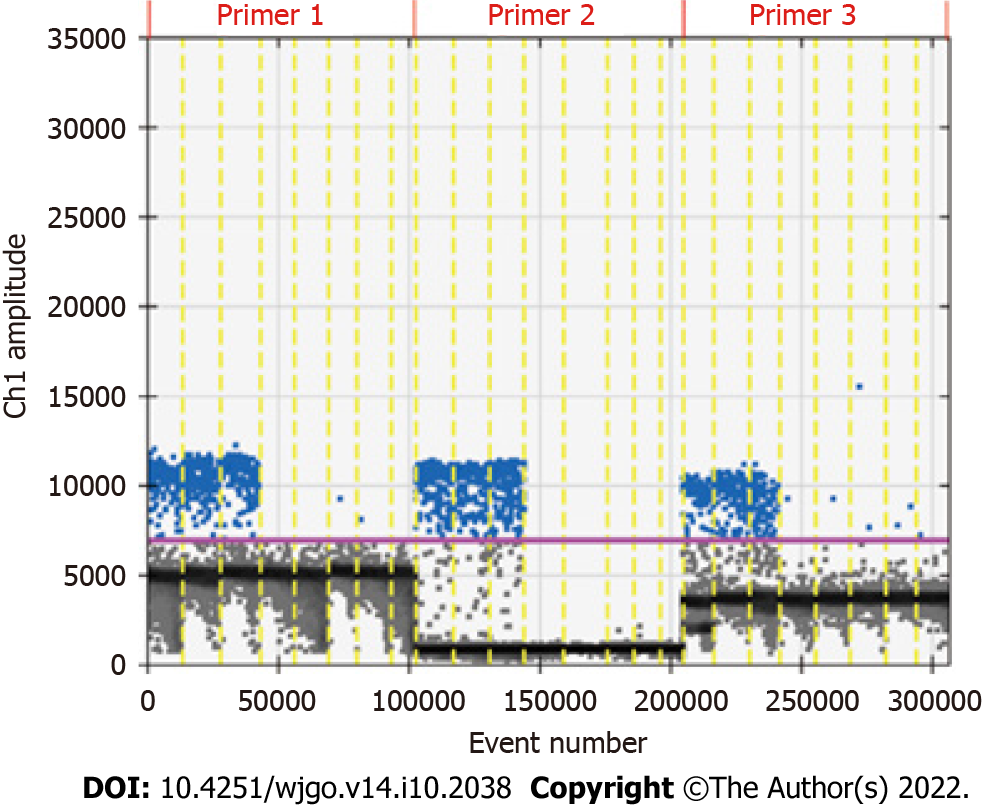
Figure 2 Fluorescence channel 1 results of methylated RNF180.
The X-axis is the total number of droplets, the Y-axis is the fluorescence signal intensity, and the solid horizontal line (purple) is the signal threshold. The droplets with fluorescence signal intensity above the threshold line were positive droplets (blue). The droplets with fluorescence signal intensity below the threshold were negative droplets (gray).
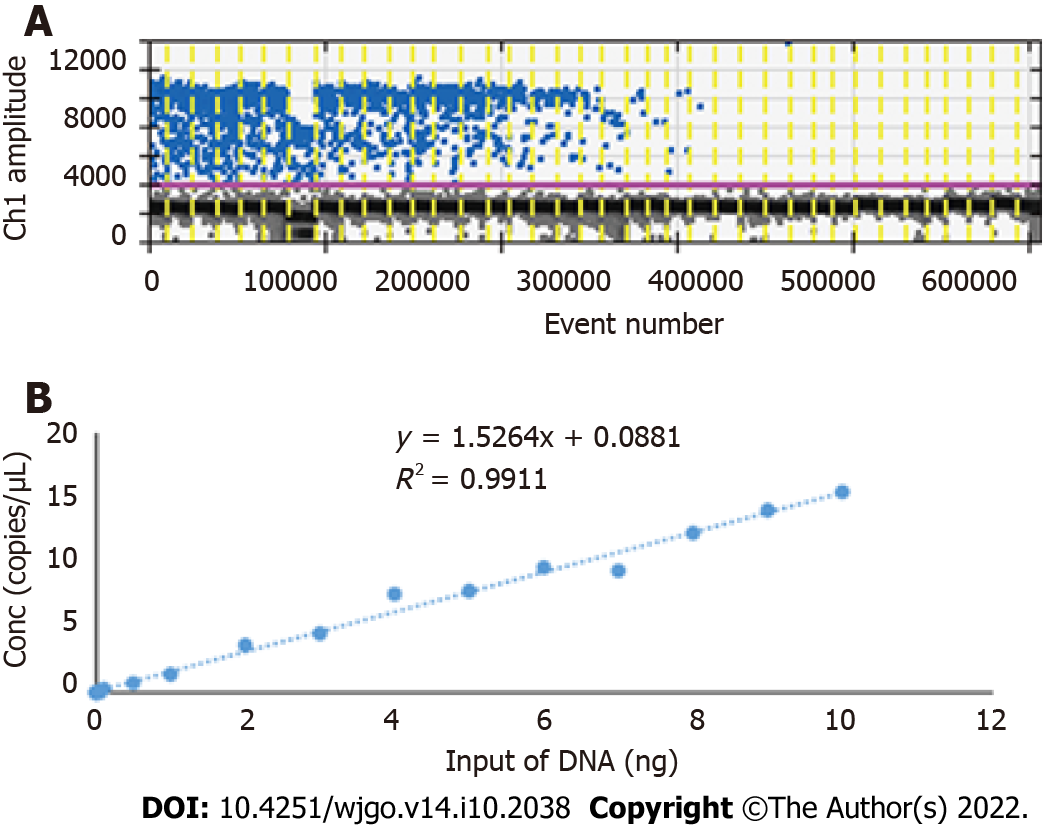
Figure 3 Limit of detection of droplet digital polymerase chain reaction.
A: Diagram of the droplet digital polymerase chain reaction (ddPCR) results; B: Line graph of ddPCR limit of detection.
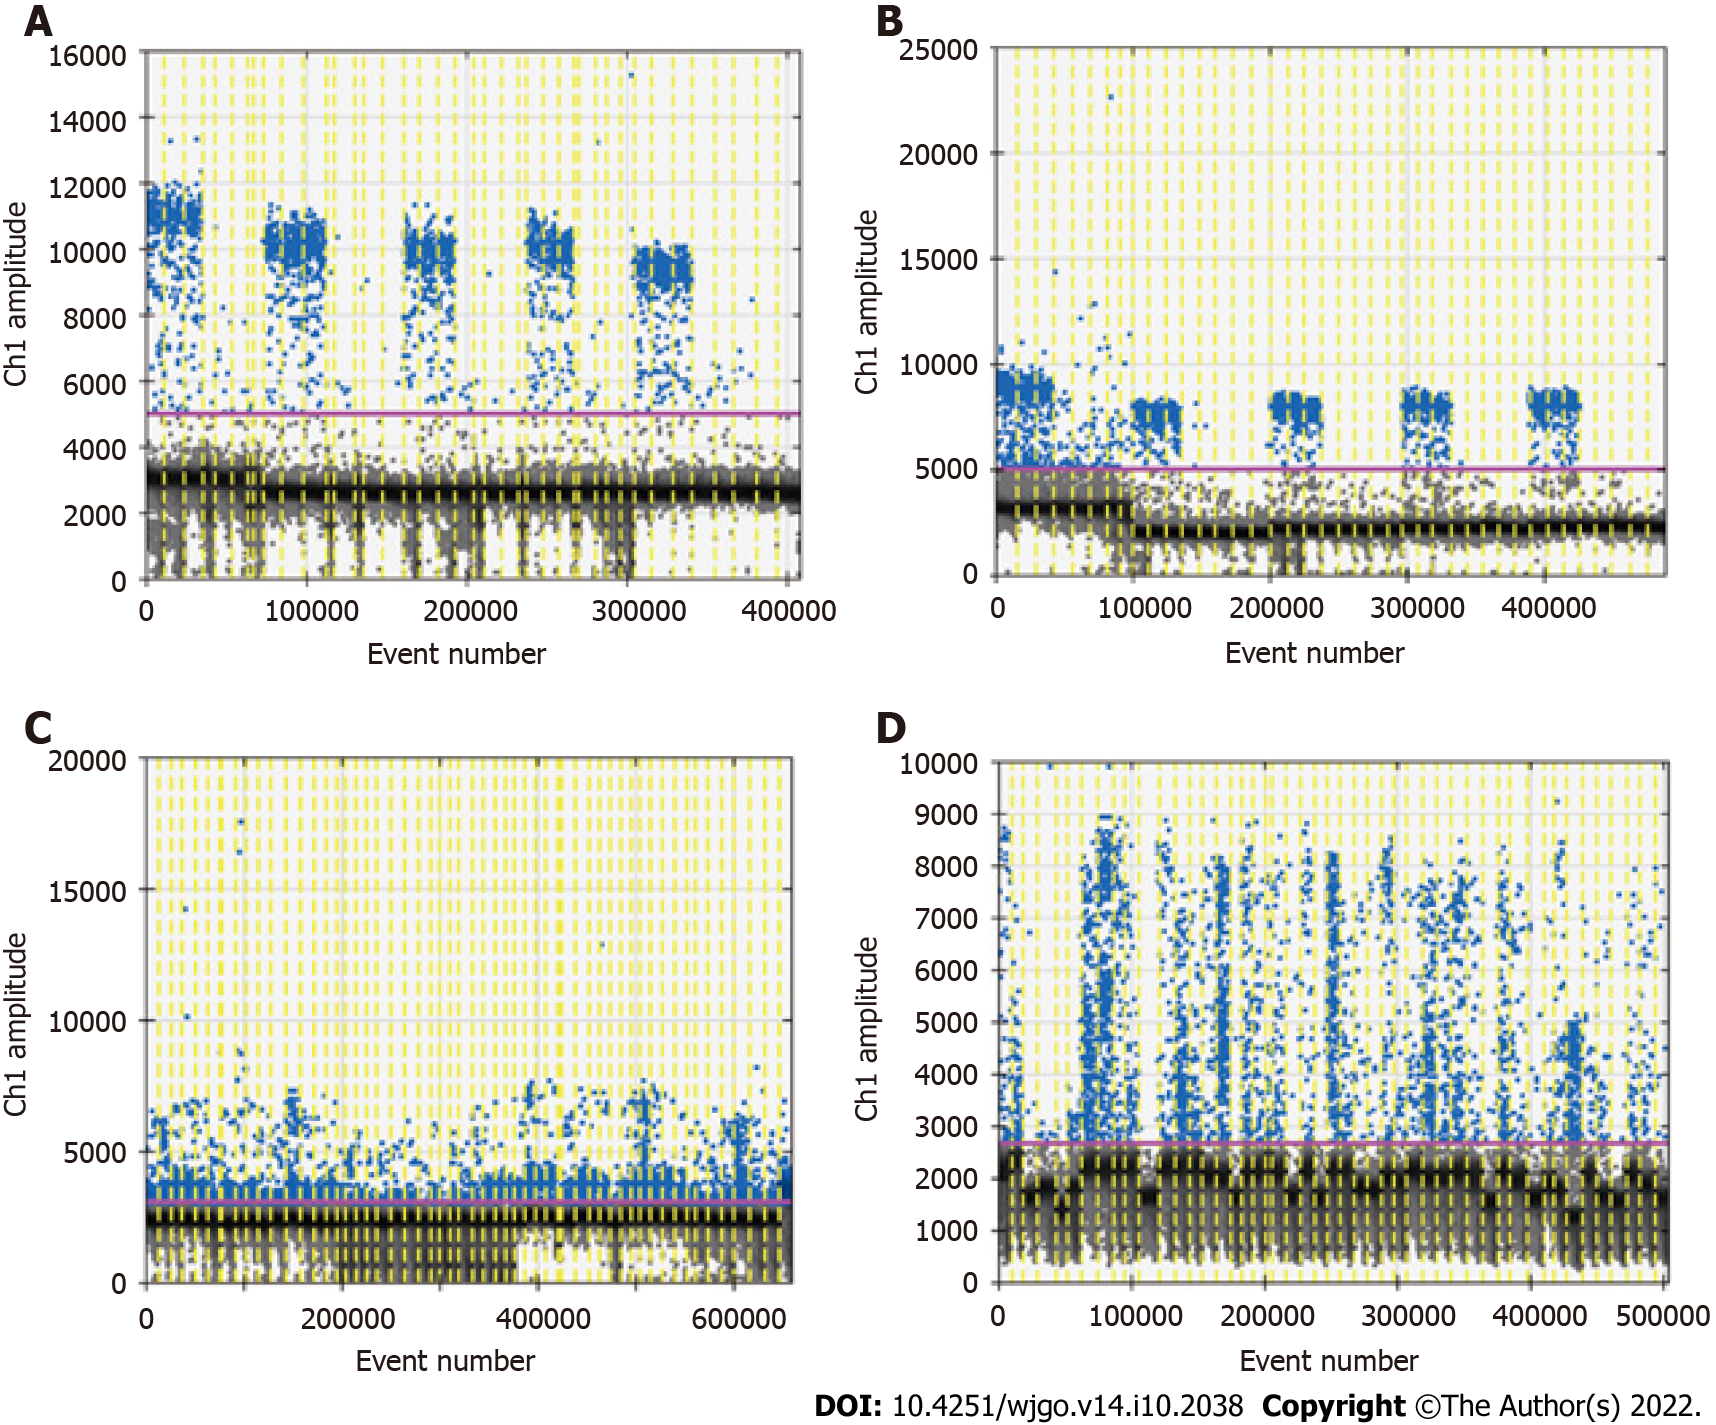
Figure 4 Optimization of amplification temperature and cycles.
A and B: The droplet digital polymerase chain reaction (ddPCR) results of the amplification temperatures of 56 °C and 59 °C; C and D: The ddPCR results with 45 and 50 cycles of amplification.
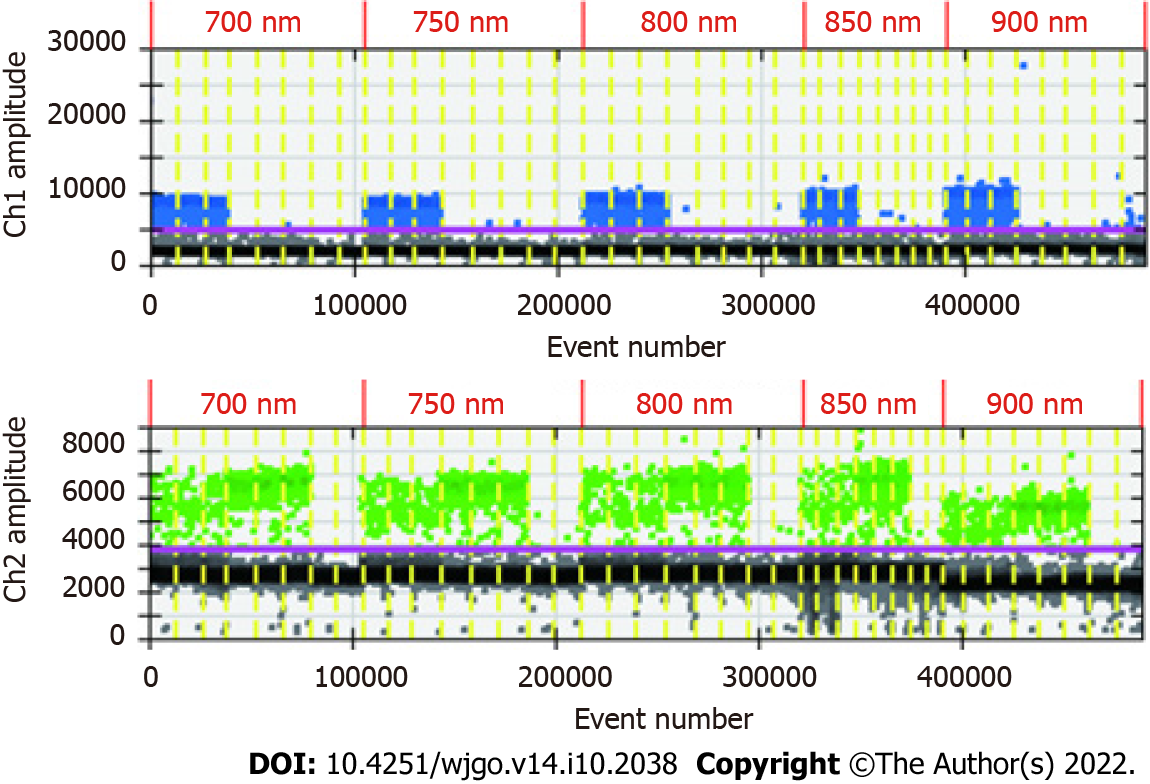
Figure 5 The droplet digital polymerase chain reaction results of different primer concentrations.
- Citation: Guo GH, Xie YB, Jiang T, An Y. Droplet digital polymerase chain reaction assay for methylated ring finger protein 180 in gastric cancer. World J Gastrointest Oncol 2022; 14(10): 2038-2047
- URL: https://www.wjgnet.com/1948-5204/full/v14/i10/2038.htm
- DOI: https://dx.doi.org/10.4251/wjgo.v14.i10.2038


