©The Author(s) 2025.
World J Gastrointest Endosc. Sep 16, 2025; 17(9): 109033
Published online Sep 16, 2025. doi: 10.4253/wjge.v17.i9.109033
Published online Sep 16, 2025. doi: 10.4253/wjge.v17.i9.109033
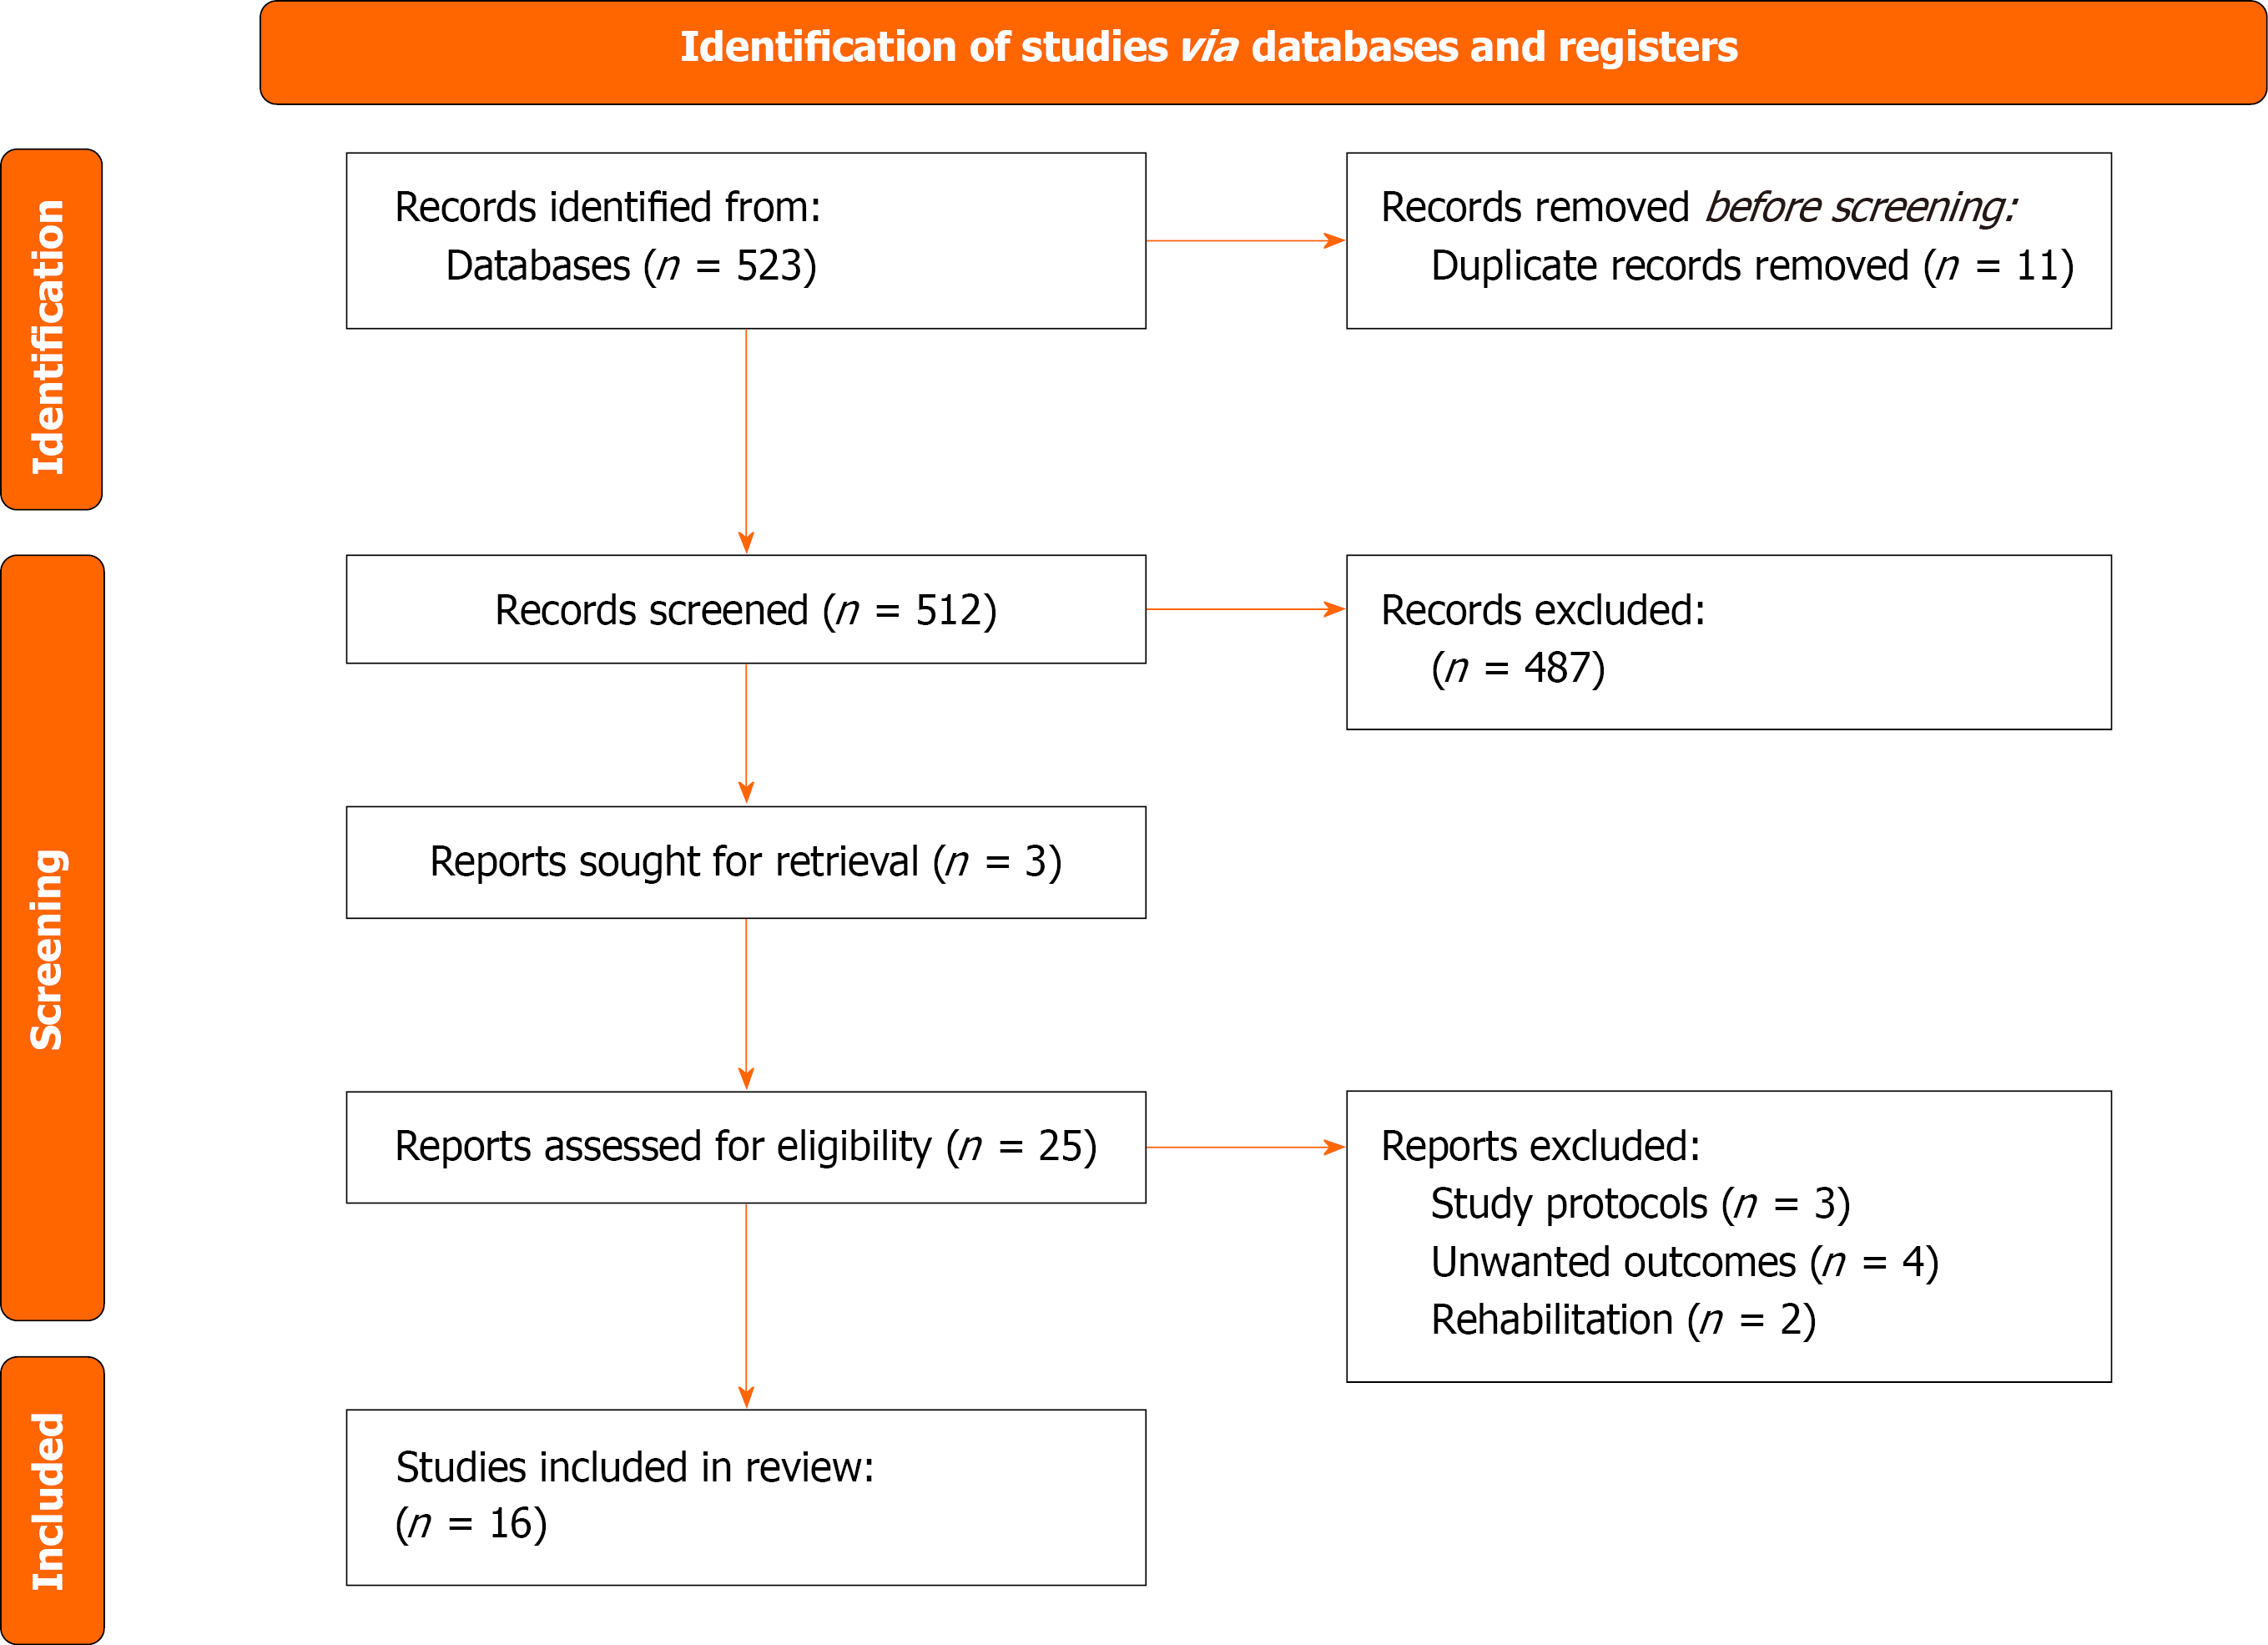
Figure 1
Preferred Reporting Items for Systematic Reviews and Meta-analyses flow chart explaining identification of studies via databases.
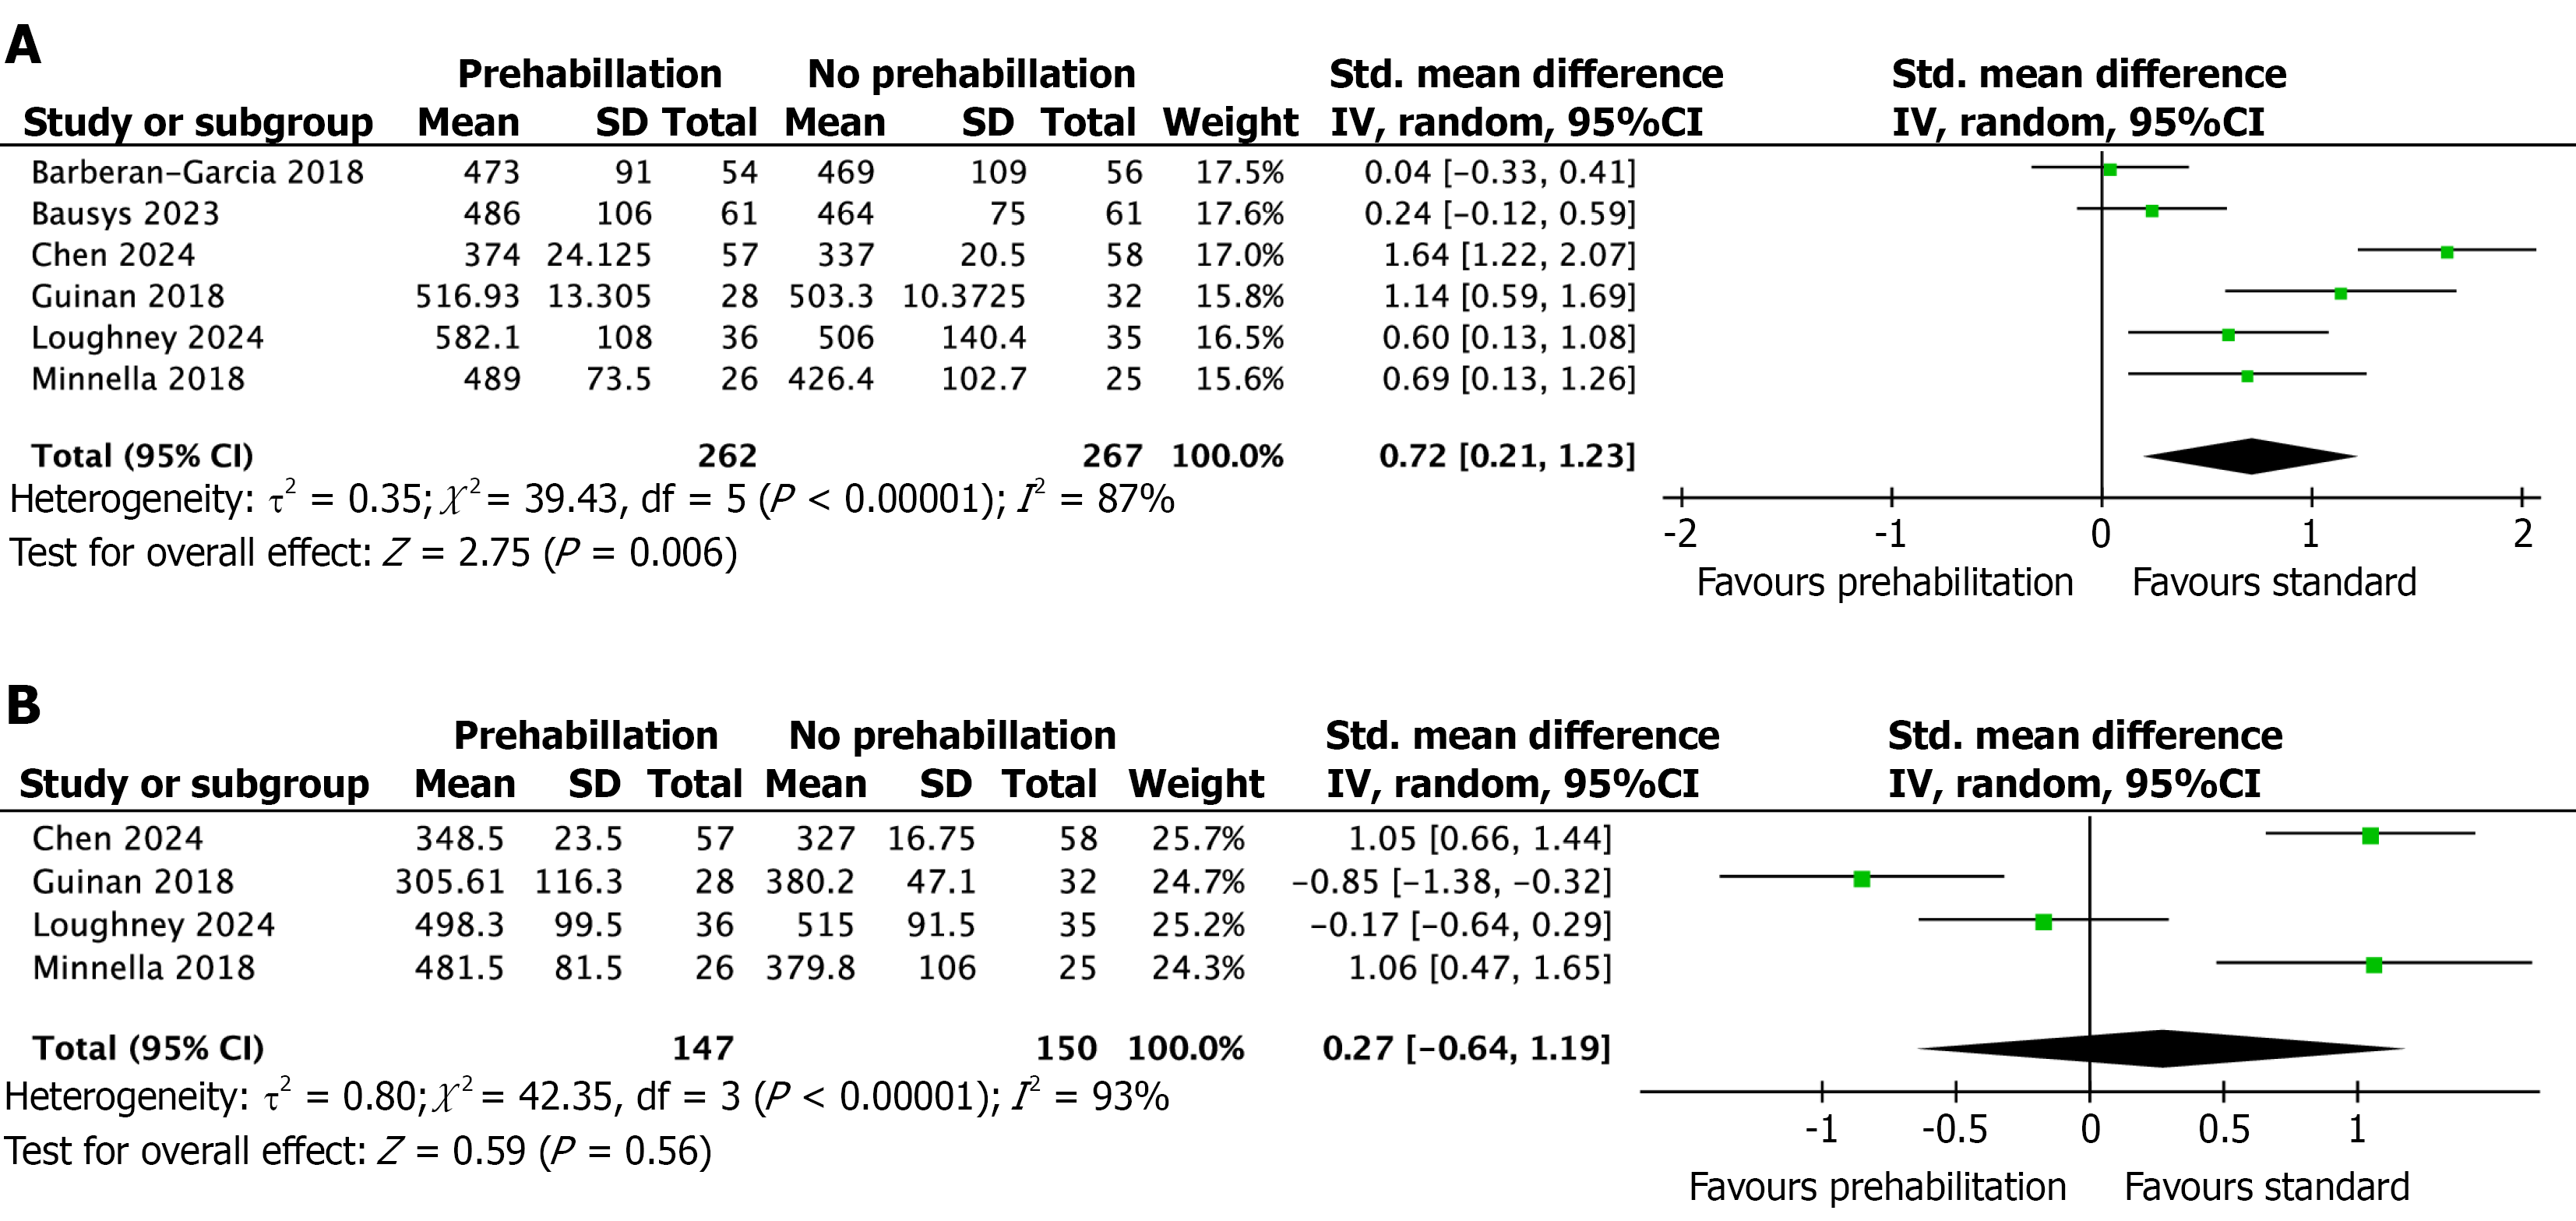
Figure 2 Forest plot showing preoperative and postoperative 6-minute walking distance represented in standardised mean difference with 95%CI.
A: Preoperative 6-minute walking distance (6-MWD); B: Postoperative 6-MWD.
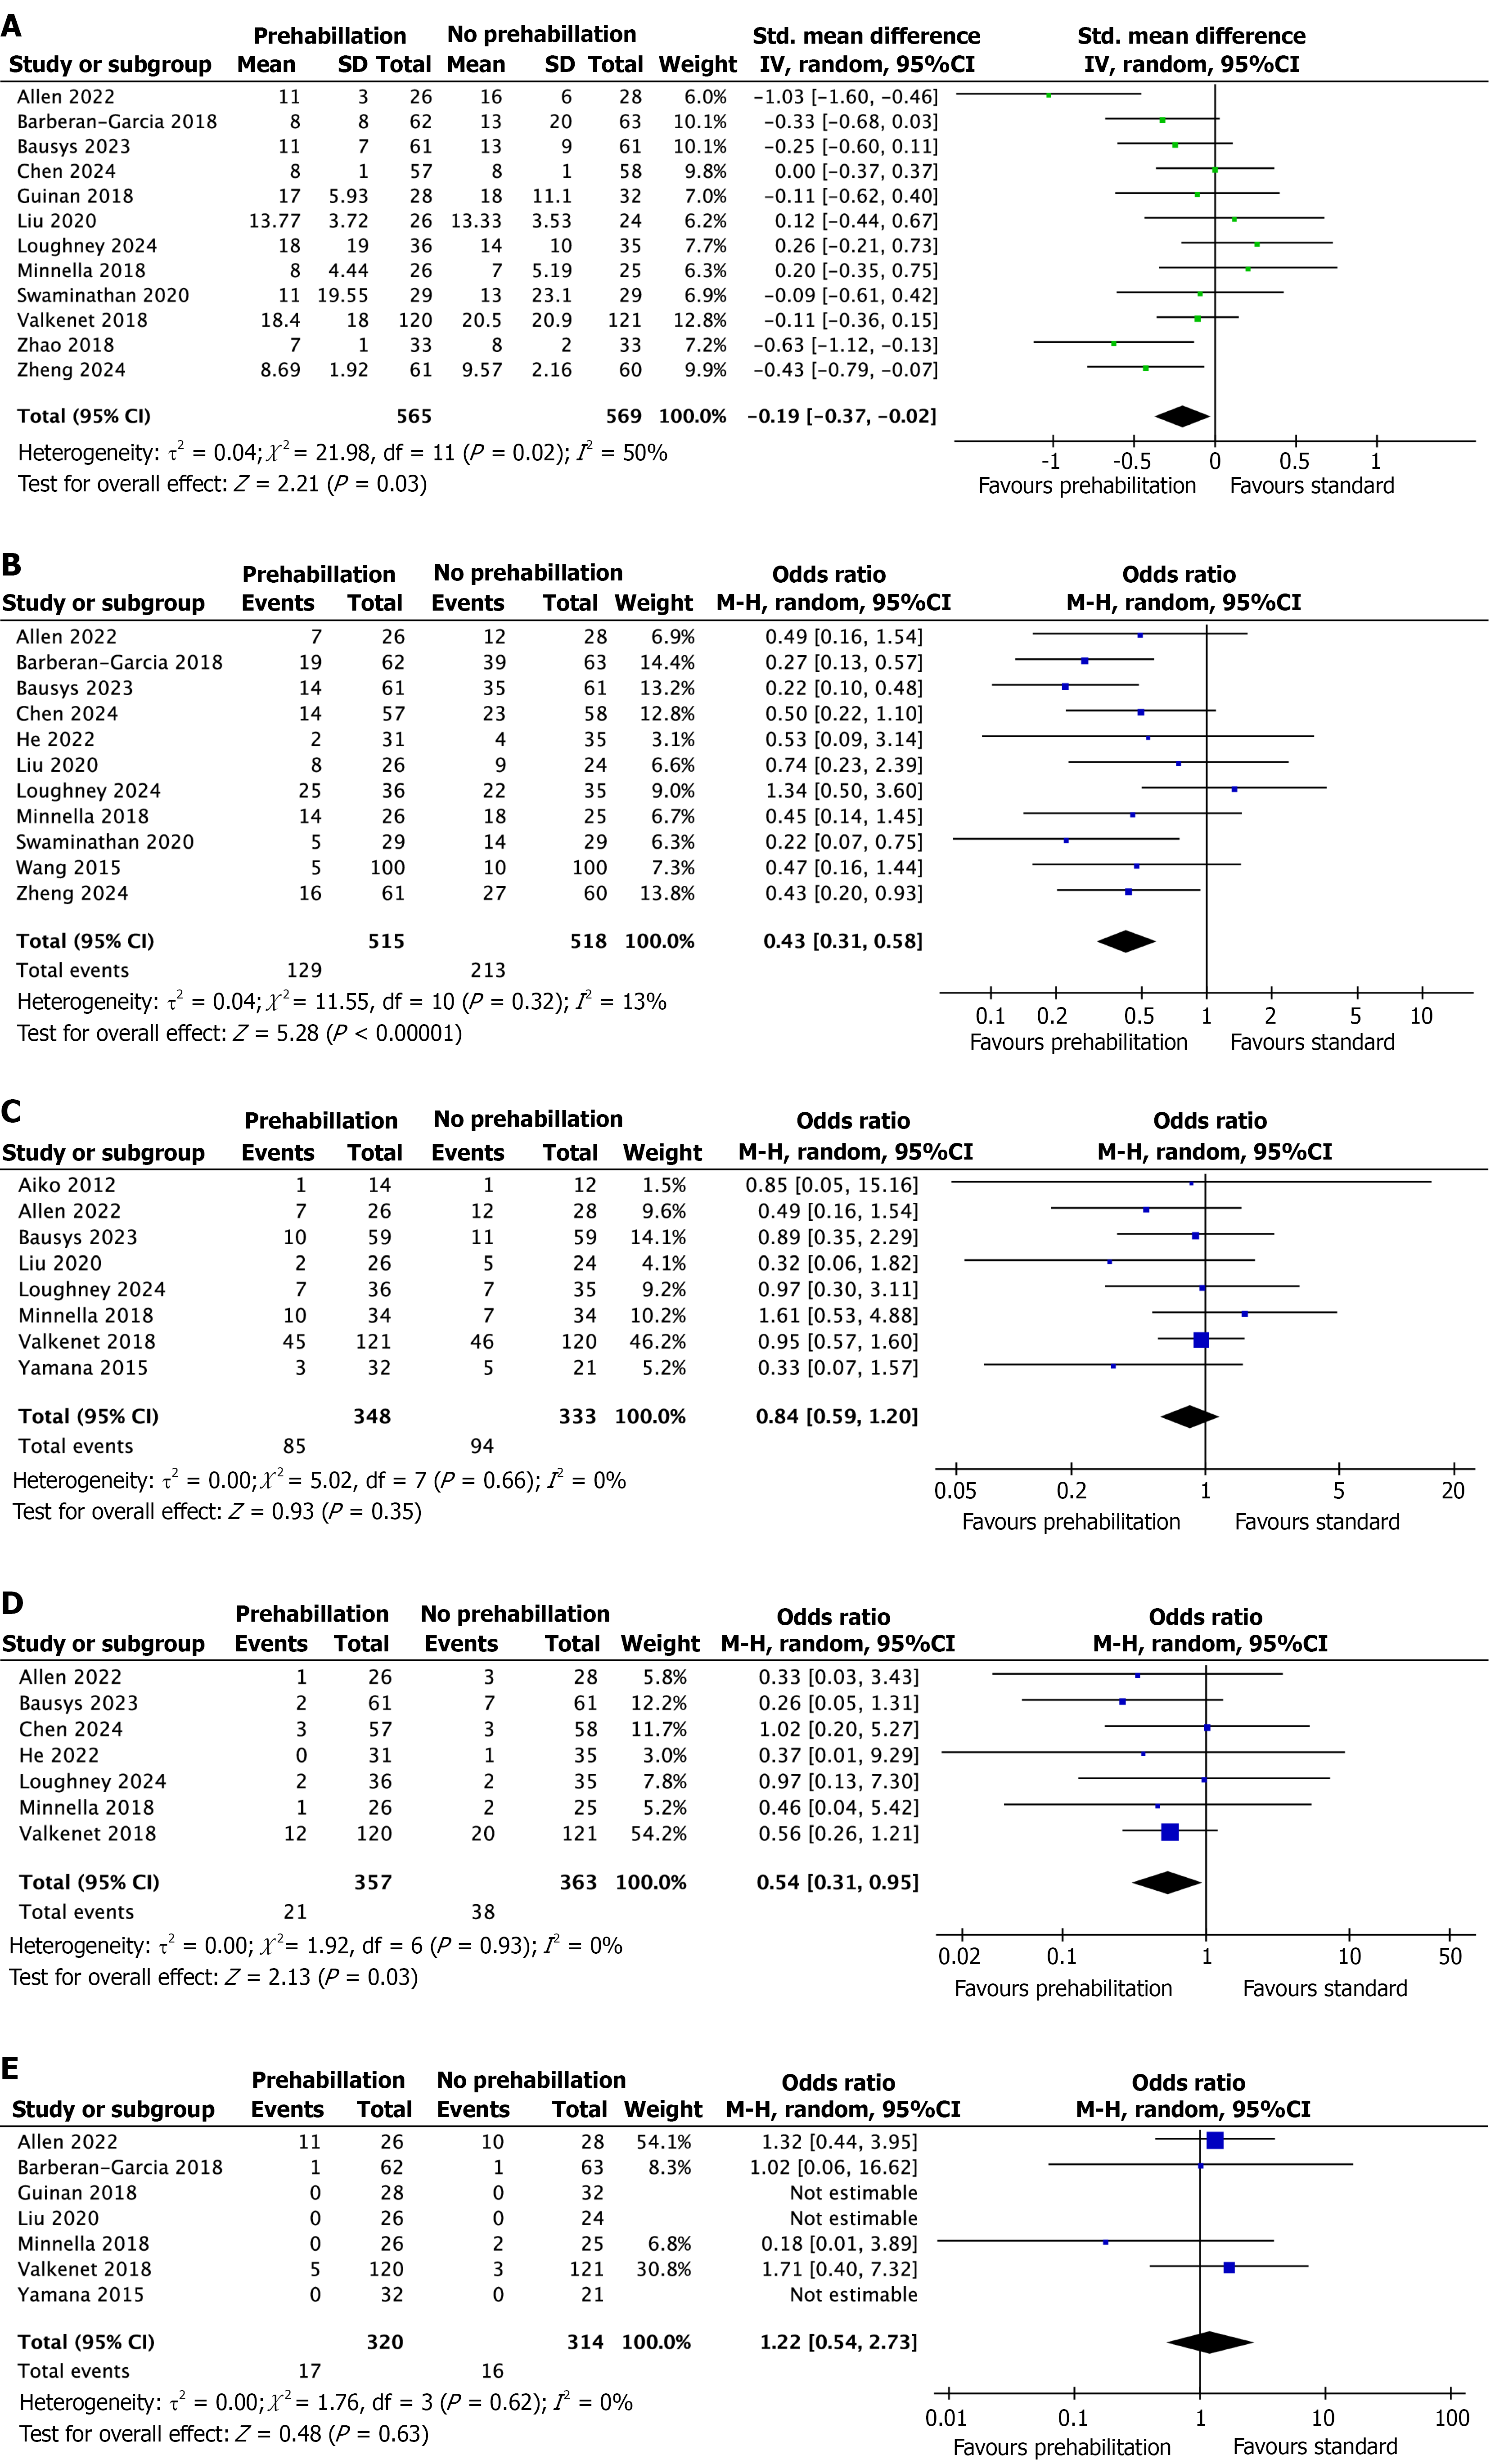
Figure 3 Forest plot.
A: Forest plot showing length of hospital stay represented in standardised mean difference with 95%CI; B: Forest plot showing total postoperative complications represented in odds ratio with 95%CI; C: Forest plot showing severe postoperative complications represented in risk ratio with 95%CI; D: Forest plot showing hospital readmission represented in odds ratio with 95%CI; E: Forest plot showing mortality represented in odds ratio with 95%CI.
- Citation: Lubbad O, Mahmood WU, Shafique S, Singh KK, Khera G, Sajid MS. Effect of prehabilitation in patients undergoing gastric or oesophageal cancer resections: A systematic review and meta-analysis. World J Gastrointest Endosc 2025; 17(9): 109033
- URL: https://www.wjgnet.com/1948-5190/full/v17/i9/109033.htm
- DOI: https://dx.doi.org/10.4253/wjge.v17.i9.109033


