
















Published online May 27, 2026. doi: 10.4254/wjh.v18.i5.116008
Revised: December 23, 2025
Accepted: February 6, 2026
Published online: May 27, 2026
Processing time: 207 Days and 12.8 Hours
During the pathological advancement of chronic hepatitis B (CHB) toward cir
To evaluate the diagnostic performance of serological indicators, including the aspartate transaminase to platelet ratio index (APRI), the fibrosis-4 index (FIB-4), the gamma-glutamyl transferase to platelet ratio (GPR), and the aspartate amino
For this cross-sectional investigation, 627 CHB cases were consecutively enrolled at Chengdu Public Health Clinical Medical Center during the four-year interval from December 2020 to December 2024. Extensive data collection incorporated FibroScan-derived LSM alongside four well-validated serum fibrosis indices: APRI, FIB-4, GPR, and AST/ALT. Associations between these serum-derived indices and different fibrosis stages were examined; the eff
The median age of CHB participants was 47 years, with male patients comprising 69.86% (438/627). Spearman correlation testing revealed that all non-invasive liver fibrosis assessment indices showed robust associations with FibroScan-measured LSM values and FibroScan-derived liver fibrosis staging (P < 0.001); notably, the correlation between GPR and both LSM values and fibrosis staging was the most pronounced (r = 0.609). Univariate statistical analyses revealed significant disparities across the nutritional risk subgroup, the Child-Pugh staging subgroup, and each of the assessed indices (P < 0.001). Meanwhile, multivariable regression modeling showed that the GPR exhibited the most favorable diagnostic efficacy for two fibrosis categories: “Any fibrosis (F1-F4)” and “significant fibrosis (F3-F4)”. For the GPR model, the area under the curve (AUC) values were 0.816 [95% confidence interval (CI): 0.779-0.853] and 0.871 (95%CI: 0.844-0.899), with both outcomes corresponding to P values < 0.001. Analysis of receiver operating characteristic curves demonstrated that the GPR exhibited strong performance in identifying significant fibrosis: it achieved an AUC of 0.828 (95%CI: 0.796-0.860), alongside 87.6% sensitivity and 64.4% specificity. Moreover, the FIB-4 index demonstrated robust diagnostic performance (AUC = 0.814), surpassing that of both APRI and the AST/ALT ratio.
GPR and FIB-4 function as valid serological assessment indicators for identifying liver fibrosis in patients with CHB, especially in instances of advanced fibrosis and cirrhotic stages. In clinical settings, a holistic evaluation of liver fibrosis is recommended by incorporating the patient’s gender, nutritional status, and liver functional reserve to enhance diagnostic precision.
Core Tip: This investigation was carried out in Southwest China, where the diagnostic efficacy of four non-invasive liver fibrosis scoring tools [aspartate transaminase to platelet ratio index, fibrosis-4 index (FIB-4), gamma-glutamyl transferase to platelet ratio (GPR), and aspartate aminotransferase to alanine aminotransferase ratio] was comprehensively assessed. The results indicated that GPR and FIB-4 achieved optimal diagnostic precision for detecting significant fibrosis and cirrhosis; notably, GPR demonstrated the strongest association with FibroScan-derived liver stiffness measurements. Furthermore, the study revealed that diagnostic performance is influenced by gender, nutritional status, and Child-Pugh grade. These findings indicate that incorporating GPR and FIB-4 into routine clinical assessment, along with patient-specific characteristics, can improve early screening for liver fibrosis in chronic hepatitis B.
- Citation: Wang CX, Yan P, Lan LJ, Zhao BN, Kang J, Li MQ, Liu DF. Diagnostic efficacy and influencing factors of non-invasive liver fibrosis scores in chronic hepatitis B fibrosis: Cross-sectional study. World J Hepatol 2026; 18(5): 116008
- URL: https://www.wjgnet.com/1948-5182/full/v18/i5/116008.htm
- DOI: https://dx.doi.org/10.4254/wjh.v18.i5.116008
Chronic hepatitis B (CHB) endures as a major global public health challenge[1], affecting an estimated 316 million people globally[2]. In its 2024 report, the World Health Organization notes that while hepatitis B incidence has declined, associated mortality rates have increased. Studies indicate that approximately 1.1 million deaths in 2022 were attributed to hepatitis B-related complications. China is identified as an area with a considerable disease burden, with an estimated 79.7 million cases of CHB[3]. This large infected population reflects the severe prevention and control situation in China. In contrast to China’s arduous prevention and control landscape, high-income nations have achieved remarkable progress in curbing new hepatitis B infections. They have reduced the rate of new hepatitis B infections to near zero through comprehensive interventions, including vaccination campaigns, prevention of mother-to-child transmission, and blood safety screening. The primary burden of CHB remains centered in low- and middle-income economies[2,4]. In the natural course of CHB, hepatic fibrosis constitutes a crucial transitional stage. The timely detection of this condition is essential to curbing its progression towards cirrhosis and hepatocellular carcinoma. The essence of liver fibrosis is the abnormal proliferation of fibrous connective tissue within the liver, leading to excessive deposition as part of the injury repair response. When CHB stays persistently active or undergoes repeated disease exacerbations, it can drive the onset of hepatic fibrosis. Such fibrotic changes may gradually progress to decompensated cirrhosis, liver failure, or hepatocellular carcinoma, creating a substantial risk to patients’ survival and overall quality of life[5]. Multiple meta-analyses indicate that the prevalence of hepatic steatosis (an important risk factor for liver fibrosis) among global CHB patients is 29.6% to 34.93%, with approximately 14% to 29% having significant liver fibrosis (F ≥ 2)[2]. Furthermore, it is reported that the yearly progression rate to cirrhosis in untreated CHB individuals varies between 2% and 10%[1]. Consequently, the implementation of early and regular surveillance of liver fibrosis in this population is of substantial clinical imp
For staging hepatic fibrosis, liver biopsy has long been recognized as the accepted gold standard. Frequently applied in routine clinical settings, the METAVIR scoring system categorizes hepatic fibrosis into five distinct clinical stages: F0 (no fibrosis), F1 (mild fibrosis), F2 (moderate fibrosis), F3 (advanced fibrosis), and F4 (cirrhosis). Even so, this invasive intervention poses risks of adverse events such as localized discomfort, bleeding episodes, and infectious complications, and in rare, severe scenarios, it may even lead to life-threatening consequences. Its low patient acceptability makes it unsuitable for long-term follow-up[6]. Due to these limitations, there is a growing clinical demand for non-invasive dia
Although non-invasive diagnostic technologies for liver fibrosis have made significant progress, there remain many gaps in research. For example, different non-invasive indicators exhibit varying diagnostic efficacy across CHB popu
This study was designed as a retrospective cross-sectional investigation. The research subjects were selected from inpatients with CHB documented in the inpatient medical record system of Chengdu Public Health Clinical Medical Center. A total of 8675 CHB inpatients were admitted to the center between December 2020 and December 2024. Using a convenience sampling strategy, eligible participants were screened, with the following exclusion criteria applied: 64 cases aged under 18 years, 7626 cases with incomplete demographic or clinical data (including those who did not complete liver transient elastography or relevant laboratory tests), and 358 cases complicated by other chronic liver diseases. Finally, 627 CHB inpatients with complete datasets were enrolled in this study (Figure 1). The present study was con

To attain the precision required for assessing the area under the curve (AUC) the receiver operating characteristic (ROC) curve, the study’s sample size was calculated. We utilized the Binormal model-based formula proposed by Hajian-Tilaki[15] for this purpose. The calculation parameters were specified as follows: A two-sided α of 0.05, a statistical power (1-β) of 80%, a target AUC value of 0.801 (based on GPR’s AUC for detecting significant fibrosis)[11], and a margin of error (d) set at 0.07, which corresponds to the maximum allowable half-width of the 95% confidence interval (CI) around the estimated AUC. This calculation yielded a minimum required sample size of 256 participants. The calculation formula is as follows:
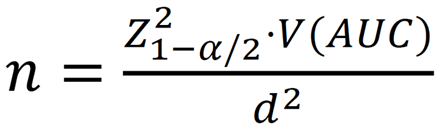 .
.
Inclusion criteria: Age of 18 years or older; having undergone both liver transient elastography (FibroScan) and relevant laboratory assessments.
Exclusion criteria were outlined as follows: Individuals with missing demographic or clinical data were excluded from the study. Moreover, patients with a diagnosis of any other chronic liver conditions, such as non-alcoholic fatty liver disease, alcoholic liver disease, autoimmune hepatitis, hepatitis C, and hepatitis D, were excluded as well.
CHB was defined based on the 2022 guidelines for the prevention and treatment of CHB[1]. This guideline describes the disease as persistent positivity for hepatitis B surface antigen or hepatitis B virus deoxyribonucleic acid for at least 6 months.
Clinical, laboratory, and imaging datasets were extracted from 627 CHB individuals admitted to Chengdu Public Health Clinical Medical Center from December 2020 to December 2024. This included demographic information, laboratory test results, and FibroScan findings. Healthcare professionals used the Nutritional Risk Screening 2002 (NRS2002) to assess patients’ nutritional risk and employed the Child-Pugh grading system to evaluate liver function in CHB patients during hospitalization. All research data were exported from the hospitalized electronic medical record system, repeatedly checked, logically verified, and then locked. Only complete and consistent case data were retained for analysis. All detection indicators were completed within 1 week of the patients’ admission to the hospital, and all calculated indicators were computed using internationally recognized formulas. The research team strictly ensured the completeness, acc
LSM: Examinations were performed using FibroScan® 502 (Echosens, Paris, France) after an overnight fast or at least 2 hours after food intake. Operators with medical backgrounds at our center conducted all FibroScan examinations independently. These operators had received training from Echosens and obtained certificates, each with several years of operational experience. LSM results are reported in kilopascals (kPa). Fibrosis staging was assigned by cross-referencing the measured liver stiffness values with reference criteria for histopathological staging, specifically[16,17]: F0 (no fibrosis): < 7.3 kPa; F1 (mild fibrosis): 7.3-9.7 kPa; F2 (moderate fibrosis): 9.7-12.4 kPa; F3 (advanced fibrosis): 12.4-17.5 kPa; F4 (cirrhosis): > 17.5 kPa.
We collected laboratory test data of patients during hospitalization (within 7 days after admission), including ALT with a reference range of 0-37 U/L; AST with a reference range of 0-37 U/L; γ-glutamyl transferase (GGT) with a refe
To assess nutritional risk among the included patients during their hospital stay, the Nutritional Risk Screening 2002 (NRS2002) was employed. This instrument is specifically designed to detect malnutrition risk in hospitalized populations. The NRS2002 score incorporates three domains: (1) Nutritional status impairment: A score of 1 point is assigned for weight loss > 5% within the preceding 3 months or reduced dietary intake (25%-50%) over one week; 2 points for weight loss > 5% in the past 2 months or 50%-75% reduced intake in one week; and 3 points for weight loss > 5% in the past month, 75%-100% reduced weekly intake, or a body mass index (BMI) < 18.5 kg/m2. In scenarios where BMI measu
During their hospital stay, we conducted Child-Pugh grading assessments for enrolled patients. Used clinically to gauge liver reserve capacity in individuals with hepatic pathology, the Child-Pugh scoring system encompasses five clinical and biochemical parameters: Hepatic encephalopathy (classified by severity): A score of 1 is assigned for the absence of episodes, a score of 2 corresponds to grades 1 through 2, and a score of 3 applies to grades 3 to 4; for ascites: A score of 1 is given when there is no fluid buildup, a score of 2 is designated for mild ascites, and a score of 3 is assigned to moderate or severe ascites; total serum bilirubin (measured in μmol/L): 1 point for < 34, 2 points for 34-51, and 3 points for > 51; serum albumin (g/L): 1 point for > 35, 2 points for 28-35, and 3 points for < 28; prothrombin time prolongation (seconds): 1 point for 1-3 seconds, 2 points for 4-6 seconds, and 3 points for > 6 seconds. These individual scores are summed to categorize patients into three Child-Pugh classes: Class A (total score 5-6) reflects mild hepatic dysfunction; class B (7-9 points) corresponds to moderate impairment; and class C (10-15 points) signals severe liver function com
All data analyses were conducted using R software (version 4.5.1). Categorical variables were reported as frequencies and percentages. Normality of continuous variables was evaluated using the Shapiro-Wilk and Kolmogorov-Smirnov tests; as these variables failed to exhibit normality, we presented them as median. We conducted a Spearman correlation analysis and visualized the associations between various liver fibrosis indicators and FibroScan (transient elastography) results using heatmaps, enabling intuitive interpretation of the relationships. To compare continuous variables between two groups (e.g., indicators between gender and nutritional risk groups), the Wilcoxon rank-sum test was used. For comparisons across three or more groups, the Kruskal-Wallis test was used; if a significant overall difference was detected, Dunn’s post hoc test was subsequently performed to assess pairwise comparisons (e.g., indicator variations across different Child-Pugh grades or FibroScan stages). Multivariate logistic regression models were constructed to assess the independent effects of individual variables on liver fibrosis-related outcomes; results were presented as adjusted odds ratios with 95%CI. ROC curve analysis was also conducted to assess the diagnostic performance of each index. Statistical significance was determined as a P value less than 0.05.
A cohort of 627 CHB patients with complete case data was included in the present study, with males accounting for 69.86% (438/627). The median age was 47.00 (34.50, 55.00) years. Most patients exhibited significant liver injury, with a median ALT of 114.00 (39.00, 408.50) U/L, AST of 77.00 (36.00, 235.50) U/L, GGT of 57.00 (28.00, 119.00) U/L, PLT of 130.00 (87.00, 173.00) × 109/L, and total bilirubin of 17.20 (11.00, 34.75) μmol/L. Liver fibrosis-related indicators showed: APRI of 1.92 (0.83, 5.42), GPR of 0.99 (0.44, 2.29), FIB-4 of 2.94 (1.49, 6.57), and AST/ALT ratio of 0.72 (0.50, 1.13). Nutritional risk was identified in 138 patients (22.01%). 30% of the enrolled patients were categorized as Child-Pugh grade B or C. FibroScan results showed: F0 (no fibrosis) in 136 patients (21.69%), F1 (mild fibrosis) in 105 patients (16.75%), F2 (moderate fibrosis) in 79 patients (12.6%), F3 (advanced fibrosis) in 117 patients (18.66%), and F4 (cirrhosis) in 190 patients (30.3%) (Table 1).
| Variable | Values |
| Age (years) | 47.00 (34.50-55.00) |
| Sex | |
| Male | 438 (69.86) |
| Female | 189 (30.14) |
| ALT (U/L) | 114.00 (39.00-408.50) |
| AST (U/L) | 77.00 (36.00-235.50) |
| GGT (U/L) | 57.00 (28.00-119.00) |
| PLT (109/L) | 130.00 (87.00-173.00) |
| TBIL (μmol/L) | 17.20 (11.00-34.75) |
| ALB (g/L) | 38.20 (34.35-41.85) |
| TP (g/L) | 67.90 (63.70-72.30) |
| APRI | 1.92 (0.83-5.42) |
| GPR | 0.99 (0.44-2.29) |
| FIB-4 | 2.94 (1.49-6.57) |
| AST/ALT | 0.72 (0.50-1.13) |
| NRS2002 | |
| NRS2002 < 3 | 489 (77.9) |
| NRS2002 ≥ 3 | 138 (22.01) |
| Child-Pugh | |
| A | 441 (70.33) |
| B | 108 (17.22) |
| C | 78 (12.44) |
| FibroScan | |
| F0 | 136 (21.69) |
| F1 | 105 (16.75) |
| F2 | 79 (12.6) |
| F3 | 117 (18.66) |
| F4 | 190 (30.3) |
The AST/ALT, APRI, GPR, and FIB-4 all showed good correlations with FibroScan-measured LSM (P < 0.001), with GPR and LSM having the strongest correlation (r = 0.609), and AST/ALT and LSM having the weakest correlation (r = 0.175) (Table 2). When examining correlations between the indicators, APRI and FIB-4 exhibited a strong positive association (r = 0.734), GPR and FIB-4 demonstrated a strong positive correlation (r = 0.639), FIB-4 and LSM exhibited a moderate positive correlation (r = 0.553), and APRI and LSM likewise exhibited a moderate positive correlation (r = 0.518) (Figure 2).

| First variable | Second variable | Correlation coefficient | P value |
| LSM | AST/ALT | 0.175 | < 0.001 |
| APRI | 0.518 | < 0.001 | |
| GPR | 0.609 | < 0.001 | |
| FIB-4 | 0.553 | < 0.001 |
When grouped by gender and compared across various non-invasive liver fibrosis indicators, the results showed significant differences in LSM, GPR, and the AST/ALT between genders. Regarding LSM staging, the proportion of male patients with cirrhosis (F4) was notably higher than that of females (35.6%; 18.0%), whereas the proportion with no fibrosis (F0) was markedly lower in males than in females (17.1%; 32.3%). GPR was notably higher in males relative to females (1.14; 0.67, P < 0.001), while the AST/ALT was higher in females (0.78; 0.68, P < 0.001). APRI and FIB-4 showed no statistically significant differences between genders (Table 3).
| Indices | Female (n = 189) | Male (n = 438) | P value |
| LSM | |||
| F0 | 61 (32.3) | 75 (17.1) | < 0.001 |
| F1 | 33 (17.5) | 72 (16.4) | |
| F2 | 23 (12.2) | 56 (12.8) | |
| F3 | 38 (20.1) | 79 (18) | |
| F4 | 34 (18) | 156 (35.6) | |
| APRI | 1.67 (0.80-4.24) | 2.03 (0.85-5.95) | 0.208 |
| GPR | 0.67 (0.28-1.51) | 1.14 (0.53-2.65) | < 0.001 |
| FIB-4 | 2.88 (1.32-6.61) | 2.96 (1.53-6.48) | 0.853 |
| AST/ALT | 0.78 (0.60-1.28) | 0.68 (0.48-1.05) | < 0.001 |
Using NRS2002 scoring results, the 627 enrolled patients were categorized into a group without nutritional risk (NRS2002 score < 3, n = 489) and a group with nutritional risk (NRS2002 score ≥ 3, n = 138). Differences in various non-invasive liver fibrosis indicators between the two groups were compared. It can be observed that LSM, APRI, GPR, FIB-4, and AST/ALT all showed significant differences between the different nutritional risk groups (Table 4). According to FibroScan liver stiffness staging, the proportion of patients with cirrhotic changes (F4 stage) was markedly higher in the nutritional risk group than in the non-nutritional risk group (62.3% vs 21.3%). In contrast, the shares of patients with no fibrosis (F0) or mild fibrosis (F1) were substantially smaller in the nutritional risk group (F0: 4.3% vs 26.6%; F1: 5.8% vs 19.8%) (Table 4). Meanwhile, serum indices including APRI, GPR, FIB-4, and the AST/ALT also reflected more advanced hepatic fibrosis in the nutritional risk group.
| Indices | NRS2002 < 3 (n = 489) | NRS2002 ≥ 3 (n = 138) | P value |
| LSM | |||
| F0 | 130 (26.6) | 6 (4.3) | < 0.001 |
| F1 | 97 (19.8) | 8 (5.8) | |
| F2 | 67 (13.7) | 12 (8.7) | |
| F3 | 91 (18.6) | 26 (18.8) | |
| F4 | 104 (21.3) | 86 (62.3) | |
| APRI | 1.50 (0.70-3.60) | 4.95 (2.38-10.90) | < 0.001 |
| GPR | 0.79 (0.37-1.90) | 1.84 (0.97-3.26) | < 0.001 |
| FIB-4 | 2.38 (1.27-4.80) | 6.78 (3.80-10.84) | < 0.001 |
| AST/ALT | 0.67 (0.48-1.00) | 1.02 (0.61-1.54) | < 0.001 |
Using the Child-Pugh classification system, enrolled patients were categorized into three subgroups: Grade A (n = 441), grade B (n = 108), and grade C (n = 78). We compared variations in non-invasive hepatic fibrosis indices across these three subgroups. Our analysis revealed that LSM, APRI, GPR, FIB-4, and AST/ALT exhibit statistically significant disparities across distinct liver function classification subgroups (P value < 0.001) (Table 5). Notably, as LSM-based hepatic fibrosis staging advances from Child-Pugh grade A to grade C, the prevalence of cirrhosis (F4 stage) rises markedly (grade A: 14.5%; grade B: 52.8%; grade C: 88.5%), and all four serological hepatic fibrosis indices also increase significantly as the Child-Pugh classification deteriorates.
| Indices | A grade (n = 441) | B grade (n = 108) | C grade (n = 78) | P value |
| LSM | ||||
| F0 | 131 (29.7) | 4 (3.7) | 1 (1.3) | < 0.001 |
| F1 | 98 (22.2) | 6 (5.6) | 1 (1.3) | |
| F2 | 65 (14.7) | 12 (11.1) | 2 (2.6) | |
| F3 | 83 (18.8) | 29 (26.9) | 5 (6.4) | |
| F4 | 64 (14.5) | 57 (52.8) | 69 (88.5) | |
| APRI | 1.33 (0.63-2.82) | 3.19 (1.59-10.08) | 8.23 (4.29-18.95) | < 0.001 |
| GPR | 0.71 (0.32-1.69) | 2.19 (0.94-4.56) | 1.86 (1.06-3.25) | < 0.001 |
| FIB-4 | 2.17 (1.23-3.93) | 6.03 (3.47-9.22) | 8.70 (5.90-16.24) | < 0.001 |
| AST/ALT | 0.67 (0.49-0.96) | 0.94 (0.56-1.36) | 1.10 (0.68-1.61) | < 0.001 |
Using FibroScan-assessed fibrosis stages determined by LSM, statistically significant disparities were detected in the AST/ALT, APRI, FIB-4, and GPR across patients with distinct LSM-defined fibrosis stages (P value < 0.001) (Table 6).
| LSM | APRI | FIB-4 | AST/ALT | GPR |
| F0 | 0.835 (0.500-1.672) | 1.690 (0.992-2.473) | 0.670 (0.487-1.008) | 0.355 (0.217-0.653) |
| F1 | 1.080 (0.500-2.110) | 1.600 (0.990-2.950) | 0.640 (0.490-0.950) | 0.510 (0.250-1.030) |
| F2 | 1.500 (0.625-3.980) | 2.270 (1.380-3.655) | 0.630 (0.465-0.925) | 0.830 (0.455-1.710) |
| F3 | 2.150 (1.270-5.860) | 4.690 (2.500-7.960) | 0.830 (0.570-1.160) | 1.600 (0.820-2.590) |
| F4 | 5.295 (2.212-11.165) | 6.320 (3.513-10.688) | 0.880 (0.540-1.333) | 2.210 (1.132-3.980) |
| P value | < 0.001 | < 0.001 | < 0.001 | < 0.001 |
Findings from post-hoc analyses revealed that the diagnostic discriminatory performance of APRI, FIB-4, AST/ALT ratio, and GPR varied across distinct LSM-based hepatic fibrosis grades (Table 7). Notably, GPR and FIB-4 exhibited the strongest performance, demonstrating statistically significant distinctions not only in differentiating between non-significant/mild fibrosis (stages F0-F2) and moderate/advanced fibrosis (stages F3-F4), but also in differentiating various non-consecutive fibrosis stages (e.g., F0 vs F3, F1 vs F4) with statistical significance. APRI was mainly effective in distinguishing between no fibrosis (F0) and cirrhosis (F4), as well as between mild (F1) or significant (F2) fibrosis and cirrhosis (F4). The AST/ALT had the weakest discriminative ability, showing significance only when comparing early fibrosis stages with extreme cirrhosis stages.
| Analytical index | Comparison group | P value |
| APRI | F0-F1 | 1.000 |
| APRI | F0-F2 | < 0.01b |
| APRI | F1-F2 | 0.264 |
| APRI | F0-F3 | < 0.001a |
| APRI | F1-F3 | < 0.001a |
| APRI | F2-F3 | 0.137 |
| APRI | F0-F4 | < 0.001a |
| APRI | F1-F4 | < 0.001a |
| APRI | F2-F4 | < 0.001a |
| APRI | F3-F4 | < 0.001a |
| FIB-4 | F0-F1 | 1.000 |
| FIB-4 | F0-F2 | < 0.05c |
| FIB-4 | F1-F2 | 0.137 |
| FIB-4 | F0-F3 | < 0.001a |
| FIB-4 | F1-F3 | < 0.001a |
| FIB-4 | F2-F3 | < 0.001a |
| FIB-4 | F0-F4 | < 0.001a |
| FIB-4 | F1-F4 | < 0.001a |
| FIB-4 | F2-F4 | < 0.001a |
| FIB-4 | F3-F4 | 0.082 |
| AST/ALT | F0-F1 | 1.000 |
| AST/ALT | F0-F2 | 1.000 |
| AST/ALT | F1-F2 | 1.000 |
| AST/ALT | F0-F3 | 0.164 |
| AST/ALT | F1-F3 | < 0.05c |
| AST/ALT | F2-F3 | 0.090 |
| AST/ALT | F0-F4 | < 0.01b |
| AST/ALT | F1-F4 | < 0.01b |
| AST/ALT | F2-F4 | < 0.01b |
| AST/ALT | F3-F4 | 1.0000 |
| GPR | F0-F1 | 0.122 |
| GPR | F0-F2 | < 0.001a |
| GPR | F1-F2 | < 0.05c |
| GPR | F0-F3 | < 0.001a |
| GPR | F1-F3 | < 0.001a |
| GPR | F2-F3 | 0.009b |
| GPR | F0-F4 | < 0.001a |
| GPR | F1-F4 | < 0.001a |
| GPR | F2-F4 | < 0.001a |
| GPR | F3-F4 | 0.115 |
Results from multivariable logistic regression analyses revealed that, in both the assessment of any fibrosis (comparing stages F1-F4 to F0) and significant fibrosis (comparing stages F3-F4 to F0-F2), the GPR model exhibited the strongest performance. It achieved corresponding AUC values of 0.816 (95%CI: 0.779-0.853) and 0.871 (95%CI: 0.844-0.899); both outcomes were statistically significant (P value < 0.001). The FIB-4 model showed the next best diagnostic efficacy, with AUCs of 0.791 (0.750-0.831) and 0.825 (0.793-0.857), with P values of (P < 0.001, 0.002), respectively. The APRI model and AST/ALT model showed relatively weaker diagnostic performance (some models were not statistically significant). Child-Pugh classification (Grade B/C vs Grade A) and male gender were significant predictors, while nutritional risk showed no statistical significance in all models (Tables 8 and 9).
| Model | Predictor variable | AOR (95%CI) | P value | Model AUC |
| APRI | The model itself | 1.072 (1.018-1.145) | 0.021 | 0.777 (0.736-0.818) |
| Age Q2 (vs Q1) | 1.071 (0.630-1.819) | 0.8 | ||
| Age Q3 (vs Q1) | 1.495 (0.841-2.686) | 0.174 | ||
| Age Q4 (vs Q1) | 1.783 (0.971-3.343) | 0.066 | ||
| Male (vs female) | 2.096 (1.373-3.199) | < 0.001 | ||
| Nutritional risk (yes vs none) | 2.049 (0.835-5.910) | 0.144 | ||
| Child-Pugh B (vs A) | 6.455 (2.507-22.031) | < 0.001 | ||
| Child-Pugh C (vs A) | 9.821 (1.691-187.753) | 0.036 | ||
| GPR | The model itself | 1.58 (1.282-2.017) | < 0.001 | 0.816 (0.779-0.853) |
| Age Q2 (vs Q1) | 0.981 (0.574-1.676) | 0.945 | ||
| Age Q3 (vs Q1) | 1.324 (0.741-2.388) | 0.207 | ||
| Age Q4 (vs Q1) | 1.492 (0.807-2.811) | 0.346 | ||
| Male (vs female) | 1.728 (1.120-2.663) | 0.013 | ||
| Nutritional risk (yes vs none) | 2.087 (0.852-6.006) | 0.133 | ||
| Child-Pugh B (vs A) | 5.596 (2.186-19.007) | 0.001 | ||
| Child-Pugh C (vs A) | 12.127 (2.125-230.362) | 0.024 | ||
| FIB-4 | The model itself | 1.193 (1.086-1.329) | < 0.001 | 0.791 (0.750-0.831) |
| Age Q2 (vs Q1) | 0.899 (0.526-1.534) | 0.697 | ||
| Age Q3 (vs Q1) | 0.99 (0.543-1.818) | 0.975 | ||
| Age Q4 (vs Q1) | 0.957 (0.485-1.907) | 0.899 | ||
| Male (vs female) | 2.218 (1.446-3.408) | < 0.001 | ||
| Nutritional risk (yes vs none) | 1.971 (0.799-5.706) | 0.169 | ||
| Child-Pugh B (vs A) | 5.212 (2.011-17.850) | 0.002 | ||
| Child-Pugh C (vs A) | 7.041 (1.192-135.262) | 0.074 | ||
| AST/ALT | The model itself | 0.972 (0.623-1.593) | 0.906 | 0.745 (0.703-0.787) |
| Age Q2 (vs Q1) | 1.071 (0.631-1.818) | 0.799 | ||
| Age Q3 (vs Q1) | 1.393 (0.770-2.546) | 0.275 | ||
| Age Q4 (vs Q1) | 1.77 (0.934-3.419) | 0.084 | ||
| Male (vs female) | 2.106 (1.378-3.221) | < 0.001 | ||
| Nutritional risk (yes vs none) | 2.186 (0.902-6.253) | 0.108 | ||
| Child-Pugh B (vs A) | 8.232 (3.248-27.872) | < 0.0001 | ||
| Child-Pugh C (vs A) | 15.884 (2.800-301.739) | 0.011 |
| Model | Predictor variable | AOR (95%CI) | P value | Model AUC |
| APRI | Model itself | 1.011 (0.995-1.036) | 0.26 | 0.800 (0.766-0.834) |
| Age Q2 (vs Q1) | 1.291 (0.780-2.143) | 0.322 | ||
| Age Q3 (vs Q1) | 1.526 (0.903-2.587) | 0.115 | ||
| Age Q4 (vs Q1) | 2.464 (1.445-4.241) | 0.001 | ||
| Male (vs female) | 1.746 (1.178-2.666) | 0.006 | ||
| Nutritional risk (yes vs none) | 1.363 (0.737-2.517) | 0.295 | ||
| Child-Pugh B (vs A) | 6.419 (3.768-11.310) | < 0.001 | ||
| Child-Pugh C (vs A) | 23.951 (8.361-87.708) | < 0.001 | ||
| GPR | Model itself | 1.551 (1.350-1.806) | < 0.001 | 0.871 (0.844-0.899) |
| Age Q2 (vs Q1) | 1.16 (0.688-1.959) | 0.578 | ||
| Age Q3 (vs Q1) | 1.356 (0.786-2.345) | 0.274 | ||
| Age Q4 (vs Q1) | 2.028 (1.158-3.573) | 0.014 | ||
| Male (vs female) | 1.379 (0.901-2.124) | 0.141 | ||
| Nutritional risk (yes vs none) | 1.29 (0.673-2.454) | 0.438 | ||
| Child-Pugh B (vs A) | 4.728 (2.718-8.467) | < 0.001 | ||
| Child-Pugh C (vs A) | 22.635 (7.834-83.517) | < 0.001 | ||
| FIB-4 | Model itself | 1.085 (1.035-1.146) | 0.002 | 0.825 (0.793-0.857) |
| Age Q2 (vs Q1) | 1.142 (0.686-1.904) | 0.61 | ||
| Age Q3 (vs Q1) | 1.215 (0.706-2.091) | 0.481 | ||
| Age Q4 (vs Q1) | 1.737 (0.976-3.100) | 0.061 | ||
| Male (vs female) | 1.847 (1.224-2.813) | 0.004 | ||
| Nutritional risk (yes vs none) | 1.367 (0.736-2.534) | 0.32 | ||
| Child-Pugh B (vs A) | 5.188 (2.998-9.264) | < 0.001 | ||
| Child-Pugh C (vs A) | 16.712 (5.779-62.87) | < 0.001 | ||
| AST/ALT | The model itself | 1.344 (0.915-2.021) | 0.144 | 0.787 (0.751-0.822) |
| Age Q2 (vs Q1) | 1.241 (0.748-2.067) | 0.404 | ||
| Age Q3 (vs Q1) | 1.343 (0.778-2.319) | 0.290 | ||
| Age Q4 (vs Q1) | 2.162 (1.233-3.817) | 0.007 | ||
| Male (vs female) | 1.865 (1.238-2.838) | 0.003 | ||
| Nutritional risk (yes vs none) | 1.329 (0.715-2.464) | 0.366 | ||
| Child-Pugh B (vs A) | 6.35 (3.743-11.160) | < 0.001 | ||
| Child-Pugh C (vs A) | 24.416 (8.606-88.915) | < 0.001 |
The diagnostic performance of APRI, GPR, FIB-4, and the AST/ALT in distinguishing liver fibrosis stages was evaluated using receiver operating characteristic curves (Figure 3). To identify cases of any fibrosis (comparing F1-F4 to F0), GPR exhibited the highest area under the ROC curve (AUROC) of 0.814 (95%CI: 0.774-0.853; P value < 0.001). FIB-4 and APRI exhibited moderate AUROC values of 0.743 and 0.736, respectively, whereas the AST/ALT ratio had the lowest AUROC (0.553). With a cutoff value set at 0.715, GPR attained a sensitivity of 72.3%, specificity of 79.4%, positive predictive value (PPV) of 92.7%, negative predictive value (NPV) of 44.3%, and diagnostic accuracy of 73.8% thus outperforming the remaining indices.

In distinguishing significant fibrosis (F3-F4) from milder stages (F0-F2), GPR maintained its leading performance with an AUROC of 0.828 (95%CI: 0.796-0.860; P < 0.001). FIB-4 and APRI followed with AUROCs of 0.814 and 0.776, and the AST/ALT again performed inadequately (AUROC = 0.615). At the 0.715 cutoff, GPR’s sensitivity rose to 87.6%, with corresponding specificity, PPV, and NPV of 64.4%, 70.2%, and 84.4%. Its diagnostic accuracy (75.8%) was similar to that of FIB-4 (75.9%) and higher than that of APRI (70.5%) and the AST/ALT (60.9%) (Table 10).
| Comparison | Indices | AUC (95%CI) | P value | Cut-off | Sensitivity (%) | Specificity (%) | PPV (%) | NPV (%) | DA (%) |
| F0 and F1-F4 | APRI | 0.736 (0.69-0.781) | < 0.001 | 1.45 | 66.6 | 70.6 | 89.1 | 36.9 | 67.5 |
| GPR | 0.814 (0.774-0.853) | < 0.001 | 0.715 | 72.3 | 79.4 | 92.7 | 44.3 | 73.8 | |
| FIB-4 | 0.743 (0.699-0.786) | < 0.001 | 2.395 | 67.4 | 74.3 | 90.4 | 38.7 | 68.9 | |
| AST/ALT | 0.553 (0.5-0.606) | 0.028 | 0.825 | 43.8 | 68.4 | 83.3 | 25.2 | 49.1 | |
| F0-F2 and F3-F4 | APRI | 0.776 (0.741-0.812) | < 0.001 | 1.76 | 72.6 | 68.4 | 68.8 | 72.3 | 70.5 |
| GPR | 0.828 (0.796-0.86) | < 0.001 | 0.715 | 87.6 | 64.4 | 70.2 | 84.4 | 75.8 | |
| FIB-4 | 0.814 (0.781-0.848) | < 0.001 | 3.88 | 66.4 | 85 | 81 | 72.5 | 75.9 | |
| AST/ALT | 0.615 (0.571-0.659) | < 0.001 | 0.825 | 52.1 | 69.4 | 62 | 60.2 | 60.9 |
Among patients diagnosed with chronic hepatitis B, the present study carried out a thorough evaluation of the diagnostic performance of four non-invasive serological indices (APRI, FIB-4, GPR, and the AST/ALT) alongside FibroScan-measured LSM in the diagnosis of liver fibrosis in patients with chronic hepatitis B. Study findings revealed that GPR exhibited the strongest diagnostic performance, achieving the highest AUC values in differentiating any fibrosis (F0 vs F1-F4) and significant fibrosis (F0-F2 vs F3-F4): 0.814 (95%CI: 0.774-0.853) and 0.828 (95%CI: 0.796-0.86), respectively. FIB-4, APRI, and the AST/ALT ranked sequentially afterward in terms of diagnostic performance. In the multivariate logistic regression results for any fibrosis (F0, F1-F4) and moderate-to-severe fibrosis (F3-F4, F0-F2), the GPR model also per
This study’s outcomes align with the results of multiple previous studies. Yan et al[9] found that GPR outperformed APRI and FIB-4 when diagnosing moderate-to-severe fibrosis among the CHB population. Similarly, a study conducted in West Africa reported that GPR was a more accurate, non-invasive indicator of liver fibrosis in CHB patients than APRI and FIB-4, with a markedly stronger predictive value for F3 and F4 stages than APRI and FIB-4. GPR's predictive performance was closest to that of FibroScan-measured LSM[7]. Compared with other non-invasive serum indices, the AST/ALT showed lower diagnostic performance, a finding consistent with previous reports[8]. This may reflect popu
GPR is composed of GGT and platelet count, of which GGT mainly reflects biliary damage and oxidative stress[20], while platelet count is related to the progression of liver fibrosis and portal hypertension[21]. Pairing GGT with platelet count can more comprehensively evaluate changes in liver fibrosis, which may explain why GPR performs more robustly in the diagnosis of liver fibrosis.
Some important clinical phenomena were also identified in this study. The FibroScan results indicated that approximately 30% of patients had developed cirrhosis (stage F4), which was highly consistent with the share of Child-Pugh class B and C patients. This finding suggests that FibroScan and Child-Pugh gradings are consistent in the evaluation of advanced liver disease, thereby providing a practical basis for the promotion of non-invasive, low-cost screening tools in primary care settings. Additionally, we observed that the percentage of male patients with cirrhosis (stage F4) was notably higher than that of female patients (35.6% vs 18.0%), and GPR and other indicators were also higher in males. These patterns may be attributed to factors including differences in sex hormones, immunomodulation, and lifestyle. Studies suggest that androgens can suppress immune function, reducing the body’s ability to clear the virus, prolonging infection, and contributing to chronic liver disease. This persistent injury to hepatocytes and stimulation of hepatic ste
Beyond this, we examined how gender, nutritional status, and Child-Pugh classification influence the performance of non-invasive diagnostic markers for liver fibrosis. Findings from univariate analysis revealed that male patients, those with nutritional risk (as defined by NRS2002 scores ≥ 3), and individuals with elevated Child-Pugh classification were closely associated with the severity of liver fibrosis. Notably, though, when we applied a multivariate logistic regression model, nutritional risk did not emerge as an independent predictor of liver fibrosis severity. This difference may be because nutritional risk does not directly cause fibrosis but rather does so indirectly through poor liver function. When nutritional risk is included in the model alongside other predictive factors, such as Child-Pugh grading, its role is not obvious. The single-factor analysis shows a higher rate of cirrhosis in the nutritional risk group (62.3% vs 21.3%). This obvious association has important clinical significance, indicating that malnutrition may affect the progression of liver fibrosis, which is consistent with the latest consensus of the American Journal of Gastroenterology[24]. We can also think in reverse: Patients with cirrhosis are more prone to malnutrition. Studies have indicated that the reduction of serum albumin concentration is one of the long-term recognized characteristics of patients with cirrhosis[25]. Cirrhosis can cause extensive loss of functional liver tissue, induce persistent inflammation, and impair albumin synthesis capacity[26]. In addition, cirrhosis is often complicated by portal hypertension, which may lead to complications such as gastrointestinal stasis and edema. This, in turn, impairs the barrier function of the gastrointestinal mucosa and reduces digestive enzyme secretion, thereby affecting the digestion and absorption of nutrients, including carbohydrates, fats, and proteins. Furthermore, ascites can compress the gastrointestinal tract in some patients, making it more difficult for them to eat. Patients with cirrhosis are in a state of chronic inflammation for a long time. Studies have shown that cirrhosis can increase levels of inflammatory factors tumor necrosis factor alpha and interleukin-6, accelerate the body’s energy metabolism, and cause the body to consume more[27,28]. The above factors together cause patients with cirrhosis to fall into the vicious circle of “reduced synthesis, impaired absorption, and increased consumption”, finally leading to malnutrition among CHB individuals. Against this backdrop, in clinical practice, individuals with cirrhosis should not only conduct routine monitoring of liver fibrosis progression, but also regularly assess nutritional status using tools such as the NRS2002. Alongside this, healthcare providers should promptly offer these patients enteral nutritional support or targeted dietary interventions. These measures are intended to break the aforementioned vicious cycle and enhance the nutritional status of affected individuals.
The advantage of this study is that it systematically investigates the impacts of gender, nutritional status, and Child-Pugh grading on the diagnostic efficacy of multiple non-invasive liver fibrosis indicators (including APRI, FIB-4, GPR, and AST/ALT), based on clinical data from Southwest China. This, in turn, lays a new foundation for personalized clinical evaluation. Additionally, through integrating multivariate regression and ROC curve analysis, this study thoroughly assesses how each marker performs diagnostically across distinct liver fibrosis stages. Thereby providing a reference for selecting efficient, practical, non-invasive screening tools in primary care settings. Nevertheless, this study has notable limitations: As a single-center cross-sectional investigation, it cannot monitor longitudinal changes in patients’ liver fibrosis status, assess fibrosis progression or regression, or easily determine the causal relationships among variables. Moreover, the study used FibroScan rather than liver biopsy to assess liver fibrosis, lacking the histopathological “gold standard” as a reference. Although liver biopsy is associated with risks such as bleeding, pain, sampling error, and low patient acceptance, some studies have indicated that FibroScan and liver biopsy yield relatively consistent results in fibrosis evaluation[29]. Other studies have shown that liver biopsy samples represent only 1/50000 of the total liver tissue, resulting in significant sampling error, whereas FibroScan has almost no sampling error[30]. Samples for this study were sourced from a clinical medical center in the southwest of China; as such, they do not capture the characteristics of the wider population across the entire country. Future research should conduct multicenter, prospective, larger-scale, and more diverse cohort studies to validate the diagnostic efficacy of GPR and FIB-4 across different regions and populations in China; it is also necessary to implement longitudinal studies to assess the predictive ability of these non-invasive hepatic fibrosis indices for the progression of fibrosis. Finally, this study did not incorporate liver biopsy as the gold standard for direct comparative analysis with non-invasive liver fibrosis indicators such as FibroScan, GPR, and FIB-4, making it impossible to further compare the consistency between non-invasive indicators and the “gold standard” diagnostic results, and thus difficult to more precisely validate the diagnostic efficacy of non-invasive indicators.
Our study results indicate that, among the CHB population in Southwestern China, the non-invasive diagnostic tools GPR and FIB-4 exhibit superior performance in evaluating liver fibrosis, particularly for initial screening of advanced fibrosis and cirrhosis. In primary care settings, GPR and FIB-4 can serve as first-line non-invasive screening tools and be integrated into routine liver disease management. Additionally, this study revealed that factors such as gender, nut
Thanks to Dr. Zhu Chen, Lin Wang, Chuang-Jie Mao and Li Wang (the First Ward, the Second Ward and the Third Ward of liver disease, Public Health Clinical Center of Chengdu).
| 1. | You H, Wang F, Li T, Xu X, Sun Y, Nan Y, Wang G, Hou J, Duan Z, Wei L, Jia J, Zhuang H; Chinese Society of Hepatology, Chinese Medical Association; Chinese Society of Infectious Diseases, Chinese Medical Association. Guidelines for the Prevention and Treatment of Chronic Hepatitis B (version 2022). J Clin Transl Hepatol. 2023;11:1425-1442. [RCA] [PubMed] [DOI] [Full Text] [Cited by in Crossref: 105] [Cited by in RCA: 173] [Article Influence: 57.7] [Reference Citation Analysis (26)] |
| 2. | GBD 2019 Hepatitis B Collaborators. Global, regional, and national burden of hepatitis B, 1990-2019: a systematic analysis for the Global Burden of Disease Study 2019. Lancet Gastroenterol Hepatol. 2022;7:796-829. [RCA] [PubMed] [DOI] [Full Text] [Cited by in Crossref: 605] [Cited by in RCA: 598] [Article Influence: 149.5] [Reference Citation Analysis (5)] |
| 3. | Zhang S, Mak LY, Yuen MF, Seto WK. Mechanisms of hepatocellular carcinoma and cirrhosis development in concurrent steatotic liver disease and chronic hepatitis B. Clin Mol Hepatol. 2025;31:S182-S195. [RCA] [PubMed] [DOI] [Full Text] [Full Text (PDF)] [Cited by in RCA: 33] [Reference Citation Analysis (4)] |
| 4. | Wong GL, Lemoine M. The 2024 updated WHO guidelines for the prevention and management of chronic hepatitis B: Main changes and potential implications for the next major liver society clinical practice guidelines. J Hepatol. 2025;82:918-925. [RCA] [PubMed] [DOI] [Full Text] [Cited by in Crossref: 48] [Cited by in RCA: 54] [Article Influence: 54.0] [Reference Citation Analysis (2)] |
| 5. | Dong AH, Wang C, Ke LQ. [Correlation between the expression of β-arrestin 2, calpain 2 and hepatic fibrosis in patients with hepatitis B]. Xuzhou Yike Daxue Xuebao. 2021;41:127-131. [DOI] [Full Text] |
| 6. | Shen PP, Sun QX. [Advances in the diagnosis of hepatic fibrosis]. Linchuang Fangshexue Zazhi. 2023;42:875-877. [DOI] [Full Text] |
| 7. | Lemoine M, Shimakawa Y, Nayagam S, Khalil M, Suso P, Lloyd J, Goldin R, Njai HF, Ndow G, Taal M, Cooke G, D'Alessandro U, Vray M, Mbaye PS, Njie R, Mallet V, Thursz M. The gamma-glutamyl transpeptidase to platelet ratio (GPR) predicts significant liver fibrosis and cirrhosis in patients with chronic HBV infection in West Africa. Gut. 2016;65:1369-1376. [RCA] [PubMed] [DOI] [Full Text] [Full Text (PDF)] [Cited by in Crossref: 311] [Cited by in RCA: 301] [Article Influence: 30.1] [Reference Citation Analysis (2)] |
| 8. | Moosavy SH, Eftekhar E, Davoodian P, Nejatizadeh A, Shadman M, Zare S, Nazarnezhad MA. AST/ALT ratio, APRI, and FIB-4 compared to FibroScan for the assessment of liver fibrosis in patients with chronic hepatitis B in Bandar Abbas, Hormozgan, Iran. BMC Gastroenterol. 2023;23:145. [RCA] [PubMed] [DOI] [Full Text] [Cited by in RCA: 16] [Reference Citation Analysis (0)] |
| 9. | Yan P, Yu X, Chen Z, Lan L, Kang J, Zhao B, Liu D. Assessing the consistency of FIB-4, APRI, and GPR in evaluating significant liver fibrosis and cirrhosis in COVID-19 patients with concurrent liver diseases. BMC Gastroenterol. 2025;25:191. [RCA] [PubMed] [DOI] [Full Text] [Full Text (PDF)] [Cited by in RCA: 4] [Reference Citation Analysis (0)] |
| 10. | Li F, Zhu GJ, Liu XX, Wang HY, Zhang X. [Diagnostic value of magnetic resonance ADC value combined with GPR model in chronic hepatitis B-related liver fibrosis]. Xuzhou Yike Daxue Xuebao. 2022;42:363-368. [DOI] [Full Text] |
| 11. | Huang R, Wang G, Tian C, Liu Y, Jia B, Wang J, Yang Y, Li Y, Sun Z, Yan X, Xia J, Xiong Y, Song P, Zhang Z, Ding W, Wu C. Gamma-glutamyl-transpeptidase to platelet ratio is not superior to APRI,FIB-4 and RPR for diagnosing liver fibrosis in CHB patients in China. Sci Rep. 2017;7:8543. [RCA] [PubMed] [DOI] [Full Text] [Full Text (PDF)] [Cited by in Crossref: 26] [Cited by in RCA: 39] [Article Influence: 4.3] [Reference Citation Analysis (2)] |
| 12. | Zeng S, Liu Z, Ke B, Zhang Y, Wang Q, Tan S. The non-invasive serum biomarkers contributes to indicate liver fibrosis staging and evaluate the progress of chronic hepatitis B. BMC Infect Dis. 2024;24:638. [RCA] [PubMed] [DOI] [Full Text] [Cited by in RCA: 6] [Reference Citation Analysis (1)] |
| 13. | Cheng DY, Li B, Ji SB, Xing HC. [Application of transient elastography in noninvasive diagnosis of liver fibrosis]. Zhongguo Ganzangbing Zazhi (Electronic Version). 2021;13:9-13. [DOI] [Full Text] |
| 14. | Ai XW, Zhang MY, Sun YM, You H. [Key recommendations in guidelines for the prevention, diagnosis, care and treatment for people with chronic hepatitis B infection released by the World Health Organization in 2024]. Linchuang Gandanbing Zazhi. 2024;40:928-933. [DOI] [Full Text] |
| 15. | Hajian-Tilaki K. Sample size estimation in diagnostic test studies of biomedical informatics. J Biomed Inform. 2014;48:193-204. [RCA] [PubMed] [DOI] [Full Text] [Cited by in Crossref: 815] [Cited by in RCA: 735] [Article Influence: 61.3] [Reference Citation Analysis (3)] |
| 16. | Lu LG, You H, Xie WF, Jia JD. [Consensus on the diagnosis and therapy of hepatic fibrosis]. Shiyong Ganzangbing Zazhi. 2019;22:793-803. [DOI] [Full Text] |
| 17. | Chinese Society of Hepatology. [Chinese guidelines on the management of liver cirrhosis]. Linchuang Gandanbing Zazhi. 2019;35:2408-2425. [DOI] [Full Text] |
| 18. | Kondrup J, Rasmussen HH, Hamberg O, Stanga Z; Ad Hoc ESPEN Working Group. Nutritional risk screening (NRS 2002): a new method based on an analysis of controlled clinical trials. Clin Nutr. 2003;22:321-336. [RCA] [PubMed] [DOI] [Full Text] [Cited by in Crossref: 2318] [Cited by in RCA: 1981] [Article Influence: 86.1] [Reference Citation Analysis (6)] |
| 19. | Anderson FH, Zeng L, Rock NR, Yoshida EM. An assessment of the clinical utility of serum ALT and AST in chronic hepatitis C. Hepatol Res. 2000;18:63-71. [RCA] [PubMed] [DOI] [Full Text] [Cited by in Crossref: 60] [Cited by in RCA: 71] [Article Influence: 2.7] [Reference Citation Analysis (0)] |
| 20. | Xing M, Gao M, Li J, Han P, Mei L, Zhao L. Characteristics of peripheral blood Gamma-glutamyl transferase in different liver diseases. Medicine (Baltimore). 2022;101:e28443. [RCA] [PubMed] [DOI] [Full Text] [Cited by in Crossref: 35] [Cited by in RCA: 31] [Article Influence: 7.8] [Reference Citation Analysis (0)] |
| 21. | Al Danaf L, Hussein Kamareddine M, Fayad E, Hussain A, Farhat S. Correlation between Fibroscan and laboratory tests in non-alcoholic fatty liver disease/non-alcoholic steatohepatitis patients for assessing liver fibrosis. World J Hepatol. 2022;14:744-753. [RCA] [PubMed] [DOI] [Full Text] [Full Text (PDF)] [Cited by in Crossref: 2] [Cited by in RCA: 7] [Article Influence: 1.8] [Reference Citation Analysis (0)] |
| 22. | Ruggieri A, Gagliardi MC, Anticoli S. Sex-Dependent Outcome of Hepatitis B and C Viruses Infections: Synergy of Sex Hormones and Immune Responses? Front Immunol. 2018;9:2302. [RCA] [PubMed] [DOI] [Full Text] [Full Text (PDF)] [Cited by in Crossref: 64] [Cited by in RCA: 131] [Article Influence: 16.4] [Reference Citation Analysis (1)] |
| 23. | Pessione F, Ramond MJ, Njapoum C, Duchatelle V, Degott C, Erlinger S, Rueff B, Valla DC, Degos F. Cigarette smoking and hepatic lesions in patients with chronic hepatitis C. Hepatology. 2001;34:121-125. [RCA] [PubMed] [DOI] [Full Text] [Cited by in Crossref: 146] [Cited by in RCA: 132] [Article Influence: 5.3] [Reference Citation Analysis (0)] |
| 24. | Singal AK, Wong RJ, Dasarathy S, Abdelmalek MF, Neuschwander-Tetri BA, Limketkai BN, Petrey J, McClain CJ. ACG Clinical Guideline: Malnutrition and Nutritional Recommendations in Liver Disease. Am J Gastroenterol. 2025;120:950-972. [RCA] [PubMed] [DOI] [Full Text] [Full Text (PDF)] [Cited by in Crossref: 40] [Cited by in RCA: 56] [Article Influence: 56.0] [Reference Citation Analysis (5)] |
| 25. | Bernardi M. Effective albumin - A novel paradigm in the management of decompensated liver cirrhosis. J Transl Int Med. 2023;11:11-14. [RCA] [PubMed] [DOI] [Full Text] [Full Text (PDF)] [Cited by in RCA: 13] [Reference Citation Analysis (2)] |
| 26. | Bernardi M, Angeli P, Claria J, Moreau R, Gines P, Jalan R, Caraceni P, Fernandez J, Gerbes AL, O'Brien AJ, Trebicka J, Thevenot T, Arroyo V. Albumin in decompensated cirrhosis: new concepts and perspectives. Gut. 2020;69:1127-1138. [RCA] [PubMed] [DOI] [Full Text] [Full Text (PDF)] [Cited by in Crossref: 293] [Cited by in RCA: 276] [Article Influence: 46.0] [Reference Citation Analysis (4)] |
| 27. | Li CD, Zhang XQ, Lei ZP, Chen QL, Chen L, Tian PF, Duan ZJ. [Clinical values of IL-1β, IL-6 and TNF-α in different clinical courses of chronic HBV infection]. Jianyan Yixue. 2021;36:790-794. [DOI] [Full Text] |
| 28. | Wang JH, Li J, Yu HW, Meng QH. [The correlation between IL-6, TNF-α and energy metabolism of patients with alcoholic liver cirrhosis]. Beijing Yixue. 2015;37:842-845. [DOI] [Full Text] |
| 29. | Mingkai L, Sizhe W, Xiaoying W, Ying L, Wu B. Diagnostic performance of elastography on liver fibrosis in antiviral treatment-naive chronic hepatitis B patients: a meta-analysis. Gastroenterol Rep (Oxf). 2022;10:goac005. [RCA] [PubMed] [DOI] [Full Text] [Full Text (PDF)] [Cited by in RCA: 12] [Reference Citation Analysis (0)] |
| 30. | Foucher J, Chanteloup E, Vergniol J, Castéra L, Le Bail B, Adhoute X, Bertet J, Couzigou P, de Lédinghen V. Diagnosis of cirrhosis by transient elastography (FibroScan): a prospective study. Gut. 2006;55:403-408. [RCA] [PubMed] [DOI] [Full Text] [Full Text (PDF)] [Cited by in Crossref: 1012] [Cited by in RCA: 965] [Article Influence: 48.3] [Reference Citation Analysis (5)] |