Yan P, Li R, Yuan XY, Wang Y, Lan LJ, Yu XP, Liu DF. Dynamic immune response and its influencing factors in COVID-19 patients with non-alcoholic fatty liver disease: A cohort study. World J Hepatol 2026; 18(2): 113004 [PMID: 41809480 DOI: 10.4254/wjh.v18.i2.113004]
Corresponding Author of This Article
Da-Feng Liu, The First Ward of Internal Medicine, Public Health Clinical Center of Chengdu, No. 377 Jingming Road, Jinjiang District, Chengdu 610060, Sichuan Province, China. ldf312@126.com
Research Domain of This Article
Gastroenterology & Hepatology
Article-Type of This Article
research-article
Open-Access Policy of This Article
This article is an open-access article which was selected by an in-house editor and fully peer-reviewed by external reviewers. It is distributed in accordance with the Creative Commons Attribution Non Commercial (CC BY-NC 4.0) license, which permits others to distribute, remix, adapt, build upon this work non-commercially, and license their derivative works on different terms, provided the original work is properly cited and the use is non-commercial. See: http://creativecommons.org/licenses/by-nc/4.0/
Baishideng Publishing Group Inc, 7041 Koll Center Parkway, Suite 160, Pleasanton, CA 94566, USA
Share the Article
Yan P, Li R, Yuan XY, Wang Y, Lan LJ, Yu XP, Liu DF. Dynamic immune response and its influencing factors in COVID-19 patients with non-alcoholic fatty liver disease: A cohort study. World J Hepatol 2026; 18(2): 113004 [PMID: 41809480 DOI: 10.4254/wjh.v18.i2.113004]
Pan Yan, School of Public Health, Chengdu Medical College, Chengdu 610500, Sichuan Province, China
Pan Yan, Rui Li, Xiao-Yan Yuan, Yong Wang, Li-Juan Lan, Da-Feng Liu, The First Ward of Internal Medicine, Public Health Clinical Center of Chengdu, Chengdu 610060, Sichuan Province, China
Xiao-Ping Yu, School of Preclinical Medicine, Chengdu University, Chengdu 610106, Sichuan Province, China
Co-corresponding authors: Xiao-Ping Yu and Da-Feng Liu.
Author contributions: Yan P and Li R contributed equally to this manuscript as co-first authors; Yan P and Liu DF designed the research study; Yu XP and Liu DF supervised the study and made equal contributions as co-corresponding authors; Yan P, Li R, Yuan XY, Wang Y, Lan LJ, Yu XP, and Liu DF acquired the data, analyzed and interpreted the data, drafted the manuscript, and provided administrative, technical, or material support. All authors approved the final manuscript.
Supported by Chengdu Science and Technology Bureau, No. 2021-YF05-00536-SN.
Institutional review board statement: This study was conducted in accordance with the ethical principles outlined in the Declaration of Helsinki. Ethical approval for this research was obtained from the Ethics Committee of the Public Health Clinical Center of Chengdu (No. PJ-K2020-26-01).
Informed consent statement: Patients were not required to give informed consent to the study because the analysis used anonymous clinical data that were obtained after each patient agreed to treatment by written consent.
Conflict-of-interest statement: All the authors report no relevant conflicts of interest for this article.
STROBE statement: The authors have read the STROBE Statement-checklist of items, and the manuscript was prepared and revised according to the STROBE Statement-checklist of items.
Data sharing statement: All data used in this study are available from the corresponding author upon reasonable request.
Corresponding author: Da-Feng Liu, The First Ward of Internal Medicine, Public Health Clinical Center of Chengdu, No. 377 Jingming Road, Jinjiang District, Chengdu 610060, Sichuan Province, China. ldf312@126.com
Received: August 12, 2025 Revised: September 25, 2025 Accepted: December 8, 2025 Published online: February 27, 2026 Processing time: 184 Days and 8.3 Hours
Abstract
BACKGROUND
Dynamic alterations in lymphocyte subsets demonstrate significant correlations with clinical disease severity in patients with coronavirus disease 2019 (COVID-19). As the most prevalent chronic liver disease globally, non-alcoholic fatty liver disease (NAFLD) exhibits distinct chronic inflammatory and immunometabolic disturbances that may substantially affect immune response patterns in COVID-19 patients. Nevertheless, the characteristics of lymphocyte subset dynamics and their clinical implications in COVID-19-NAFLD remain to be fully elucidated.
AIM
To characterize the dynamic changes in lymphocyte subsets among COVID-19 patients with NAFLD, in order to delineate their immunological profiles and inform clinical management strategies.
METHODS
The cohort study compared lymphocyte subpopulations in 858 COVID-19 patients and 670 COVID-19-NAFLD patients at admission, discharge, and 2-week/4-week post-discharge follow-ups.
RESULTS
Compared to COVID-19 patients without NAFLD, NAFLD-comorbid patients demonstrated persistently elevated CD3+CD4+ counts as well as lymphocyte counts and percentages at admission and at the 2-week and 4-week follow-ups post-discharge (all P < 0.05). Among COVID-19-NAFLD patients, those aged ≥ 60 years had significantly lower CD3+ counts, CD3+CD4+ counts, CD3+CD8+ counts, lymphocyte counts and percentages, and CD19+ counts and percentages at all assessed time points (all P < 0.05); significant liver fibrosis correlated with reduced CD3+CD4+ counts, CD3+CD8+ counts, and lymphocyte counts and percentages across all time points (all P < 0.05); multimorbidity (≥ 3 comorbidities) exacerbated immune imbalance, marked by elevated CD3+CD4+ percentages and CD56+ counts at admission, increased CD3+CD4+ counts, lymphocyte counts, and CD19+ counts and percentages at discharge, as well as sustained increases in CD3+CD4+ counts at the 2-week follow-up and higher CD3+CD4+ percentages at the 4-week post-discharge follow-up (all P < 0.05); and obesity and elevated liver enzymes were independently linked to higher CD3+CD4+ counts, CD19+ counts, and lymphocyte counts at all post-admission evaluations (from discharge through the 4-week follow-up) (all P < 0.05).
CONCLUSION
Age, liver fibrosis, comorbidities, obesity, liver enzyme abnormalities, vaccination status, low-density lipoprotein cholesterol, and hemoglobin A1c significantly modulate immune responses in COVID-19-NAFLD patients, warranting targeted clinical attention. Furthermore, patients with uncomplicated NAFLD (including lean NAFLD) also require particular clinical attention to mitigate risks of immune imbalance.
Core Tip: This study reveals that coronavirus disease 2019 patients with non-alcoholic fatty liver disease (NAFLD) exhibit prolonged immune imbalance. Key risk factors—including age ≥ 60 years, significant liver fibrosis, multimorbidity (≥ 3 conditions), obesity, elevated liver enzymes, elevated low-density lipoprotein cholesterol, and elevated hemoglobin A1c—worsen immune imbalance. Notably, even lean NAFLD patients show persistent immune disturbances. These findings highlight the need for tailored clinical monitoring in coronavirus disease 2019-NAFLD patients, particularly for older adults, those with metabolic dysfunction, or those with advanced liver disease, to mitigate long-term immunological complications.
Citation: Yan P, Li R, Yuan XY, Wang Y, Lan LJ, Yu XP, Liu DF. Dynamic immune response and its influencing factors in COVID-19 patients with non-alcoholic fatty liver disease: A cohort study. World J Hepatol 2026; 18(2): 113004
The global pandemic caused by severe acute respiratory syndrome coronavirus 2 (SARS-CoV-2) has presented a substantial threat to public health. As of April 2023, there had been over 750 million confirmed cases of coronavirus disease 2019 (COVID-19) and more than 6.8 million reported deaths[1]. Among severe cases, the mortality rate ranged from 21% to 30%[2].
Coronaviruses and hepatic injury exhibit reciprocal pathophysiological interactions. A reciprocal mechanism involves SARS-CoV-2-triggered ectopic lipid accumulation in hepatocytes. COVID-19 induces significant dyslipidemia[3], and postmortem studies revealed a high prevalence of hepatic steatosis in affected patients[4,5]. These findings suggest that preexisting steatosis likely exacerbates COVID-19-related hepatic injury. Conversely, SARS-CoV-2 infection appears to potentiate hepatic fat deposition, creating a pathologic feedback loop[6]. Multiple studies demonstrated that obesity, which is strongly associated with non-alcoholic fatty liver disease (NAFLD), significantly correlates with more severe COVID-19 progression and increased mortality[7,8]. A clear association exists between excess adiposity and susceptibility to both autoimmune disorders and infections, supporting the hypothesis of impaired and altered immune responses in overweight populations. Viral respiratory infections are also consistently more prevalent in obese individuals compared to normal-weight cohorts[9,10].
Another critical mechanism involves SARS-CoV-2-induced dysregulation of both innate and adaptive immune responses[11]. In severe COVID-19, this immune dysregulation manifests as systemic inflammatory response syndrome, characterized by a fulminant cytokine storm driven by uncontrolled activation of T-cell-mediated pathways. This immunopathological cascade precipitates multi-organ injury, with notable hepatic involvement[12]. Mechanistically, this cytokine dyshomeostasis establishes a critical pathophysiological connection between COVID-19 and metabolic dysfunction, particularly in NAFLD/metabolic dysfunction-associated fatty liver disease[13]. The cytokine storm precipitates systemic hypotension and profound tissue hypoxia. In cases complicated by acute respiratory distress syndrome, this cascade significantly aggravates impaired pulmonary oxygenation, further compromising hepatic perfusion and exacerbating pre-existing circulatory insufficiency[14,15].
The resultant shock state and hypoxia trigger a marked increase in reactive oxygen species generation, which promotes extensive oxidative damage to cellular lipids, deoxyribonucleic acid, and proteins. Critically, these oxidative metabolites directly activate hepatic stellate cells, driving extracellular matrix deposition, while simultaneously stimulating resident liver immune cells to amplify pro-inflammatory cytokine production—collectively resulting in further hepatocellular injury[14,15].
In NAFLD/non-alcoholic steatohepatitis (NASH), inflamed hepatocytes exhibit mitochondrial dysfunction[16,17], which promotes upregulation of angiotensin-converting enzyme 2 receptors and consequently exacerbates viral infectivity[18]. Concurrently, COVID-19 also directly impairs mitochondrial function, and SARS-CoV-2 binding to angiotensin-converting enzyme 2 receptors enables viral replication in hepatocytes, leading to direct liver injury[19]. Additionally, NASH is characterized by chronic low-grade inflammation[20]. NAFLD-associated impairment of hepatic innate immunity potentiates COVID-19 pathogenesis through maladaptive immune responses[21]. These mutually amplifying effects contribute to more severe clinical progression in both diseases[6]. Patients with severe COVID-19 demonstrate elevated plasma levels of inflammatory markers, including ferritin, lactate dehydrogenase, D-dimer, C-reactive protein, interleukin (IL)-2, IL-10, and most notably IL-6[22]. Mechanistically, IL-6 plays a pivotal role in initiating and propagating the cytokine storm during COVID-19[12]. Notably, chronic elevation of IL-6 has been well-established in NAFLD patients[23], suggesting a potential positive feedback loop whereby COVID-19-mediated inflammation may exacerbate NAFLD progression through persistent activation of pro-inflammatory pathways[24]. A large-scale population-based cohort study (n = 6814; cardiovascular disease-free at baseline) revealed that NAFLD patients exhibit significantly elevated circulating IL-6 levels. Notably, IL-6 emerged as the only independent biomarker for predicting subclinical cardiovascular disease (quantified by non-contrast cardiac computed tomography) in this population[23].
Postmortem hepatic biopsies from COVID-19 fatalities demonstrated marked T-cell hyperactivation and microvesicular steatosis, which strongly suggests an immune-mediated mechanism of liver injury[13]. Current research demonstrated that SARS-CoV-2 infection triggers robust adaptive immune responses in humans, including humoral immunity and antigen-specific CD4+ and CD8+ T cell responses. Peripheral lymphopenia has emerged as a consistent hallmark of SARS-CoV-2 infection and disease severity, with COVID-19 patients exhibiting significantly lower total blood lymphocyte counts—especially T cell subsets—compared to healthy controls[25].
Notably, symptomatic individuals showed more profound lymphopenia than asymptomatic carriers, while patients with radiologically confirmed pneumonia demonstrated greater lymphocyte depletion than those without pulmonary involvement[26-28]. In severe cases, both CD3+CD4+ and CD3+CD8+ counts were markedly further reduced relative to moderate cases[29-31]. In longitudinal studies, SARS-CoV-2-specific immune memory has been detected in both CD3+CD4+ counts and B cells for up to 5 months post-recovery (median approximately 3 months) among mild COVID-19 cases[32]. Importantly, lymphopenia was identified as a robust independent predictor of mortality in SARS-CoV-2 infection[33,34].
However, immunological studies investigating the interplay between COVID-19 and NAFLD remain limited. Liu et al[35] demonstrated that specific comorbidities—including cancer, chronic hepatitis B, NAFLD, and diabetes—significantly modulate immune responses in COVID-19 patients. Notably, a significant positive correlation was observed between NAFLD severity and peripheral CD3+ counts.
To elucidate the dynamic immunological characteristics and associated modulatory factors in COVID-19 patients with NAFLD, this cohort study analyzed lymphocyte subpopulations (both absolute counts and relative percentages) at multiple time points: Hospital admission, discharge, and 2-week and 4-week post-discharge follow-ups. Furthermore, we systematically evaluated the impact of these lymphocyte subsets on both the time to negative SARS-CoV-2 nucleic acid test result and clinical endpoints (clinical disease severity of COVID-19).
MATERIALS AND METHODS
Study population
This cohort study included 1528 patients admitted to the first and second hospital isolation wards of the Public Health Clinical Center of Chengdu from January 16, 2020 to September 30, 2021. The study received approval from the Ethics Committee of Public Health Clinical Center of Chengdu (No. PJ-K2020-26-01). Due to the urgent nature of evaluating an emerging infectious disease, the Ethics Commission waived the requirement for written informed consent.
Inclusion and exclusion criteria
Patients were included if they met the following inclusion criteria: (1) Age ≥ 18 years; (2) Hospitalization with COVID-19; (3) An initial positive test result for SARS-CoV-2; and (4) Evidence of liver steatosis based on abdominal ultrasound within the past 6 months, a prior clinical diagnosis of NAFLD, or a documented history of NAFLD[36]. The criteria for exclusion included: (1) Age < 18 years; (2) No COVID-19; (3) Liver conditions other than NAFLD[37]; (4) Liver decompensation; or (5) Immunosuppressive status (such as human immunodeficiency virus infection, cancer, organ transplantation, bone marrow transplantation, or use of immunosuppressive agents within the last 3 months)[37-39].
Groups
The study comprised 1528 patients. Of them, 670 patients (43.85%) with NAFLD were categorized into the COVID-19 with NAFLD group, 858 COVID-19 patients (56.15%) without NAFLD were classified into the COVID-19 group.
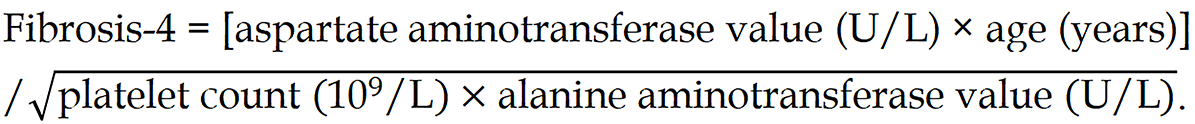
Liver fibrosis score
The fibrosis-4 scores were calculated using the following published formulas[40]:
The METAVIR liver histopathological scoring system was used as a reference: (1) Non-significant fibrosis (< F2): No fibrosis or portal tract expansion with the presence of cells with a stellate morphology, without fibrous septum formation; (2) Significant fibrosis (≥ F2): Portal area enlargement accompanied by either scattered or abundant fibrous septa; and (3) Cirrhosis (≥ F4)[41-43]. For COVID-19 patients with NAFLD, the optimal fibrosis-4 cutoff values for predicting significant fibrosis and cirrhosis were 1.3 and 2.67, respectively[44].
Diagnostic, clinical classification, and cure criteria
The diagnosis, clinical classification, and treatment criteria for COVID-19 were based on the seventh edition of the novel coronavirus pneumonia diagnosis and treatment guidelines[45]. NAFLD was diagnosed according to the 2018 updated guidelines for the Prevention and Treatment of NAFLD, defined as macrovesicular (or predominantly macrovesicular) steatosis involving > 5% of hepatocytes, which may be accompanied by mild nonspecific inflammation[46].
Data collection
Longitudinal clinical data were systematically collected and recorded at four predefined time points: Admission, discharge, and 2 weeks and 4 weeks post-discharge, including gender, age, comorbidities (including hypertension, hyperlipidemia, diabetes, and hyperuricemia), and lymphocyte subpopulations (both absolute counts and relative percentages) from 1528 subjects. The accuracy, completeness, and authenticity of the data were strictly maintained, and a comprehensive database was established.
Statistical analysis
Statistical analyses and plotting were conducted using SAS software (version9.4 for Windows). Quantitative data exhibiting a normal distribution are presented as the mean ± SD, and group comparisons were performed utilizing independent sample t-tests and analysis of variance (ANOVA). Qualitative data are expressed as percentages, with intergroup comparisons performed using the χ2 test. One-way ANOVA was used to analyze the associations between lymphocyte subsets and the time to negative SARS-CoV-2 nucleic acid test result, while the χ2 trend test was used to assess their relationships with clinical disease severity in COVID-19 patients. Pearson’s correlation analysis was utilized to evaluate the association between variables. Multivariable linear regression analysis was conducted to identify potential influencing factors of lymphocyte subsets and their relative percentages. A significance level of α = 0.05 was set for all analyses.
RESULTS
Baseline characteristics of study patients
Significant differences were observed in quantitative indices such as age, time to negative SARS-CoV-2 nucleic acid test result, body mass index (BMI), alanine aminotransferase, aspartate aminotransferase, gamma-glutamyl transferase, fasting plasma glucose (FPG); hemoglobin A1c (HbA1c); systolic blood pressure, diastolic blood pressure; triglycerides, total cholesterol, low-density lipoprotein cholesterol (LDL-C), and high-density lipoprotein cholesterol between the two groups (all P < 0.05). Additionally, there were statistically significant differences in gender distribution, COVID-19 clinical stage, and the percentage of patients with liver function abnormalities between the two groups (all P < 0.05). Detailed baseline data are shown in Table 1.
Comparison of lymphocyte subsets and their percentages between obese patients without NAFLD and those with NAFLD
When comparing lymphocyte subsets between obese patients without NAFLD and those with NAFLD, a statistically significant difference was observed in CD19+ percentages (P < 0.05), as shown in Table 2.
Table 2 Comparison of lymphocyte subsets and their percentages between obese patients without non-alcoholic fatty liver disease and those with non-alcoholic fatty liver disease, mean ± SD.
Comparison of lymphocyte subsets and their percentages at admission, discharge, and 2 weeks and 4 weeks after discharge
Statistically significant differences in lymphocyte subsets were observed between the two groups across multiple time points (all P < 0.05). At admission, the COVID-19 with NAFLD group demonstrated significantly higher levels of CD3+ counts, CD3+CD4+ counts, and lymphocyte counts compared to the COVID-19 group. At discharge, group differences were noted in lymphocyte counts, CD56+ counts and percentages, CD3+CD4+ percentages, and the ratio of CD3+CD4+ to CD3+CD8+. Immunological differences persisted during the follow-up period: At 2 weeks post-discharge, CD3+CD4+ cell counts, lymphocyte counts, CD19+ cell counts, and CD56+ counts remained significantly elevated; by 4 weeks, these differences extended to CD3+ counts, CD3+CD4+ counts, CD3+CD8+ counts, and lymphocyte counts and percentages, as illustrated in Figure 1A and B. Additionally, longitudinal analysis exhibited statistically significant differences in CD3+ counts and percentages, CD3+CD4+ counts, CD3+CD8+ counts, lymphocyte counts and percentages, CD19+ counts and percentages, CD56+ counts and percentages, and the CD3+CD4+/CD3+CD8+ ratio among COVID-19 patients with NAFLD across all assessment time points (admission, discharge, 2-week post-discharge, and 4-week post-discharge) (all P < 0.05; Figure 1C and D).
Figure 1 Comparison of lymphocyte subset counts and their percentages at admission, discharge, and 2 weeks and 4 weeks after discharge.
A and B: Comparison between coronavirus disease 2019 (COVID-19) patients with non-alcoholic fatty liver disease and those without; C and D: Comparison across different time points in COVID-19 patients with non-alcoholic fatty liver disease. aP < 0.05; bP < 0.01; cP < 0.001. COVID-19: Coronavirus disease 2019; LY: Lymphocyte counts.
Analysis of lymphocyte subsets and their percentages in COVID-19 patients with NAFLD at admission, discharge, and 2 weeks and 4 weeks post-discharge, after adjustment for comorbidities
After adjusting for confounding comorbidities (including overweight, obesity, diabetes, and dyslipidemia), COVID-19 patients with NAFLD demonstrated significantly higher CD3+ counts, CD3+CD4+ counts, and lymphocyte counts compared to those without NAFLD at admission and 4 weeks post-discharge (all P < 0.05) (Figure 2A and B). Notably, longitudinal analysis within the NAFLD-comorbid group revealed significant variations in CD3+ percentages, CD3+CD4+ counts and percentages, CD3+CD8+ percentages, lymphocyte counts and percentages, CD19+ counts and percentages, CD56+ counts and percentages, and the ratio of CD3+CD4+ to CD3+CD8+ across all evaluated time points (admission, discharge, and 2-week and 4-week post-discharge follow-ups) (all P < 0.05) (Figure 2C and D).
Figure 2 Analysis of lymphocyte subsets and their percentages in coronavirus disease 2019 patients with non-alcoholic fatty liver disease at admission, discharge, and 2 weeks and 4 weeks post-discharge after adjustment for comorbidities.
A and B: Comparison between coronavirus disease 2019 (COVID-19) patients with non-alcoholic fatty liver disease and those without; C and D: Comparison across different time points in COVID-19 patients with non-alcoholic fatty liver disease. aP < 0.05; bP < 0.01; cP < 0.001. COVID-19: Coronavirus disease 2019; LY: Lymphocyte counts.
Correlation between lymphocyte subsets and their percentages with the time to negative SARS-CoV-2 nucleic acid test result in patients with COVID-19 and NAFLD
The results of the ANOVA trend test indicated a significant linear trend between lymphocyte counts and percentages, CD3+ counts, CD3+CD4+ counts, CD3+CD8+ counts, and CD19+ counts, and the time to negative SARS-CoV-2 nucleic acid test result (all P < 0.05), as shown in Table 3. Pearson correlation analysis revealed that CD3+ counts, CD3+CD4+ counts, CD3+CD8+ counts, lymphocyte counts and percentages, CD19+ counts, and CD56+ counts were inversely correlated with the time to negative SARS-CoV-2 nucleic acid test result (all P < 0.001), as shown in Table 4.
Table 3 Linear trend analysis of lymphocyte subsets and their percentages in association with the time to negative severe acute respiratory syndrome coronavirus 2 nucleic acid test result in patients with coronavirus disease 2019 and non-alcoholic fatty liver disease.
Table 4 Pearson correlation analysis of lymphocyte subsets and their percentages with the Time to negative severe acute respiratory syndrome coronavirus 2 nucleic acid test result in patients with coronavirus disease 2019 and non-alcoholic fatty liver disease.
Variable
Time to negative severe acute respiratory syndrome coronavirus 2 nucleic acid test result
Correlation of lymphocyte subsets and their percentages with clinical disease severity in COVID-19 among patients with NAFLD
For this analysis, severe and critical types of COVID-19 were combined into a single “severe” group, while all other cases were categorized as “non-severe”. A significant linear relationship was found between lymphocyte counts and percentages, CD3+ counts, CD3+CD4+ counts, CD3+CD8+ counts, CD19+ counts, and CD56+ counts, and the incidence of severe COVID-19, with χ2 trend values of 24.995, 24.038, 18.591, 17.564, 8.839, 5.444 and 22.745, respectively (all P < 0.001), as shown in Table 5. Pearson correlation analysis demonstrated an inverse association between CD3+ counts, CD3+CD4+ counts, CD3+CD8+ counts, lymphocyte counts and percentages, CD19+ counts, and CD56+ counts, and clinical disease severity of COVID-19 (all P < 0.001), as shown in Table 6.
Table 5 Linear trend analysis of lymphocyte subsets and their percentages in relation to clinical disease severity in coronavirus disease 2019 patients with non-alcoholic fatty liver disease.
Table 6 Pearson correlation analysis between lymphocyte subsets and their percentages and clinical disease severity in coronavirus disease 2019 patients with non-alcoholic fatty liver disease.
Multivariable linear regression analysis of factors influencing lymphocyte subsets in COVID-19 patients with NAFLD
Multivariable linear regression analysis indicated that factors including COVID-19 severity, BMI, impaired fasting glucose (IFG), and liver fibrosis demonstrated statistically significant influence on CD3+ counts, CD3+CD4+ counts, CD3+CD8+ counts, and lymphocyte counts (all P < 0.05). Notably, these factors demonstrated substantial modulatory effects on lymphocyte counts. A 1-unit increase in BMI was associated with a 33.191-unit increase in lymphocyte counts (β = 33.191, P < 0.001). Severe COVID-19 cases exhibited a 696.257-unit reduction in lymphocyte counts compared to non-severe cases (β = -696.257, P < 0.05).
Patients with IFG had a 233.764-unit decrease in lymphocyte counts than those with normal fasting glucose (β = -233.764,P < 0.05). And each 1-unit increase in liver fibrosis severity decreased lymphocyte counts by 390.922 units (b = -390.922,P < 0.001). Furthermore, age was associated with lymphocyte counts in the multivariable model, showing a 7.529-unit decrease in lymphocyte counts for each 1-year increase in age (β = -7.529, P < 0.05). In conclusion, the severity of COVID-19, IFG, liver fibrosis, and advanced age were independent risk factors for decreased lymphocyte counts, as illustrated in Table 7.
Table 7 Multivariable linear regression analysis of factors influencing lymphocyte subset counts in coronavirus disease 2019 patients with non-alcoholic fatty liver disease.
Multivariable linear regression analysis of association of plasma glucose and lipid profiles with lymphocytes subsets in COVID-19 patients with NAFLD
Multivariable linear regression analysis demonstrated that LDL-C and HbA1c were significantly associated with CD3+ counts, CD3+CD4+ counts, CD3+CD8+ counts, and lymphocyte counts (all P < 0.05). Specifically, a 1-unit increase in LDL-C and HbA1c was associated with a 348.534-unit and 136.512-unit increase in lymphocyte counts, respectively (β = 348.534 and 136.512, P < 0.001). Additionally, HbA1c and FPG were positively associated with CD19+ counts and CD56+ counts, respectively (β = 23.790 and 18.366, P < 0.05), as shown in Table 8.
Table 8 Multivariable linear regression analysis of association between plasma glucose and lipid profiles with lymphocyte subsets in coronavirus disease 2019 patients with non-alcoholic fatty liver disease.
Impact of age on lymphocyte subsets and their percentages in COVID-19 patients with NAFLD: A longitudinal analysis from hospital admission to 4 weeks post-discharge
Stratification by age revealed statistically significant differences in CD3+ counts, CD3+CD4+ counts, CD3+CD8+ counts, lymphocyte counts and percentages, and CD19+ counts and percentages at admission, discharge, and 2 weeks and 4 week post-discharge among different age groups (all P < 0.05). Notably, patients aged ≥ 60 years consistently demonstrated lower levels of these immune markers compared to the 18-44-year-old group at all measured time points (admission, discharge, 2-week follow-up, and 4-week follow-up) (all P < 0.05), as shown in Figure 3.
Figure 3 Impact of age on lymphocyte subsets and their percentages in coronavirus disease 2019 patients with non-alcoholic fatty liver disease: A longitudinal analysis from hospital admission to 4 weeks post-discharge.
A: Lymphocyte subset counts (cells/μL); B: Lymphocyte subset percentages (%). aP < 0.05, 18-44 years vs 45-59 years; bP < 0.05, 18-44 years vs ≥ 60 years; cP < 0.05, 45-59 years vs ≥ 60 years; dP < 0.05; eP < 0.01; fP < 0.001. LY: Lymphocyte counts.
Impact of liver fibrosis on lymphocyte subsets and their percentages in COVID-19 patients with NAFLD: A longitudinal analysis from hospital admission to 4 weeks post-discharge
At admission, statistically significant differences were observed in CD3+ counts, CD3+CD4+ counts, CD3+CD8+ counts, lymphocyte counts, CD19+ counts, CD56+ counts, and the ratio of CD3+CD4+ to CD3+CD8+ between patients with varying levels of liver fibrosis (all P < 0.05). Furthermore, significant variations in lymphocyte counts and the ratio of CD3+CD4+ to CD3+CD8+ were consistently demonstrated at both the 2-week and 4-week post-discharge follow-ups (all P < 0.05). Moreover, patients with significant liver fibrosis (≥ F2) showed lower levels of CD3+CD4+ counts, CD3+CD8+ counts, and lymphocyte counts and percentages at admission, discharge, and 2-week and 4-week follow-ups compared to non-significant liver fibrosis (< F2) (all P < 0.05). Similarly, patients with cirrhosis (≥ F4) demonstrated reduced CD3+CD4+ counts, CD3+CD8+ counts, and lymphocyte counts and percentages at admission, along with persistently lower CD3+CD8+ counts and lymphocyte percentages at both 2-week and 4-week follow-up assessments (all P < 0.05), as shown in Figure 4.
Figure 4 Impact of liver fibrosis on lymphocyte subsets and their percentages in coronavirus disease 2019 patients with non-alcoholic fatty liver disease: A longitudinal analysis from hospital admission to 4 weeks post-discharge.
< F2: Non-significant liver fibrosis; ≥ F2: Significant liver fibrosis; ≥ F4: Cirrhosis. A: Lymphocyte subset counts (cells/μL); B: Lymphocyte subset percentages (%). aP < 0.05, < F2 vs ≥ F2; bP < 0.05, ≥ F2 vs ≥ F4; cP < 0.05, < F2 vs ≥ F4; dP < 0.05; eP < 0.01; fP < 0.001. LY: Lymphocyte counts.
Impact of comorbidities on lymphocyte subsets and their percentages in COVID-19 patients with NAFLD: A longitudinal analysis from hospital admission to 4 weeks post-discharge
A comparative analysis of lymphocyte subsets in COVID-19 patients with NAFLD demonstrated statistically significant variations in CD3+ counts, CD3+CD4+ counts, CD3+CD8+ counts, lymphocyte counts and percentages, CD19+ counts, CD56+ percentages, and the ratio of CD3+CD4+ to CD3+CD8+ at hospital admission, stratified by the number of comorbidities (all P < 0.05). Longitudinal analysis revealed that CD3+ counts, CD3+CD8+ counts, lymphocyte counts and percentages, and the ratio of CD3+CD4+ to CD3+CD8+ maintained statistical significance throughout the entire post-discharge period, with persistent differences observed at both 2-week and 4-week follow-ups (all P < 0.05).
Compared to NAFLD patients without comorbidities, those with two comorbidities demonstrated significantly higher levels of CD3+CD4+ counts and the ratio of CD3+CD4+ to CD3+CD8+ at admission, an elevated CD3+CD4+ to CD3+CD8+ ratio at discharge, and persistently higher CD3+CD4+ percentages and CD3+CD4+/CD3+CD8+ ratio at both 2-week and 4-week post-discharge follow-ups (all P < 0.05).
Moreover, patients with three or more comorbidities displayed further immunological alterations, including higher CD3+CD4+ percentages and CD56+ counts at admission, elevated CD3+CD4+ counts, lymphocyte counts, and CD19+ counts and percentages at discharge, as well as sustained increases in CD3+CD4+ counts at the 2-week follow-up and higher CD3+CD4+ percentages at the 4-week post-discharge follow-up (all P < 0.05), as illustrated in Figure 5.
Figure 5 Impact of comorbidities on lymphocyte subsets and their percentages in coronavirus disease 2019 patients with non-alcoholic fatty liver disease: A longitudinal analysis from hospital admission to 4 weeks post-discharge.
A: Lymphocyte subset counts (cells/μL); B: Lymphocyte subset percentages (%). aP < 0.05, 0 vs 1; bP < 0.05, 0 vs 2; cP < 0.05, 0 vs 3; dP < 0.05, 1 vs 2; eP < 0.05, 1 vs 3; fP < 0.05, 2 vs 3; gP < 0.001; hP < 0.05; iP < 0.01. LY: Lymphocyte counts; 0: No comorbidities; 1: One comorbidity; 2: Two comorbidities; ≥ 3: Three or more comorbidities.
Impact of BMI on lymphocyte subsets and their percentages in COVID-19 patients with NAFLD: A longitudinal analysis from hospital admission to 4 weeks post-discharge
Stratified analysis by BMI revealed significant differences in CD3+ counts, CD3+CD4+ counts, CD3+CD8+ counts, lymphocyte counts, and CD19+ counts and percentages at admission among COVID-19 patients with NAFLD (all P < 0.05). Comparative analyses demonstrated that obese individuals maintained consistently higher CD3+CD4+ counts, CD19+ counts, and lymphocyte counts throughout all clinical phases—from hospitalization through discharge and during the 2-week to 4-week recovery period—when compared with normal-weight controls (all P < 0.05). Similarly, lymphocyte counts and CD19+ counts significantly differed between overweight and obese groups at admission, discharge, and 2 weeks post-discharge (all P < 0.05). CD3+ percentages also showed significant intergroup differences at the 2-week and 4-week follow-ups (all P < 0.05), as demonstrated in Figure 6.
Figure 6 Impact of body mass index on lymphocyte subsets and their percentages in coronavirus disease 2019 patients with non-alcoholic fatty liver disease: A longitudinal analysis from hospital admission to 4 weeks post-discharge.
A: Lymphocyte subset counts (cells/μL); B: Lymphocyte subset percentages (%). aP < 0.05, normal weight vs overweight; bP < 0.05, normal weight vs obesity; cP < 0.05, overweight vs obesity; dP < 0.05; eP < 0.01; fP < 0.001. Normal weight: 18.5 ≤ body mass index (BMI) < 24; Overweight: 24 ≤ BMI < 28; Obesity: BMI ≥ 28; LY: Lymphocyte counts.
Impact of liver enzymes on lymphocyte subsets and their percentages in COVID-19 patients with NAFLD: A longitudinal analysis from hospital admission to 4 weeks post-discharge
Patients with elevated liver enzymes exhibited persistently higher CD3+ counts, CD3+CD4+ counts, lymphocyte counts, and CD19+ counts at all post-admission evaluations (discharge through the 4-week follow-up), compared to those with normal liver enzymes (all P < 0.05). Additionally, CD3+CD8+ counts and lymphocyte percentages remained significantly different at 4 weeks post-discharge (all P < 0.05), as illustrated in Figure 7.
Figure 7 Impact of liver enzymes on lymphocyte subsets and their percentages in coronavirus disease 2019 patients with non-alcoholic fatty liver disease: A longitudinal analysis from hospital admission to 4 weeks post-discharge.
A: Lymphocyte subset counts (cells/μL); B: Lymphocyte subset percentages (%). aP < 0.05; bP < 0.01; cP < 0.001. LY: Lymphocyte counts.
Impact of vaccination on lymphocyte subsets and their percentages in COVID-19 patients with NAFLD: A longitudinal analysis from hospital admission to 4 weeks post-discharge
Vaccinated patients demonstrated significantly lower CD3+ counts, CD3+CD4+ counts, CD3+CD8+ counts, and lymphocyte counts and percentages at admission compared to unvaccinated patients (all P < 0.05). However, from discharge through the 4-week follow-up, vaccinated patients demonstrated higher CD3+ counts, CD3+CD4+ counts, lymphocyte counts and percentages, and CD19+ counts (all P < 0.05). Additionally, CD3+CD8+ counts also remained significantly elevated at both discharge and the 4-week post-discharge time points (all P < 0.05), as shown in Figure 8.
Figure 8 Impact of vaccination on lymphocyte subsets and their percentages in coronavirus disease 2019 with non-alcoholic fatty liver disease: A longitudinal analysis from hospital admission to 4 weeks post-discharge.
A: Lymphocyte subset counts (cells/μL); B: Lymphocyte subset percentages (%). aP < 0.05; bP < 0.01; cP < 0.001. LY: Lymphocyte counts.
DISCUSSION
In this cohort study, we enrolled 1528 patients comprising two distinct subgroups: COVID-19 patients with NAFLD and those without. Longitudinal analyses were conducted to assess potential determinants of lymphocyte subset distributions and their relative proportions at four predefined time points: Admission, discharge, and 2 weeks and 4 weeks post-discharge. Additionally, we examined the potential associations between lymphocyte profiles and two key clinical outcomes: The time to negative SARS-CoV-2 nucleic acid test result and progression to severe COVID-19.
Pearson correlation analysis identified statistically significant inverse associations between key lymphocyte populations (CD3+ counts, CD3+CD4+ counts, CD3+CD8+ counts, lymphocyte counts and percentages, CD19+ counts, and CD56+ counts) and both the time to negative SARS-CoV-2 nucleic acid test result and clinical disease severity in COVID-19. Compared to COVID-19 patients, NAFLD-comorbid patients demonstrated persistently elevated CD3+CD4+ counts and lymphocyte counts and percentages at admission, and at 2-week and 4-week follow-ups post-discharge.
Multivariate analysis demonstrated that age, COVID-19 severity, BMI, IFG, liver fibrosis, vaccination status, LDL-C, and HbA1c significantly influenced CD3+ counts, CD3+CD4+ counts, CD3+CD8+ counts, and lymphocyte counts, with particularly pronounced effects on lymphocyte counts. Furthermore, elevated HbA1c and FPG specifically impacted both CD19+ counts and CD56+ counts.
Stratification by comorbidity burden uncovered statistically significant intergroup differences in CD3+ counts, CD3+CD4+ counts, CD3+CD8+ counts, lymphocyte counts and percentages, CD19+ counts, CD56+ percentages, CD19+ counts, CD56+ percentages, and the ratio of CD3+CD4+ to CD3+CD8+ at hospital admission.
Most remarkably, these patients demonstrated persistent immunological disturbances —particularly in CD3+ counts, CD3+CD8+ counts, and lymphocyte counts—that remained detectable throughout the post-discharge recovery phase (2/4 weeks). Compared to NAFLD patients without comorbidities, patients with two comorbidities showed statistically significantly elevated CD3+CD4+ counts and the ratio of CD3+CD4+ to CD3+CD8+ at admission, a higher CD3+CD4+/CD3+CD8+ ratio at discharge, and persistently higher CD3+CD4+ percentages and CD3+CD4+ to CD3+CD8+ ratio at both 2-week and 4-week post-discharge follow-ups.
Moreover, patients with three or more comorbidities displayed further immunological alterations, including higher CD3+CD4+ percentages and CD56+ counts at admission, higher CD3+CD4+ counts, lymphocyte counts, and CD19+ counts and percentages at discharge, as well as sustained increases in CD3+CD4+ counts at the 2-week follow-up and increased CD3+CD4+ percentages at the 4-week post-discharge follow-up.
After adjusting for confounding comorbidities, COVID-19 patients with NAFLD exhibited significant alterations in multiple lymphocyte parameters—including CD3+ percentages, CD3+CD4+ counts and percentages, CD3+CD8+ percentages, lymphocyte counts and percentages, CD19+ counts and percentages, CD56+ counts and percentages, and the CD3+CD4+/CD3+CD8+ ratio—across all clinical stages, from hospitalization through the 4-week post-discharge recovery. Additionally, COVID-19 patients with NAFLD demonstrated significantly higher CD3+ counts, CD3+CD4+ counts, and lymphocyte counts at admission and 4 weeks post-discharge, compared to those without NAFLD. These persistent differences indicate that NAFLD is an independent factor of lymphocyte subset distribution and phenotypic profiles. Patients with uncomplicated NAFLD (including lean NAFLD) also require particular clinical attention to dynamic lymphocyte subset alterations to mitigate risks of immune imbalance.
Analyses stratified by liver fibrosis stage uncovered significant intergroup differences in CD3+ counts, CD3+CD4+ counts, CD3+CD8+ counts, lymphocyte counts, CD19+ counts, CD56+ counts, and the CD3+CD4+/CD3+CD8+ ratio at admission. Furthermore, patients with significant liver fibrosis (≥ F2) exhibited lower CD3+CD4+ counts, CD3+CD8+ counts, lymphocyte counts and percentages at admission, discharge, and 2-week and 4-week follow-ups compared to those with non-significant liver fibrosis (< F2). Similarly, patients with cirrhosis (≥ F4) demonstrated reduced CD3+CD4+ counts, CD3+CD8+ counts, and lymphocyte counts and percentages at admission, along with persistently lower CD3+CD8+ counts and lymphocyte percentages at both 2-week and 4-week follow-up assessments. Furthermore, patients with elevated liver enzymes demonstrated persistently higher CD3+ counts, CD3+CD4+ counts, lymphocyte counts, and CD19+ counts at all post-admission assessments (discharge through the 4-week follow-up), compared to those with normal liver enzymes.
During NAFLD pathogenesis, resident Kupffer cells and monocyte-derived macrophages function as hepatic sentinel cells that demonstrate enhanced sensitivity to locally enriched exogenous antigens, metabolic byproducts, and damage-associated molecular patterns (DAMPs). This induces a fundamental transition from immune tolerance to an activated state, evidenced by: (1) Suppressed secretion of anti-inflammatory mediators IL-10 and transforming growth factor-β; and (2) Significant upregulation of pro-inflammatory cytokines (tumor necrosis factor-α, IL-1β, and IL-6)[47,48]. T cell-specific effects of IL-6 in COVID-19 might include the facilitation of T helper (Th17) cell responses and indirectly the recruitment of Th17 cells to the infected epithelium. Within the tissue, Th17 cells are responsible for the attraction of neutrophils and amplification of immunopathology[49]. A subset of tissue-resident memory-like Th17 cells has been reported in the lungs of COVID-19 patients, which might contribute to hyperinflammation in severe cases by the production of IL-17A and granulocyte-macrophage colony-stimulating factor, as well as interactions with lung macrophages and cytotoxic CD8+ T cells[50].
Notably, in COVID-19 patients, a proinflammatory milieu is driven by factors including the high expression of CD302, a C-type lectin receptor induced in vitro upon lipopolysaccharide stimulation, alarmins such as S100 calcium binding protein A8 and S100 calcium binding protein A12, calcium-binding proteins, and other DAMPs. The expression of these molecules is regulated by proinflammatory mediators such as interferon-γ and tumor necrosis factor-α and that can lead to the secretion of IL-6 and IL-8[50]. In NAFLD, this inflammatory milieu is perpetuated through complex crosstalk between hepatocytes and both adaptive and innate immune cells, driving a state of chronic low-grade inflammation that underlies disease progression[47,48].
Diffuse lymphocytic lobular infiltration was consistently identified as a characteristic histological feature in NAFLD[51,52]. Immunohistochemical analysis revealed focal lymphoid aggregates containing both B and T cell populations in approximately 60% of NASH cases[53]. Liver infiltration of B cells and CD4+ and CD8+ T cells was evident in different NASH models, which exacerbates liver parenchymal damage and lobular inflammation. These T cells express the memory or effector markers (CD25, CD44, and CD69) and exhibit enhanced production of cytokines, indicating their functional activation[52,54,55].
Mechanistically, natural killer cells isolated from NASH livers secrete higher levels of pro-inflammatory cytokines (interferon-γ, IL-1β, IL-12, C-C motif ligand 4, C-C motif ligand 5, and granulocyte-macrophage colony-stimulating factor), which could activate hepatic Janus kinase-signal transducer and activator of transcription (JAK/STAT) 1/3 and nuclear factor kappa B signaling and induce hepatocyte damage evidenced by increased reactive oxygen species and apoptosis rate[56]. Moreover, SARS-CoV-2 infection triggers inflammatory via the JAK/STAT pathway, leading to the recruitment of pneumocytes, endothelial cells, macrophages, monocytes, lymphocytes, natural killer cells, and dendritic cells, thereby driving the progression towards a cytokine storm. These produces various inflammatory markers in the host that dictate disease severity. The JAK/STAT signaling pathway is also pivotal for immune responses, exerting its effects through the modulation of B cell function and T cell differentiation[57].
T-cell activation GTPase activating protein plays a role in immune cell regulation. Predominantly distributed in CD4+/CD8+ T cells, T-cell activation GTPase activating protein influences CD4+ T cell differentiation and function through the JAK/STAT pathway, promoting immune infiltration and cytotoxicity[58]. Additionally, B cells not only directly mediate the chemotaxis of other immune cells enriched in immune damage and inflammation, but also act as antigen-presenting cells to activate adaptive immunity[59]. Both innate and adaptive immune mechanisms are actively involved in the development of inflammation in NAFLD and fibrogenesis[60]. The innate immune system triggers initial inflammatory responses via DAMP recognition, subsequently driving fibrotic progression. Accumulating evidence demonstrated that T cell-mediated adaptive immunity also contributes to NASH pathogenesis via multiple mechanisms, including direct cytotoxicity, cytokine production, and secretion of other pro-inflammatory and pro-fibrotic mediators[61].
Moreover, regarding the impact of comorbidities on lymphocyte subsets, prior studies have demonstrated that in COVID-19 patients, the NAFLD-diabetes group, the NAFLD with hyperlipidemia group, and the NAFLD with hyperuricemia/gout group exhibited significantly increased levels of various immunological parameters compared to the NAFLD-only group: Lymphocyte counts and percentages, CD3+ counts and percentages, CD19+ counts and percentages, CD56+ counts and percentages, CD3+CD4+ counts and percentages, CD3+CD8+ counts and percentages, and the CD3+CD4+/CD3+CD8+ ratio[35].
Stratification by BMI revealed distinct immunological profiles among NAFLD-COVID-19 patients at admission, showing significant intergroup variations in CD3+ counts, CD3+CD4+ counts, CD3+CD8+ counts, lymphocyte counts, and CD19+ counts. Comparative studies demonstrated that obese individuals maintained elevated CD3+CD4+ counts, CD19+ counts, and lymphocyte counts throughout all clinical course—from hospitalization through discharge and during the 2-week to 4-week recovery period—when compared with patients of normal weight.
Excess body fat was demonstrated to impair immune function, with population-based data revealing an elevated incidence of autoimmune and immune-mediated disorders in obese individuals[62]. Obesity-associated immune dysfunction, characterized by impaired T lymphocyte effector function and macrophage polarization defects, was demonstrated to weaken immune defenses, thereby increasing susceptibility to infections and chronic respiratory diseases[63,64].
Notably, severe obesity was identified as a significant risk factor for viral infectious diseases[10,65]. Specifically, excess adiposity was found to adversely affect immune function and host defense mechanisms[65], while the response to viral and bacterial challenges was shown to be impaired in obese hosts[65-67]. Obese individuals with diabetes exhibited marked polyclonal B-cell activation and elevated antibody secretion, while demonstrated impaired responsiveness to neo-antigens like seasonal influenza vaccines. This heightened B-cell activation was significantly associated with the progression of type 2 diabetes in obese subjects[68]. An analysis demonstrated significantly reduced natural killer cell activity in patients with type 2 diabetes mellitus compared to normoglycemic or prediabetic controls[69].
Stratification by age revealed significant differences in CD3+ counts, CD3+CD4+ counts, CD3+CD8+ counts, lymphocyte counts and percentages, and CD19+ counts and percentages at admission, discharge, and 2-week and 4-week post-discharge follow-ups. Most strikingly, patients aged ≥ 60 years exhibited significantly lower levels of these parameters compared to those aged 18-44 years at all measured time points: Admission, discharge, 2-week follow-up, and 4-week follow-up. Immune function was demonstrated to decline progressively with advancing age[70]. This age-associated deterioration of immune competence, termed immunosenescence, was identified as a key contributor to the increased incidence and severity of infectious diseases, as well as reduced vaccine efficacy in elderly populations. Immunosenescence was characterized by both cellular immune dysfunction (particularly in T cell-mediated responses) and impaired humoral immunity. Age-dependent functional deficits in T and B lymphocyte responses were consistently observed to coincide with progressive alterations in innate immune system components[70].
Considering all contributing factors, in the clinical management of COVID-19 patients with NAFLD, special attention should be given to age, liver fibrosis, comorbidity burden, obesity, and hepatic function due to their significant immunomodulatory effects. High-risk populations—particularly those with obesity (BMI ≥ 28 kg/m2), advanced age (≥ 60 years), multiple comorbidities (≥ 2 concurrent conditions), hepatic dysfunction, or significant liver fibrosis/cirrhosis—require enhanced clinical surveillance.
A comprehensive management approach should include concurrent monitoring of LDL-C, HbA1c, and FPG, with immunomodulatory therapies being integrated with targeted control of these metabolically driven immunosuppressive risk factors. Furthermore, discharge criteria should encompass not only resolution of COVID-19 symptoms and SARS-CoV-2 viral clearance but also the stabilization of both chronic disease parameters and lymphocyte subset profiles. Furthermore, patients with uncomplicated NAFLD (including lean NAFLD) also require particular clinical attention to dynamic changes in lymphocyte subsets to mitigate risks of immune imbalance.
Our study has several limitations, such as insufficient liver biopsy data due to the avoidance of additional infection risks for COVID-19-NAFLD patients. This consequently led to an insufficient assessment of the correlation between hepatic steatosis severity and dynamic changes in lymphocyte profiles. However, through rigorous multivariate adjustment, we demonstrated that several metabolic parameters were independently associated with distinct immune imbalance patterns in COVID-19 patients with NAFLD. Notably, after adjusting for potential confounders, we identified some new associations with altered immune responses in COVID-19 patients with NAFLD: (1) Advanced age (≥ 60 years); (2) Obesity (BMI ≥ 28 kg/m2); (3) IFG; (4) Liver fibrosis; (5) Elevated liver enzymes; (6) Elevated LDL-C levels; and (7) Increased HbA1c. Importantly, patients with uncomplicated NAFLD (including lean NAFLD) were also identified as requiring particular clinical attention to mitigate risks of immune imbalance.
CONCLUSION
Dynamic changes in lymphocyte subsets significantly influence disease progression and prognosis in COVID-19 patients with NAFLD. Therefore, enhanced clinical management should be prioritized for high-risk groups, particularly individuals with obesity (BMI ≥ 28 kg/m2), advanced age (≥ 60 years), multiple comorbidities (≥ 2 concurrent conditions), hepatic insufficiency, or significant liver fibrosis/cirrhosis. Comprehensive management strategies must also target metabolic markers including LDL-C, HbA1c, and FPG.
Notably, patients with uncomplicated NAFLD (including lean NAFLD) also require clinical attention to mitigate the risk of immune dysregulation. Furthermore, discharge criteria should incorporate the stabilization of chronic disease parameters and lymphocyte subset profiles. Integrating immunomodulatory therapies with targeted control of metabolic immunosuppressive risk factors will optimize comprehensive clinical management.
ACKNOWLEDGEMENTS
We thank Xiu Li (Rehabilitation Division, the Public and Health Clinic Center of Chengdu) for providing assistance during the course of the study.
Bruzzone C, Bizkarguenaga M, Gil-Redondo R, Diercks T, Arana E, García de Vicuña A, Seco M, Bosch A, Palazón A, San Juan I, Laín A, Gil-Martínez J, Bernardo-Seisdedos G, Fernández-Ramos D, Lopitz-Otsoa F, Embade N, Lu S, Mato JM, Millet O. SARS-CoV-2 Infection Dysregulates the Metabolomic and Lipidomic Profiles of Serum.iScience. 2020;23:101645.
[RCA] [PubMed] [DOI] [Full Text] [Full Text (PDF)][Cited by in Crossref: 165][Cited by in RCA: 180][Article Influence: 30.0][Reference Citation Analysis (0)]
Bidari Zerehpoosh F, Sabeti S, Bahrami-Motlagh H, Mokhtari M, Naghibi Irvani SS, Torabinavid P, Esmaeili Tarki F, Amirdosara M, Rezaei O, Mostafazadeh B, Hajiesmaeili M, Rabiei MM, Alavi Darazam I. Post-mortem Histopathologic Findings of Vital Organs in Critically Ill Patients with COVID-19.Arch Iran Med. 2021;24:144-151.
[RCA] [PubMed] [DOI] [Full Text][Cited by in Crossref: 3][Cited by in RCA: 10][Article Influence: 2.0][Reference Citation Analysis (1)]
Dietrich CG, Geier A, Merle U. Non-alcoholic fatty liver disease and COVID-19: Harmless companions or disease intensifier?World J Gastroenterol. 2023;29:367-377.
[PubMed] [DOI] [Full Text]
Liu J, Li S, Liu J, Liang B, Wang X, Wang H, Li W, Tong Q, Yi J, Zhao L, Xiong L, Guo C, Tian J, Luo J, Yao J, Pang R, Shen H, Peng C, Liu T, Zhang Q, Wu J, Xu L, Lu S, Wang B, Weng Z, Han C, Zhu H, Zhou R, Zhou H, Chen X, Ye P, Zhu B, Wang L, Zhou W, He S, He Y, Jie S, Wei P, Zhang J, Lu Y, Wang W, Zhang L, Li L, Zhou F, Wang J, Dittmer U, Lu M, Hu Y, Yang D, Zheng X. Longitudinal characteristics of lymphocyte responses and cytokine profiles in the peripheral blood of SARS-CoV-2 infected patients.EBioMedicine. 2020;55:102763.
[RCA] [PubMed] [DOI] [Full Text] [Full Text (PDF)][Cited by in Crossref: 1340][Cited by in RCA: 1201][Article Influence: 200.2][Reference Citation Analysis (6)]
Zhou F, Yu T, Du R, Fan G, Liu Y, Liu Z, Xiang J, Wang Y, Song B, Gu X, Guan L, Wei Y, Li H, Wu X, Xu J, Tu S, Zhang Y, Chen H, Cao B. Clinical course and risk factors for mortality of adult inpatients with COVID-19 in Wuhan, China: a retrospective cohort study.Lancet. 2020;395:1054-1062.
[RCA] [PubMed] [DOI] [Full Text][Cited by in Crossref: 21249][Cited by in RCA: 18061][Article Influence: 3010.2][Reference Citation Analysis (11)]
Zhao Y, Kilian C, Turner JE, Bosurgi L, Roedl K, Bartsch P, Gnirck AC, Cortesi F, Schultheiß C, Hellmig M, Enk LUB, Hausmann F, Borchers A, Wong MN, Paust HJ, Siracusa F, Scheibel N, Herrmann M, Rosati E, Bacher P, Kylies D, Jarczak D, Lütgehetmann M, Pfefferle S, Steurer S, Zur-Wiesch JS, Puelles VG, Sperhake JP, Addo MM, Lohse AW, Binder M, Huber S, Huber TB, Kluge S, Bonn S, Panzer U, Gagliani N, Krebs CF. Clonal expansion and activation of tissue-resident memory-like Th17 cells expressing GM-CSF in the lungs of severe COVID-19 patients.Sci Immunol. 2021;6:eabf6692.
[RCA] [PubMed] [DOI] [Full Text] [Full Text (PDF)][Cited by in Crossref: 160][Cited by in RCA: 134][Article Influence: 26.8][Reference Citation Analysis (0)]
Wolf MJ, Adili A, Piotrowitz K, Abdullah Z, Boege Y, Stemmer K, Ringelhan M, Simonavicius N, Egger M, Wohlleber D, Lorentzen A, Einer C, Schulz S, Clavel T, Protzer U, Thiele C, Zischka H, Moch H, Tschöp M, Tumanov AV, Haller D, Unger K, Karin M, Kopf M, Knolle P, Weber A, Heikenwalder M. Metabolic activation of intrahepatic CD8+ T cells and NKT cells causes nonalcoholic steatohepatitis and liver cancer via cross-talk with hepatocytes.Cancer Cell. 2014;26:549-564.
[RCA] [PubMed] [DOI] [Full Text][Cited by in Crossref: 627][Cited by in RCA: 589][Article Influence: 49.1][Reference Citation Analysis (1)]
Xu Z, Zheng T, Zheng Z, Jiang W, Huang L, Deng K, Yuan L, Qin F, Sun Y, Qin J, Li S. TAGAP expression influences CD4+ T cell differentiation, immune infiltration, and cytotoxicity in LUAD through the STAT pathway: implications for immunotherapy.Front Immunol. 2023;14:1224340.
[RCA] [PubMed] [DOI] [Full Text][Cited by in RCA: 9][Reference Citation Analysis (0)]
Farahnak K, Bai YZ, Yokoyama Y, Morkan DB, Liu Z, Amrute JM, De Filippis Falcon A, Terada Y, Liao F, Li W, Shepherd HM, Hachem RR, Puri V, Lavine KJ, Gelman AE, Bharat A, Kreisel D, Nava RG. B cells mediate lung ischemia/reperfusion injury by recruiting classical monocytes via synergistic B cell receptor/TLR4 signaling.J Clin Invest. 2024;134:e170118.
[RCA] [PubMed] [DOI] [Full Text] [Full Text (PDF)][Cited by in RCA: 19][Reference Citation Analysis (0)]
Rodríguez A, Socías L, Guerrero JE, Figueira JC, González N, Maraví-Poma E, Lorente L, Martín M, Albaya-Moreno A, Algora-Weber A, Vallés J, León-Gil C, Lisboa T, Balasini C, Villabón M, Pérez-Padilla R, Barahona D, Rello J; Grupo Español de Trabajo de Gripe A Grave/Sociedad Española de Medicina Intensiva, Crítica y Unidades Coronarias. [Pandemic influenza A in the ICU: experience in Spain and Latin America. GETGAG/SEMICYUC/(Spanish Working Group on Severe Pandemic Influenza A/SEMICYUC)].Med Intensiva. 2010;34:87-94.
[RCA] [PubMed] [DOI] [Full Text][Cited by in Crossref: 43][Cited by in RCA: 33][Article Influence: 2.1][Reference Citation Analysis (0)]
Van Kerkhove MD, Vandemaele KA, Shinde V, Jaramillo-Gutierrez G, Koukounari A, Donnelly CA, Carlino LO, Owen R, Paterson B, Pelletier L, Vachon J, Gonzalez C, Hongjie Y, Zijian F, Chuang SK, Au A, Buda S, Krause G, Haas W, Bonmarin I, Taniguichi K, Nakajima K, Shobayashi T, Takayama Y, Sunagawa T, Heraud JM, Orelle A, Palacios E, van der Sande MA, Wielders CC, Hunt D, Cutter J, Lee VJ, Thomas J, Santa-Olalla P, Sierra-Moros MJ, Hanshaoworakul W, Ungchusak K, Pebody R, Jain S, Mounts AW; WHO Working Group for Risk Factors for Severe H1N1pdm Infection. Risk factors for severe outcomes following 2009 influenza A (H1N1) infection: a global pooled analysis.PLoS Med. 2011;8:e1001053.
[RCA] [PubMed] [DOI] [Full Text] [Full Text (PDF)][Cited by in Crossref: 575][Cited by in RCA: 530][Article Influence: 35.3][Reference Citation Analysis (1)]
Provenance and peer review: Invited article; Externally peer reviewed.
Peer-review model: Single blind
Specialty type: Gastroenterology and hepatology
Country of origin: China
Peer-review report’s classification
Scientific Quality: Grade B
Novelty: Grade B
Creativity or Innovation: Grade B
Scientific Significance: Grade A
Open Access: This article is an open-access article that was selected by an in-house editor and fully peer-reviewed by external reviewers. It is distributed in accordance with the Creative Commons Attribution NonCommercial (CC BY-NC 4.0) license, which permits others to distribute, remix, adapt, build upon this work non-commercially, and license their derivative works on different terms, provided the original work is properly cited and the use is non-commercial. See: https://creativecommons.org/Licenses/by-nc/4.0/
P-Reviewer: Yu MK, PhD, China S-Editor: Hu XY L-Editor: Wang TQ P-Editor:Xu J