Copyright
©The Author(s) 2015.
World J Hepatol. Aug 8, 2015; 7(16): 1987-2008
Published online Aug 8, 2015. doi: 10.4254/wjh.v7.i16.1987
Published online Aug 8, 2015. doi: 10.4254/wjh.v7.i16.1987
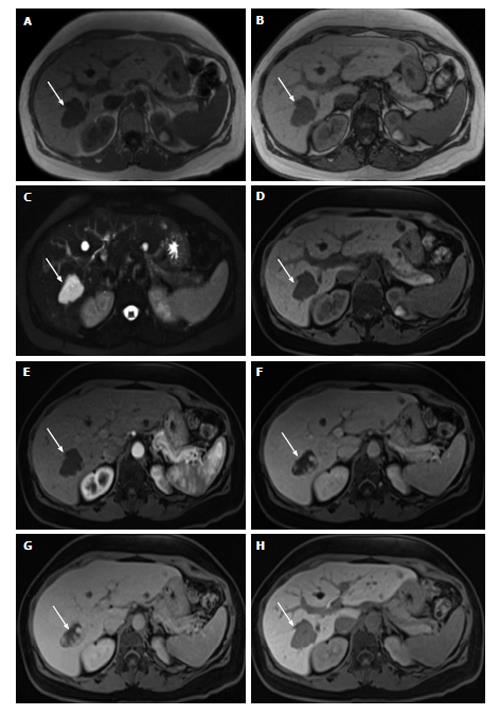
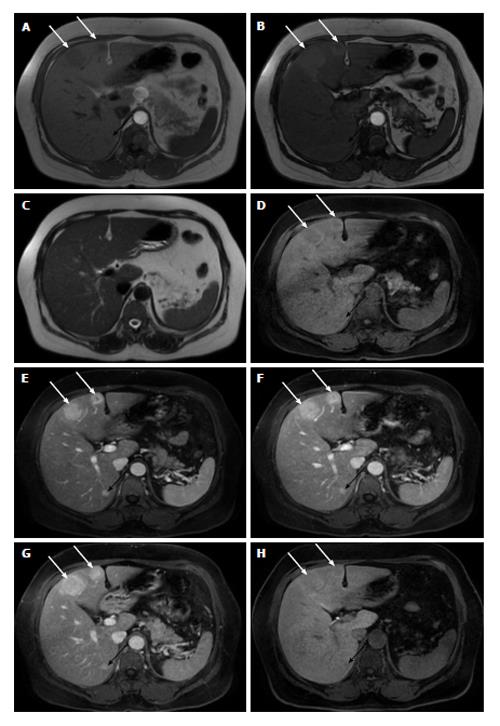
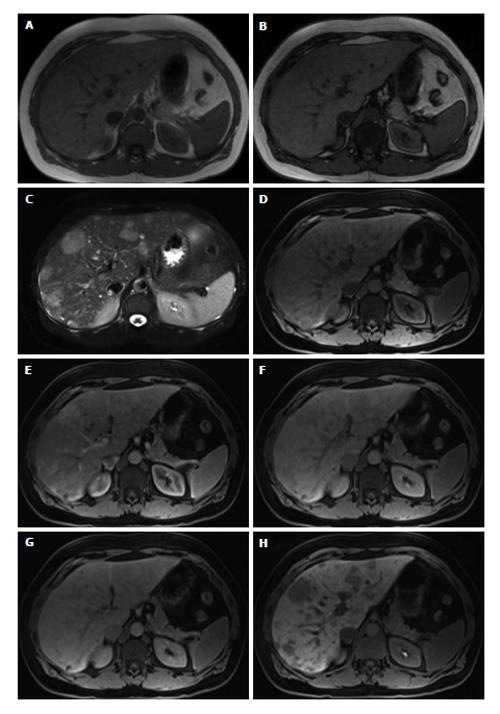
Figure 1 Hemangioma.
In (A) and opposed-phase (B) GRE T1-WI, fat-suppressed FSE T2-WI (C), pre (D) and post hepatocyte-specific contrast agent (Eovist®) fat-suppressed 3D-GRE T1-WI at the arterial (E), portal venous (F), interstitial (G) and hepatobiliary (H) phases. There is a lobulated lesion on the right hepatic lobe (arrows), showing marked low signal intensity on T1-WI (A, B and D) and marked high signal intensity on T2-WI (C). The lesion demonstrates peripheral and discontinuous nodular enhancement (E), which become larger and coalescent on delayed postcontrast images (F and G), showing a progressive centripetal filling. Due to the absence of hepatocytes, hemangiomas show low signal intensity on the hepatobiliary phase (H), acquired 20 min after the administration of the hepatocyte-specific contrast agent. GRE: Gradient-echo; FSE: Fast spinecho; T1-WI: T1-weighted images.
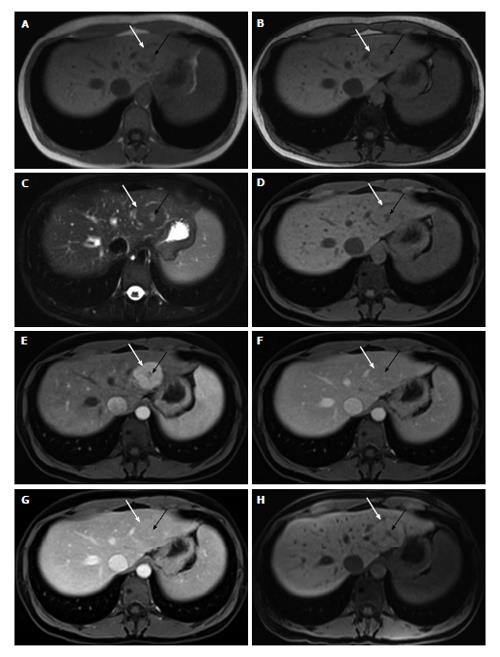
Figure 2 Focal nodular hyperplasia.
In- (A) and opposed-phase (B) GRE T1-WI, fat-suppressed FSE T2-WI (C), pre (D) and post hepatocyte-specific contrast agent (Eovist®) fat-suppressed 3D-GRE T1-WI at the arterial (E), portal venous (F), interstitial (G) and hepatobiliary (H) phases. There is a lesion on the left hepatic lobe (white arrow, A-H), showing isointense signal comparing to the surrounding liver on non-contrast T1-WI (A, B and D) and on T2-WI (C). The lesion also shows a central scar (black arrow, A-H), which is hypointense on T1-WI (A, B and D) and hyperintense on T2-WI (C). The lesion demonstrates homogeneous enhancement on early post-contrast images (E), becoming isointense to the underlying liver parenchyma (F and G). The progressive enhancement of the central scar is depicted on the delayed post-contrast images (G). On the hepatobiliary phase, 20 min after the administration the hepatocyte-specific contrast agent, the lesion shows uptake of the contrast agent, becoming minimally hyperintense comparing to the surrounding liver parenchyma. Since the central scar has no hepatocytes, there is no uptake of the contrast agent, becoming hypointense comparing to the liver and to the rest of the lesion. GRE: Gradient-echo; FSE: Fast spinecho; T1-WI: T1-weighted images.
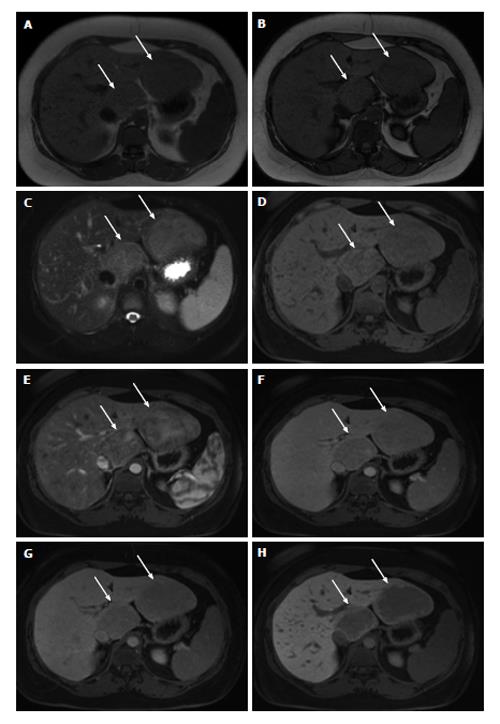
Figure 3 Hepatocellular adenomas.
In- (A) and opposed-phase (B) GRE T1-WI, fat-suppressed FSE T2-WI (C), pre (D) and post hepatocyte-specific contrast agent (Eovist®) fat-suppressed 3D-GRE T1-WI at the arterial (E), portal venous (F), interstitial (G) and hepatobiliary (H) phases. Two focal liver lesions are noted on the left and caudate lobes (arrows, A-G) of a noncirrhotic liver, showing slight drop of signal intensity on opposed-phase (B) comparing with the in-phase (A) T1-WI, which is related to minimally fat content. Note that the liver parenchyma also shows minimal steatosis. The lesions demonstrate mild high signal intensity on T2-WI (C), heterogeneous enhancement on the postcontrast arterial phase image (E) and subsequent washout on later postcontrast images (F and G). On the hepatobiliary phase, acquired 20 min after the hepatocyte-specific contrast agent, the lesions show no contrast uptake, excluding the diagnosis of FNHs. GRE: Gradient-echo; FSE: Fast spinecho; T1-WI: T1-weighted images; FNH: Focal nodular hyperplasias.
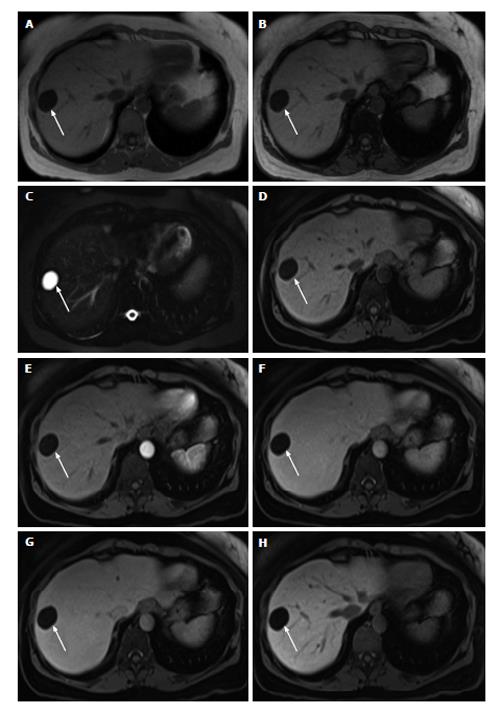
Figure 4 Cyst.
In- (A) and opposed-phase (B) GRE T1-WI, fat-suppressed FSE T2-WI (C), pre (D) and post hepatocyte-specific contrast agent (Eovist®) fat-suppressed 3D-GRE T1-WI at the arterial (E), portal venous (F), interstitial (G) and hepatobiliary (H) phases. There is a well-defined lesion on the right hepatic lobe (arrow, A-H) showing marked homogeneous low signal intensity on T1-WI (A, B and D), homogeneous very high signal intensity on T2-WI (C) and no enhancement after gadolinium administration (E-H), consistent with simple liver cyst. GRE: Gradient-echo; FSE: Fast spinecho; T1-WI: T1-weighted images.
Figure 5 Multiple biliary hamartomas (also known as von Meyenburg complex).
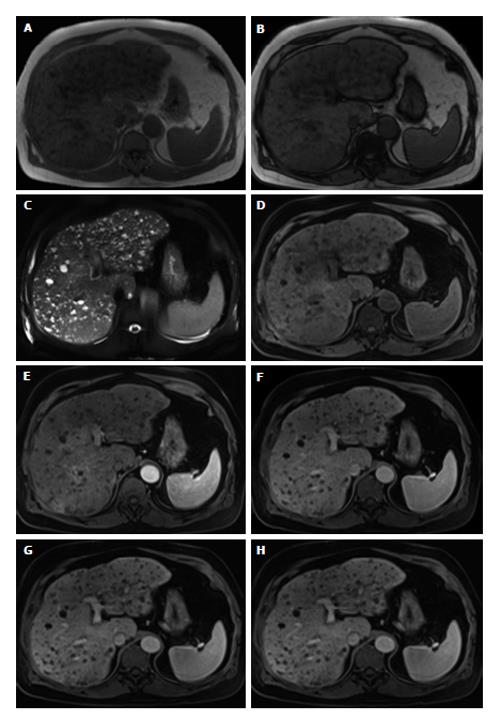
In- (A) and opposed-phase (B) GRE T1-WI, fat-suppressed FSE T2-WI (C), pre (D) and postcontrast fat-suppressed 3D-GRE T1-WI at the arterial (E), portal venous (F) and interstitial (G) phases. There are multiple well-defined lesions scattered throughout the liver, smaller than 1.5 cm each. The lesions show low signal intensity on T1-WI (A, B and D), high signal intensity on T2-WI (C) and no enhancement after gadolinium administration (E-G). A thin peripheral enhancement is often present due to compressed liver parenchyma. GRE: Gradient-echo; FSE: Fast spinecho; T1-WI: T1-weighted images.
Figure 6 Abscess.
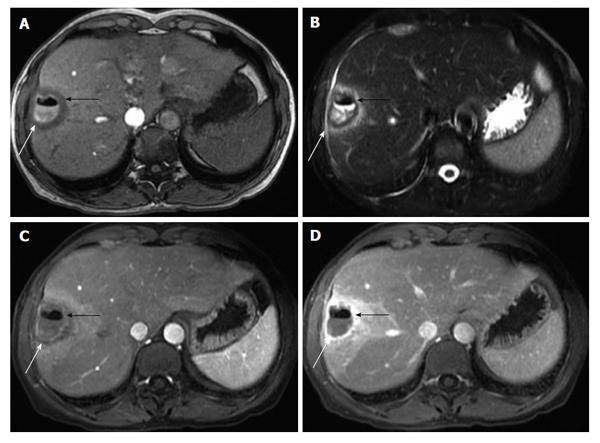
GRE T1-WI (A), fat-suppressed FSE T2-WI (B), and postcontrast fat-suppressed 3D-GRE T1-WI at the arterial (C) and portal venous (D) phases. A thick-walled oval shaped lesion is present on the right hepatic lobe (white arrow, A-D), showing an air/fluid level content (black arrow, A-D). There is an associated halo of edema surrounding the lesion, showing low signal intensity on T1-WI (A), high signal intensity on T2-WI (B) and marked enhancement after gadolinium administration (C and D), which is consistent with active inflammation. GRE: Gradient-echo; FSE: Fast spinecho; T1-WI: T1-weighted images.
Figure 7 Hepatocellular carcinoma.
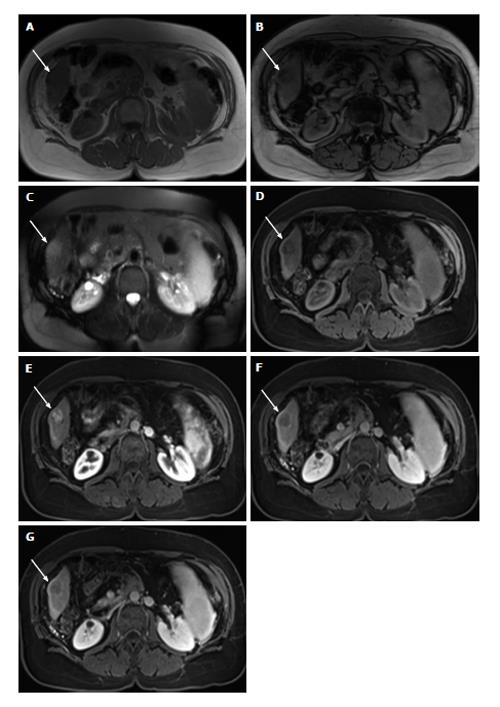
In- (A) and opposed-phase (B) GRE T1-WI, fat-suppressed FSE T2-WI (C), pre (D) and postcontrast fat-suppressed 3D-GRE T1-WI at the arterial (E), portal venous (F) and interstitial (G) phases. There is a small peripheral lesion on the right lobe of a cirrhotic liver (arrow, A-G), showing drop of signal intensity on opposed-phase (B) comparing with the in-phase (A) images, which is suggestive of fat content. The lesion demonstrates mild high signal intensity on T2-WI (C), low signal intensity on pre-contrast T1-WI (C), heterogeneous enhancement on early post-contrast (E) and subsequent washout with associated pseudocapsule on delayed post-contrast images (F and G), in keeping with a small fat-containing hepatocellular carcinoma. GRE: Gradient-echo; FSE: Fast spinecho; T1-WI: T1-weighted images.
Figure 8 Intrahepatic cholangiocarcinoma.
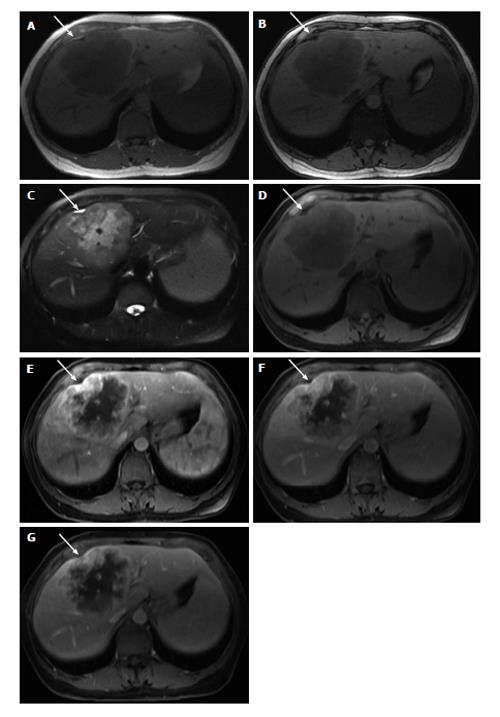
In- (A) and opposed-phase (B) GRE T1-WI, fat-suppressed FSE T2-WI (C), pre (D) and postcontrast fat-suppressed 3D-GRE T1-WI at the arterial (E), portal venous (F) and interstitial (G) phases. The tumor shows low signal intensity on T1-WI (A, B and D), high signal intensity on T2-WI (C), and heterogeneous peripheral continuous and progressive enhancement on postgadolinium images (E-G). Associated capsular retraction is also noted (white arrow, A-G). GRE: Gradient-echo; FSE: Fast spinecho; T1-WI: T1-weighted images.
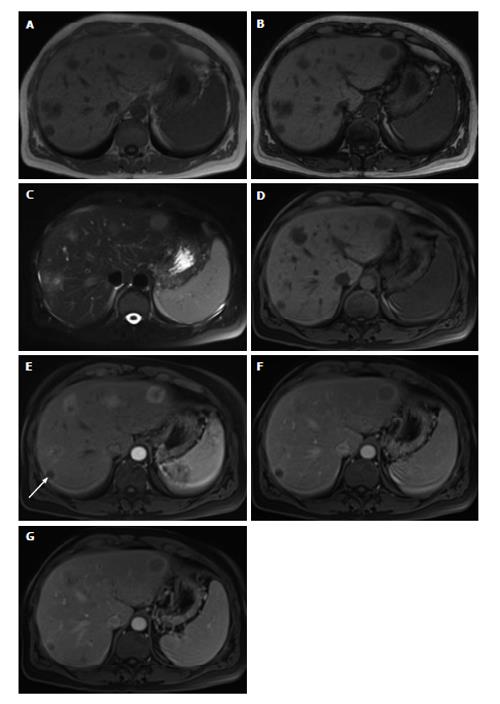
Figure 9 Metastases.
In- (A) and opposed-phase (B) GRE T1-WI, fat-suppressed FSE T2-WI (C), pre (D) and postcontrast fat-suppressed 3D-GRE T1-WI at the arterial (E), portal venous (F) and interstitial (G) phases. Multiple metastases are present throughout the liver, showing low signal intensity on T1-WI (A, B and D) and high signal intensity on T2-WI. Most of these lesions show hypervascular characteristics, while one in segment VII (arrow, E) shows ring enhancement. Late washout is perceived, a feature that is characteristic of carcinoid metastases (G). GRE: Gradient-echo; FSE: Fast spinecho; T1-WI: T1-weighted images.
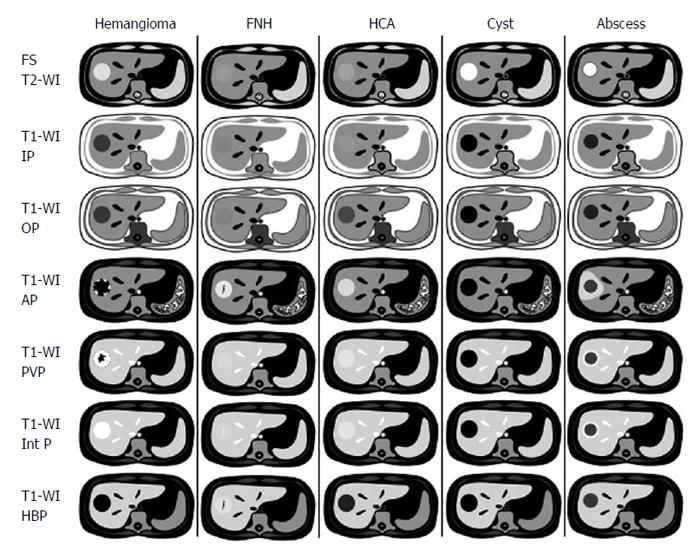
Figure 10 Stereotypical simplified schema, showing magnetic resonance imaging features of benign focal liver lesions.
FNH: Focal nodular hyperplasia; HCA: Hepatocellular adenoma; FS T2-WI: Fat-suppressed T2-weighted image; T1-WI IP: T1-weighted in-phase image; T1-WI OP: T1-weighted out-of-phase image; T1-WI AP: Post-contrast fat-suppressed T1-weighted image at the late arterial phase; T1-WI PVP: Post-contrast fat-suppressed T1-weighted image at the portal-venous phase; T1-WI Inter P: Post-contrast fat-suppressed T1-weighted image at the interstitial phase; T1-WI HBP: Post-contrast fat-suppressed T1-weighted image at the hepatobiliary phase (with hepatocyte-specific contrast agent).
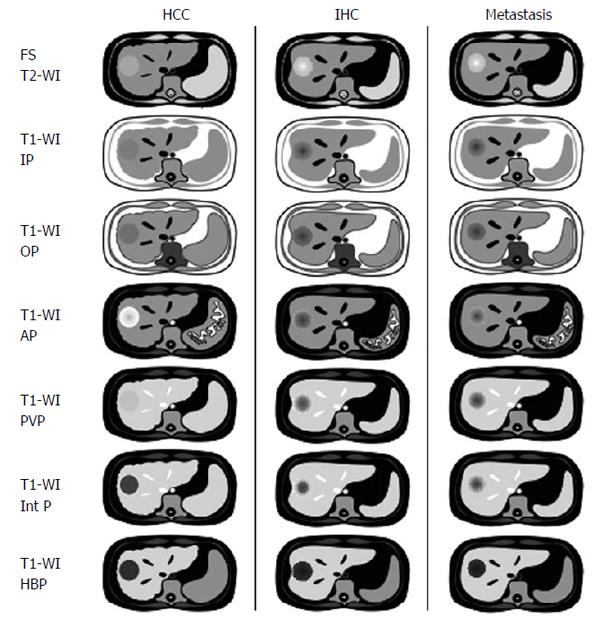
Figure 11 Stereotypical simplified schema, showing magnetic resonance imaging features of malignant focal liver lesions.
The represented metastasis exemplifies the typical appearance of a hypovascular metastasis (the most common type). FS T2-WI: Fat-suppressed T2-weighted image; T1-WI IP: T1-weighted in-phase image; T1-WI OP: T1-weighted out-of-phase image; T1-WI AP: Post-contrast fat-suppressed T1-weighted image at the late arterial phase; T1-WI PVP: Post-contrast fat-suppressed T1-weighted image at the portal-venous phase; T1-WI Inter P: Post-contrast fat-suppressed T1-weighted image at the interstitial phase; T1-WI HBP: Post-contrast fat-suppressed T1-weighted image at the hepatobiliary phase (with hepatocyte-specific contrast agent); HCC: Hepatocellular carcinomas; IHC: Intrahepatic cholangiocarcinomas.
Figure 12 Multiple focal nodular hyperplasias.
In- (A) and opposed-phase (B) GRE T1-WI, fat-suppressed FSE T2-WI (C), pre (D) and post hepatocyte-specific contrast agent (Eovist®) fat-suppressed 3D-GRE T1-WI at the arterial (E), portal venous (F), interstitial (G) and hepatobiliary (H) phases. There are two focal nodular hyperplasias on the left lobe (white arrows) and one small FNH on the right lobe (black arrow). The liver parenchyma shows drop of signal in the opposed-phase (B) comparing to the in-phase images (A), indicating moderate parenchymal fat deposition. Note that the lesions do not show drop in signal in the opposed-phase (B). All lesions are isointense comparing to the surrounding liver on T2-WI (C), showing uniform blush on the early post-contrast images (E). In this case the lesions enhancement do not fade to isointensity on the delayed post-contrast images (F and G) due to the presence of moderate fat deposition in the liver parenchyma. On the hepatobiliary phase, 20 min after the administration the hepatocyte-specific contrast agent, the lesions show uptake of the contrast agent. GRE: Gradient-echo; FSE: Fast spinecho; T1-WI: T1-weighted images.
Figure 13 Adenomatosis.
In- (A) and opposed-phase (B) GRE T1-WI, fat-suppressed FSE T2-WI (C), pre (D) and post hepatocyte-specific contrast agent (Eovist®) fat-suppressed 3D-GRE T1-WI at the arterial (E), portal venous (F), interstitial (G) and hepatobiliary (H) phases. There are multiple lesions (> 10 in number) scattered throughout the hepatic parenchyma, barely visible on unenhanced T1-WI (A, B and D) and hyperintense on T2-WI (C). The lesions show arterial enhancement (E), which fades to almost isointensity on the delayed post-contrast images (F and G). On the hepatobiliary phase, acquired 20 min after the hepatocyte-specific contrast agent, all lesions appear with low signal intensity comparing to the surrounding liver. GRE: Gradient-echo; FSE: Fast spinecho; T1-WI: T1-weighted images.
- Citation: Matos AP, Velloni F, Ramalho M, AlObaidy M, Rajapaksha A, Semelka RC. Focal liver lesions: Practical magnetic resonance imaging approach. World J Hepatol 2015; 7(16): 1987-2008
- URL: https://www.wjgnet.com/1948-5182/full/v7/i16/1987.htm
- DOI: https://dx.doi.org/10.4254/wjh.v7.i16.1987


