
















Copyright: ©Author(s) 2026.
World J Hepatol. May 27, 2026; 18(5): 118622
Published online May 27, 2026. doi: 10.4254/wjh.v18.i5.118622
Published online May 27, 2026. doi: 10.4254/wjh.v18.i5.118622
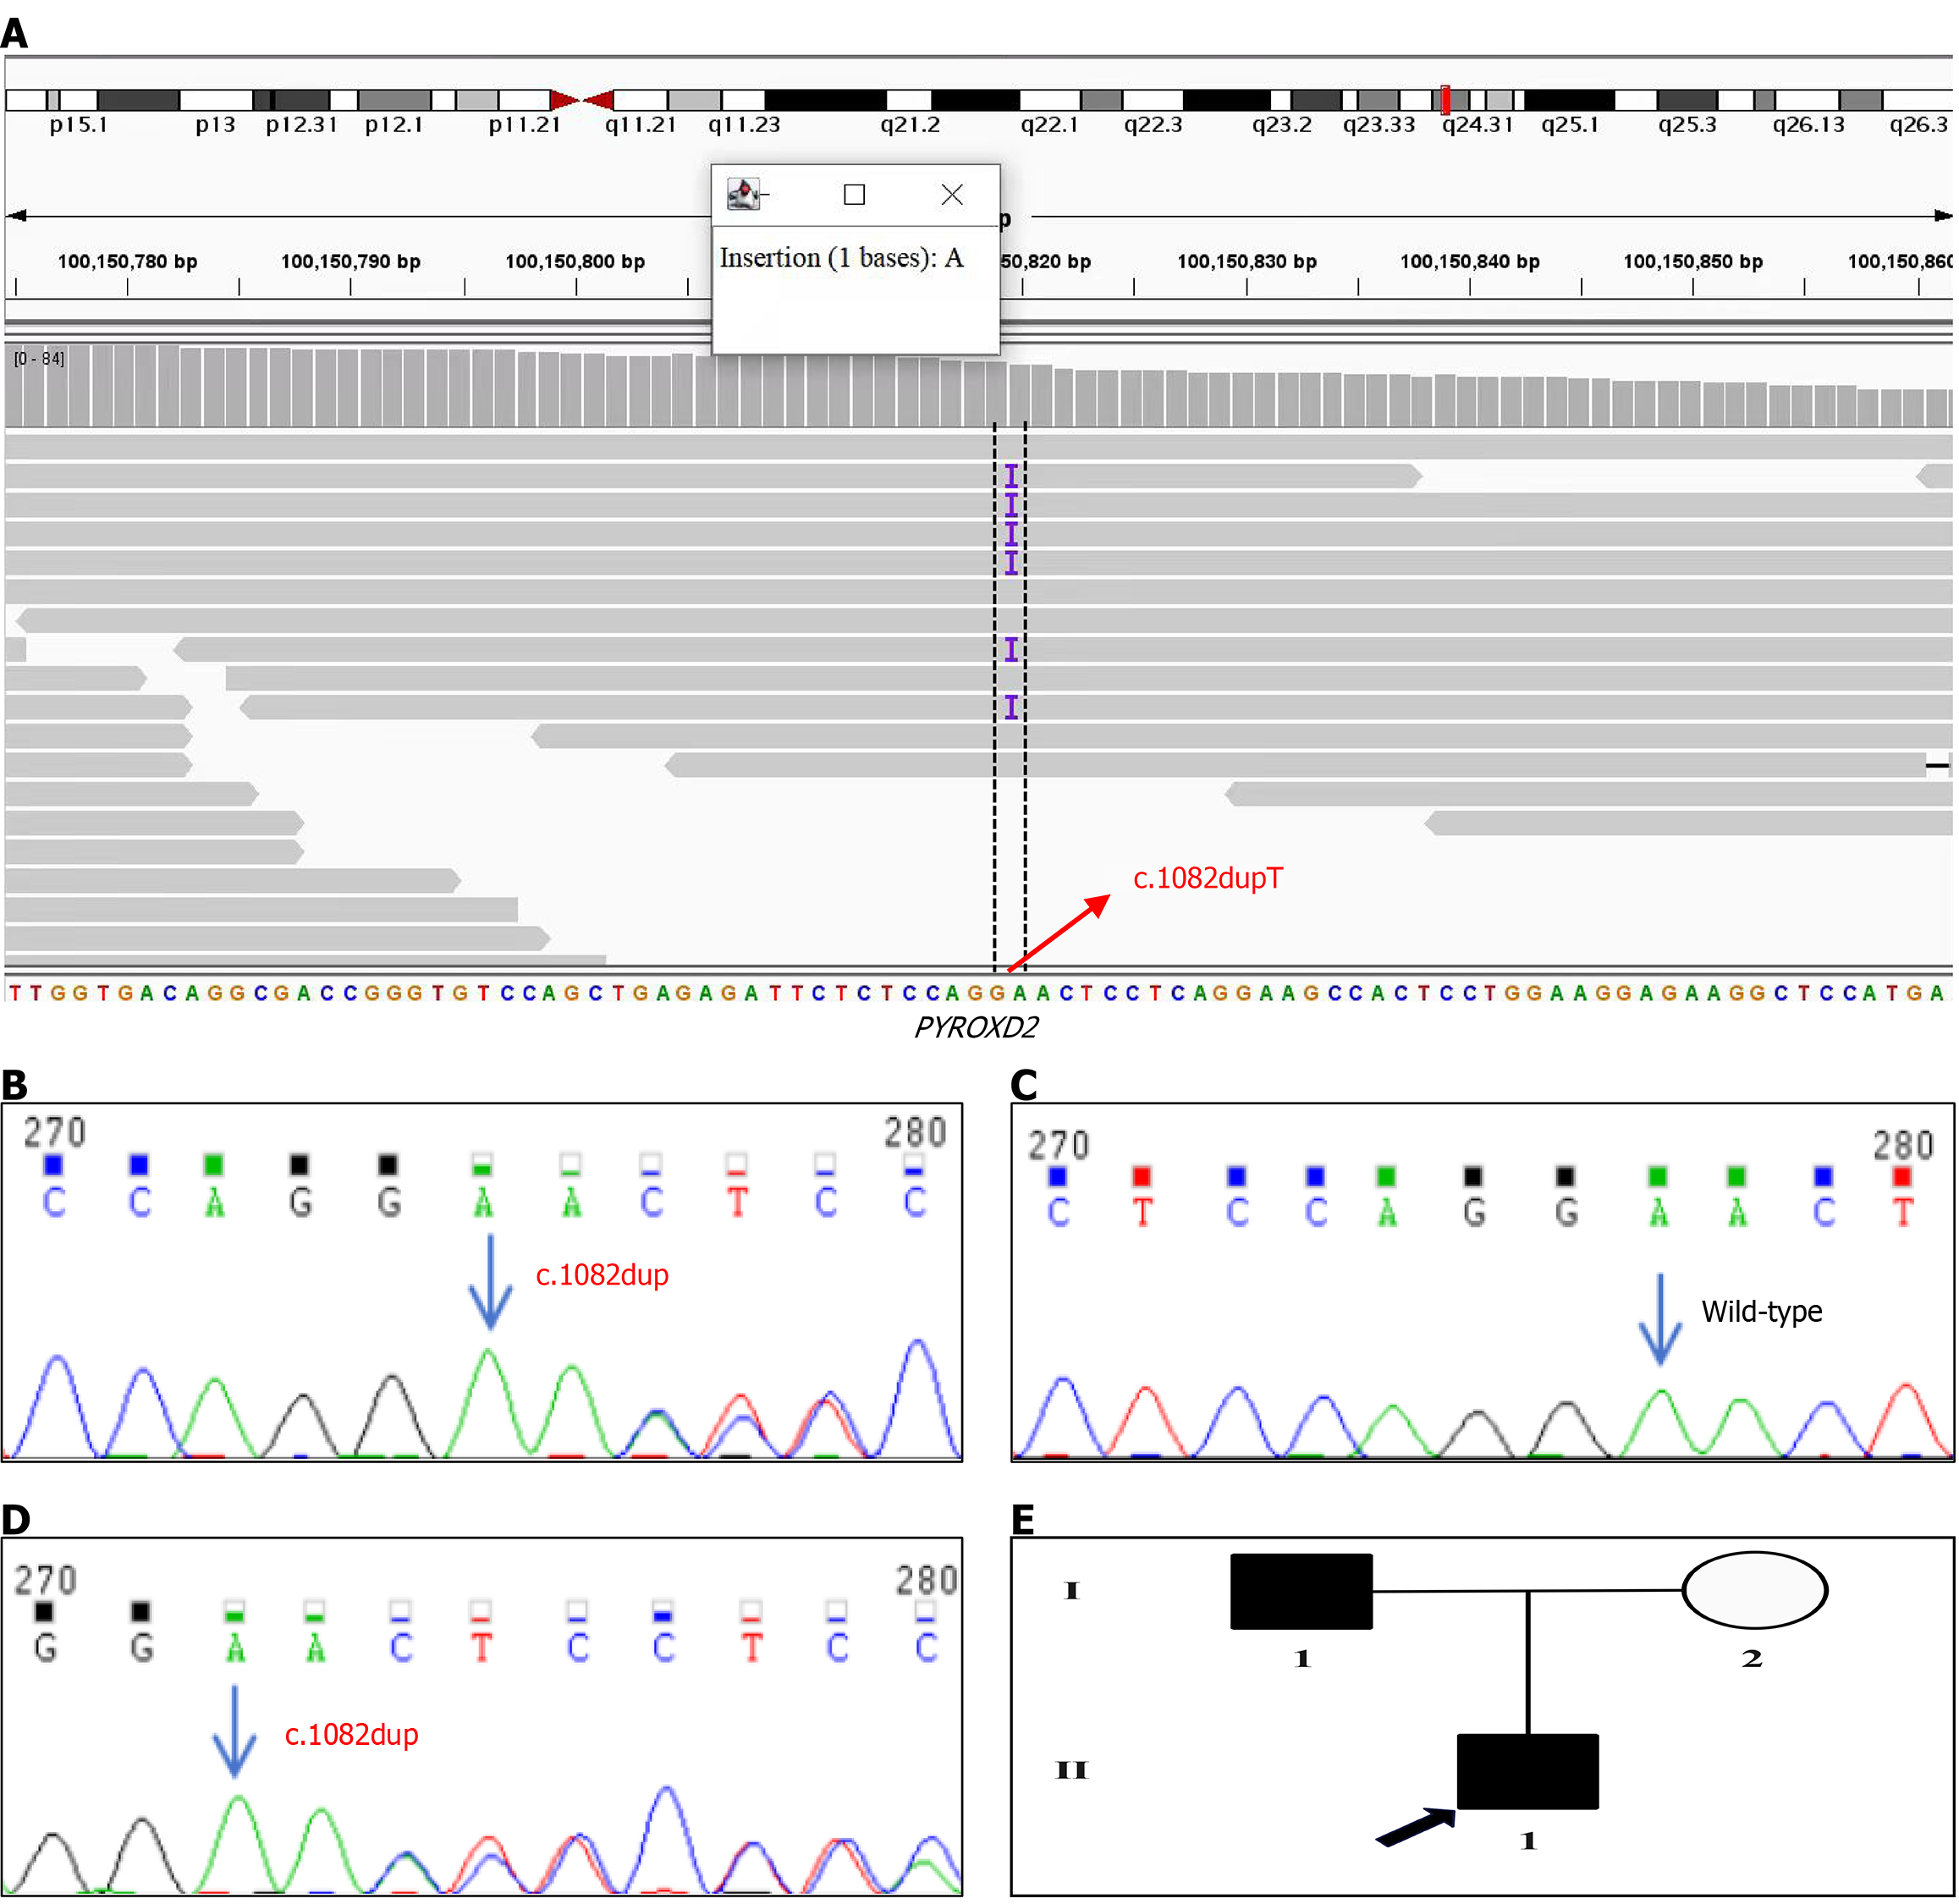
Figure 1 Gene mutation.
A: Whole-exome sequencing results of a PYROXD2 pathogenic variant in the patient; B: Sanger sequencing of the targeted PYROXD2 variation in the patient. The arrow indicates the alteration in the PYROXD2 gene, specifically the c.1082dupT variant, identified in the patient; C: Sanger sequencing of the targeted PYROXD2 variation in his family members. His mother carried the wild-type genotype; D: His father harbored the same variant identified in the patient; E: Pedigree of PYROXD2 mutation in the proband’s family. The proband (II-1) and his father (I-1) carried the heterozygous PYROXD2 mutation c.1082dupT (p.Phe361 Leu fs*50) while his mother carried the wild-type genotype.
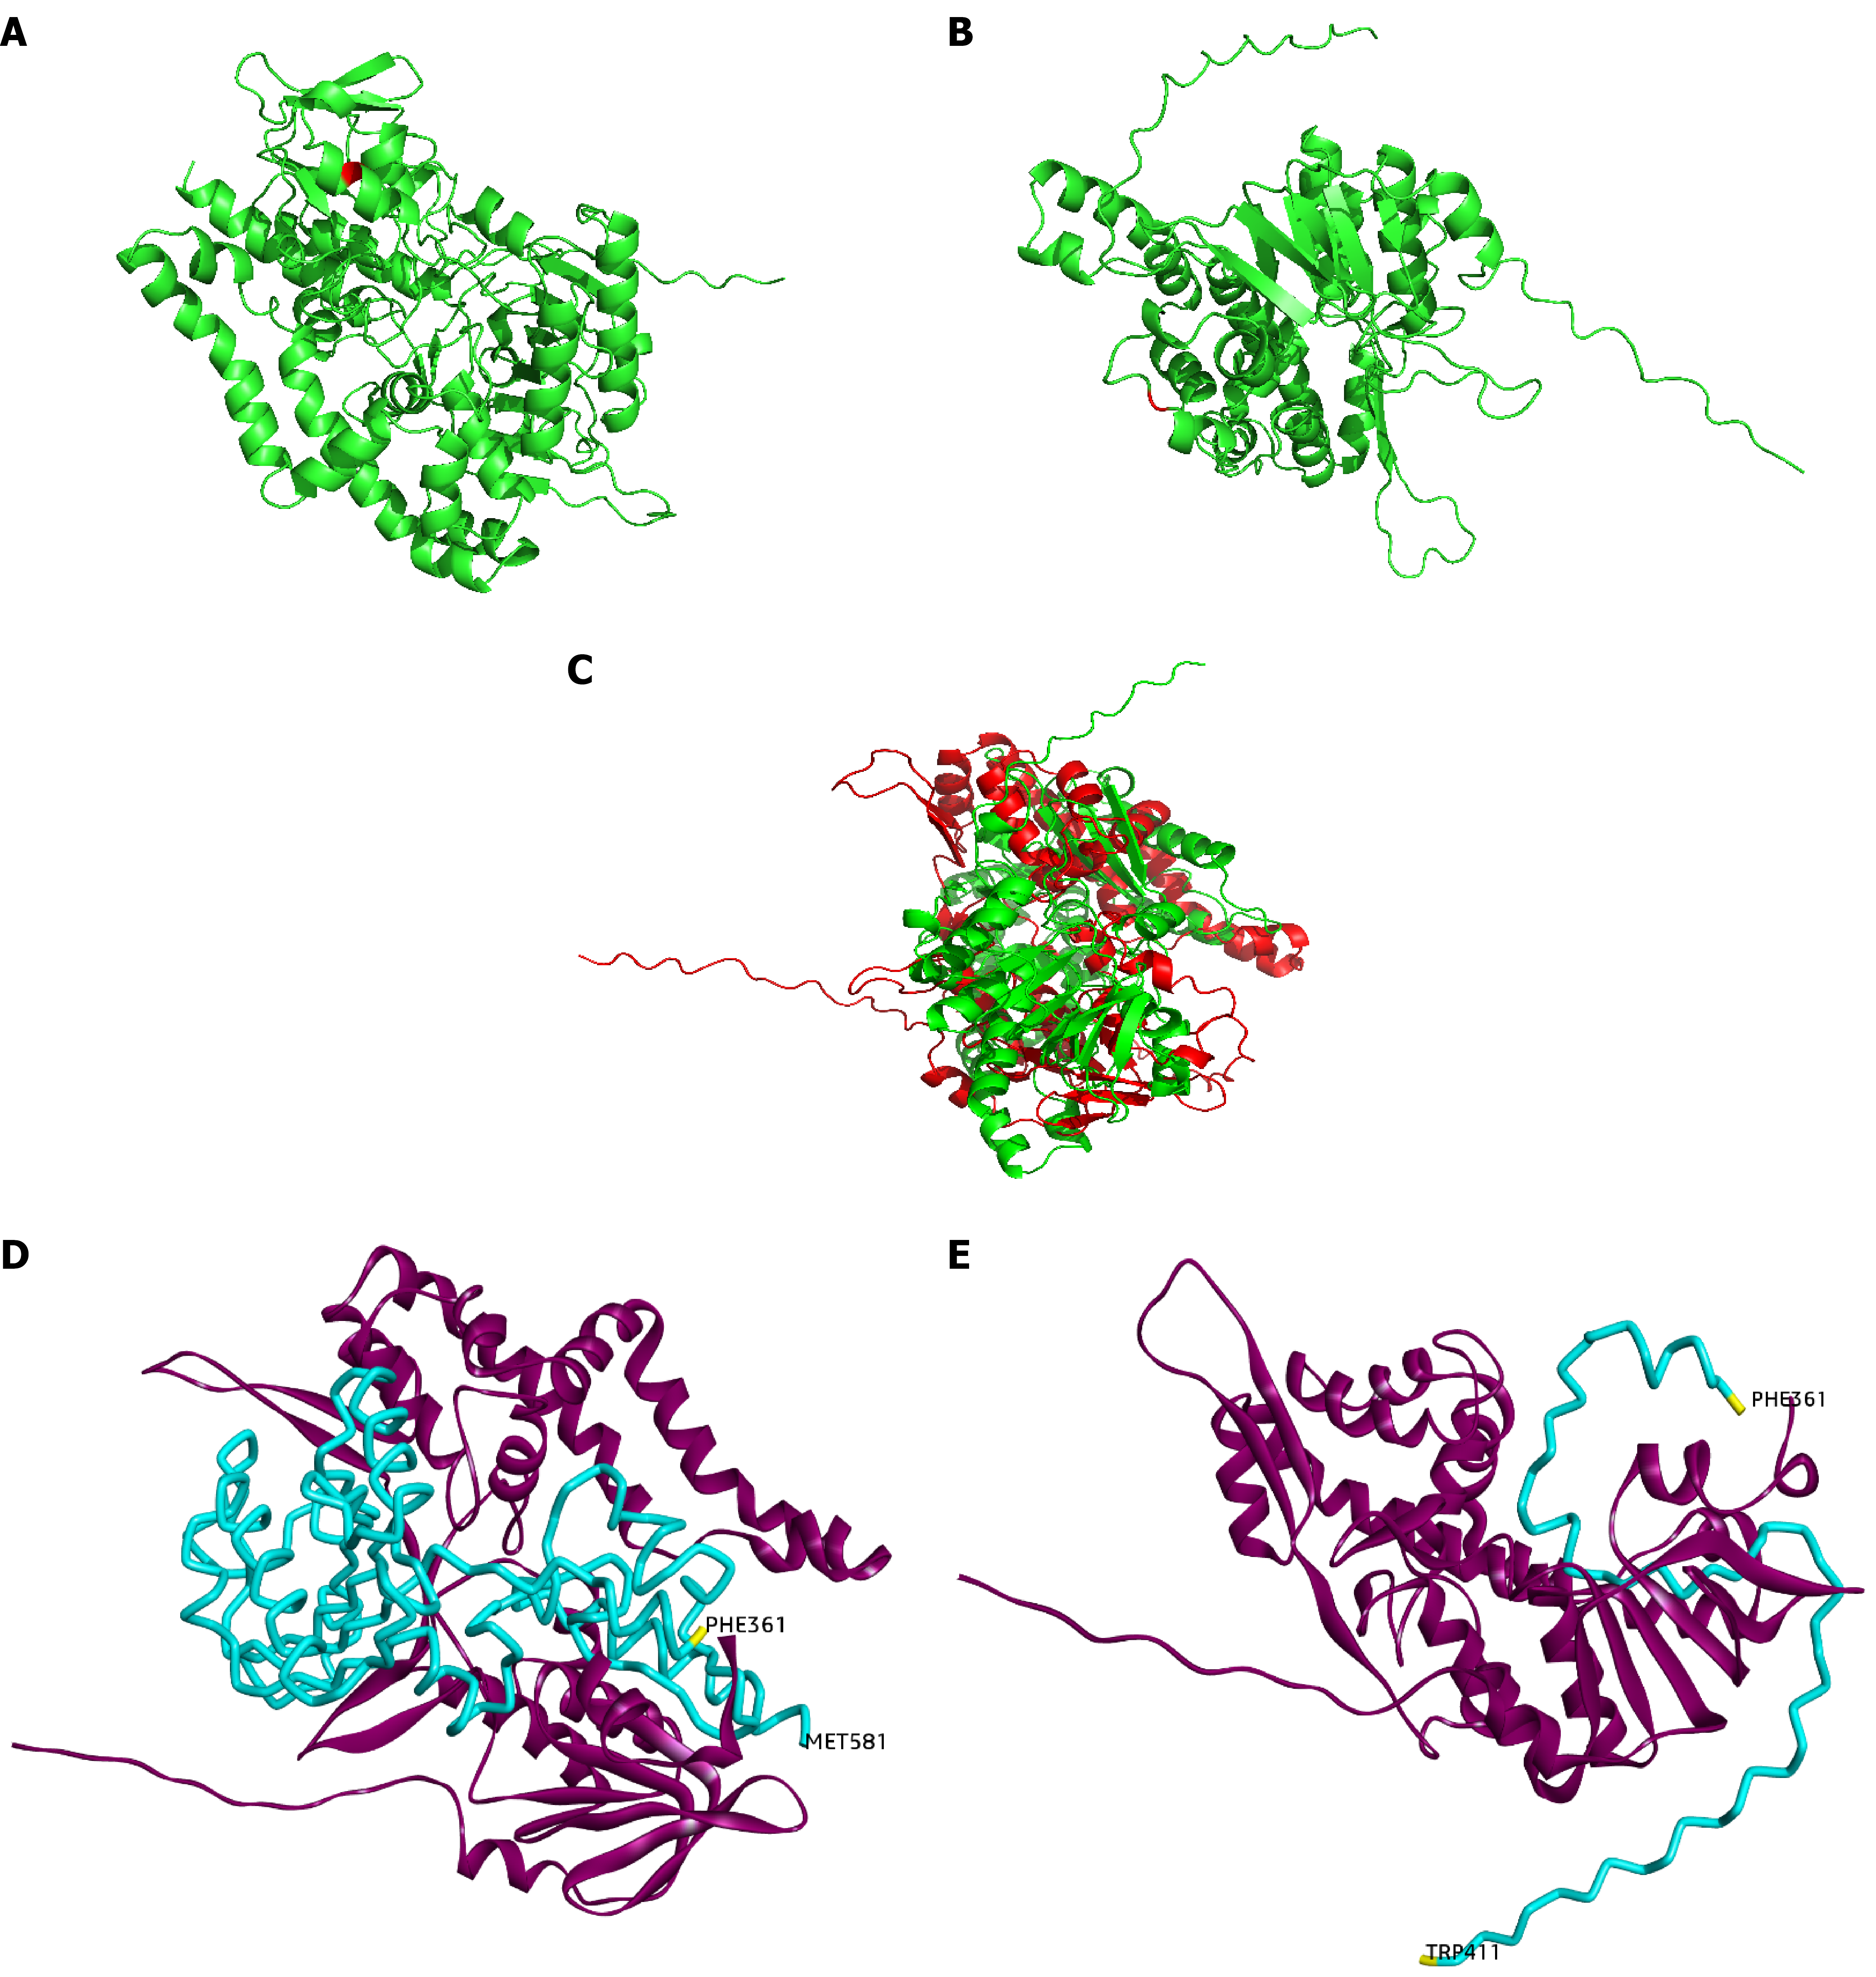
Figure 2 The 3D protein model, illustrating the location of the c.
1082dupT variant in the PYROXD2 protein. A: Wild-type PYROXD2 protein structure predicted by computational modeling; B: The mutant PYROXD2 protein structure, In the red highlighted region, proline substituted for leucine, simulated using PyMol; C: Overlap of the protein structures, with the mutant PYROXD2 protein shown in red and the wild-type PYROXD2 protein in green; D: In the wild-type PYROXD2 protein, the amino acid at position 581 is methionine; E: In the mutant PYROXD2 protein, a frameshift mutation results in the substitution of leucine with proline at position 362, leading to the introduction of a premature stop codon at position 411 in the amino acid sequence.
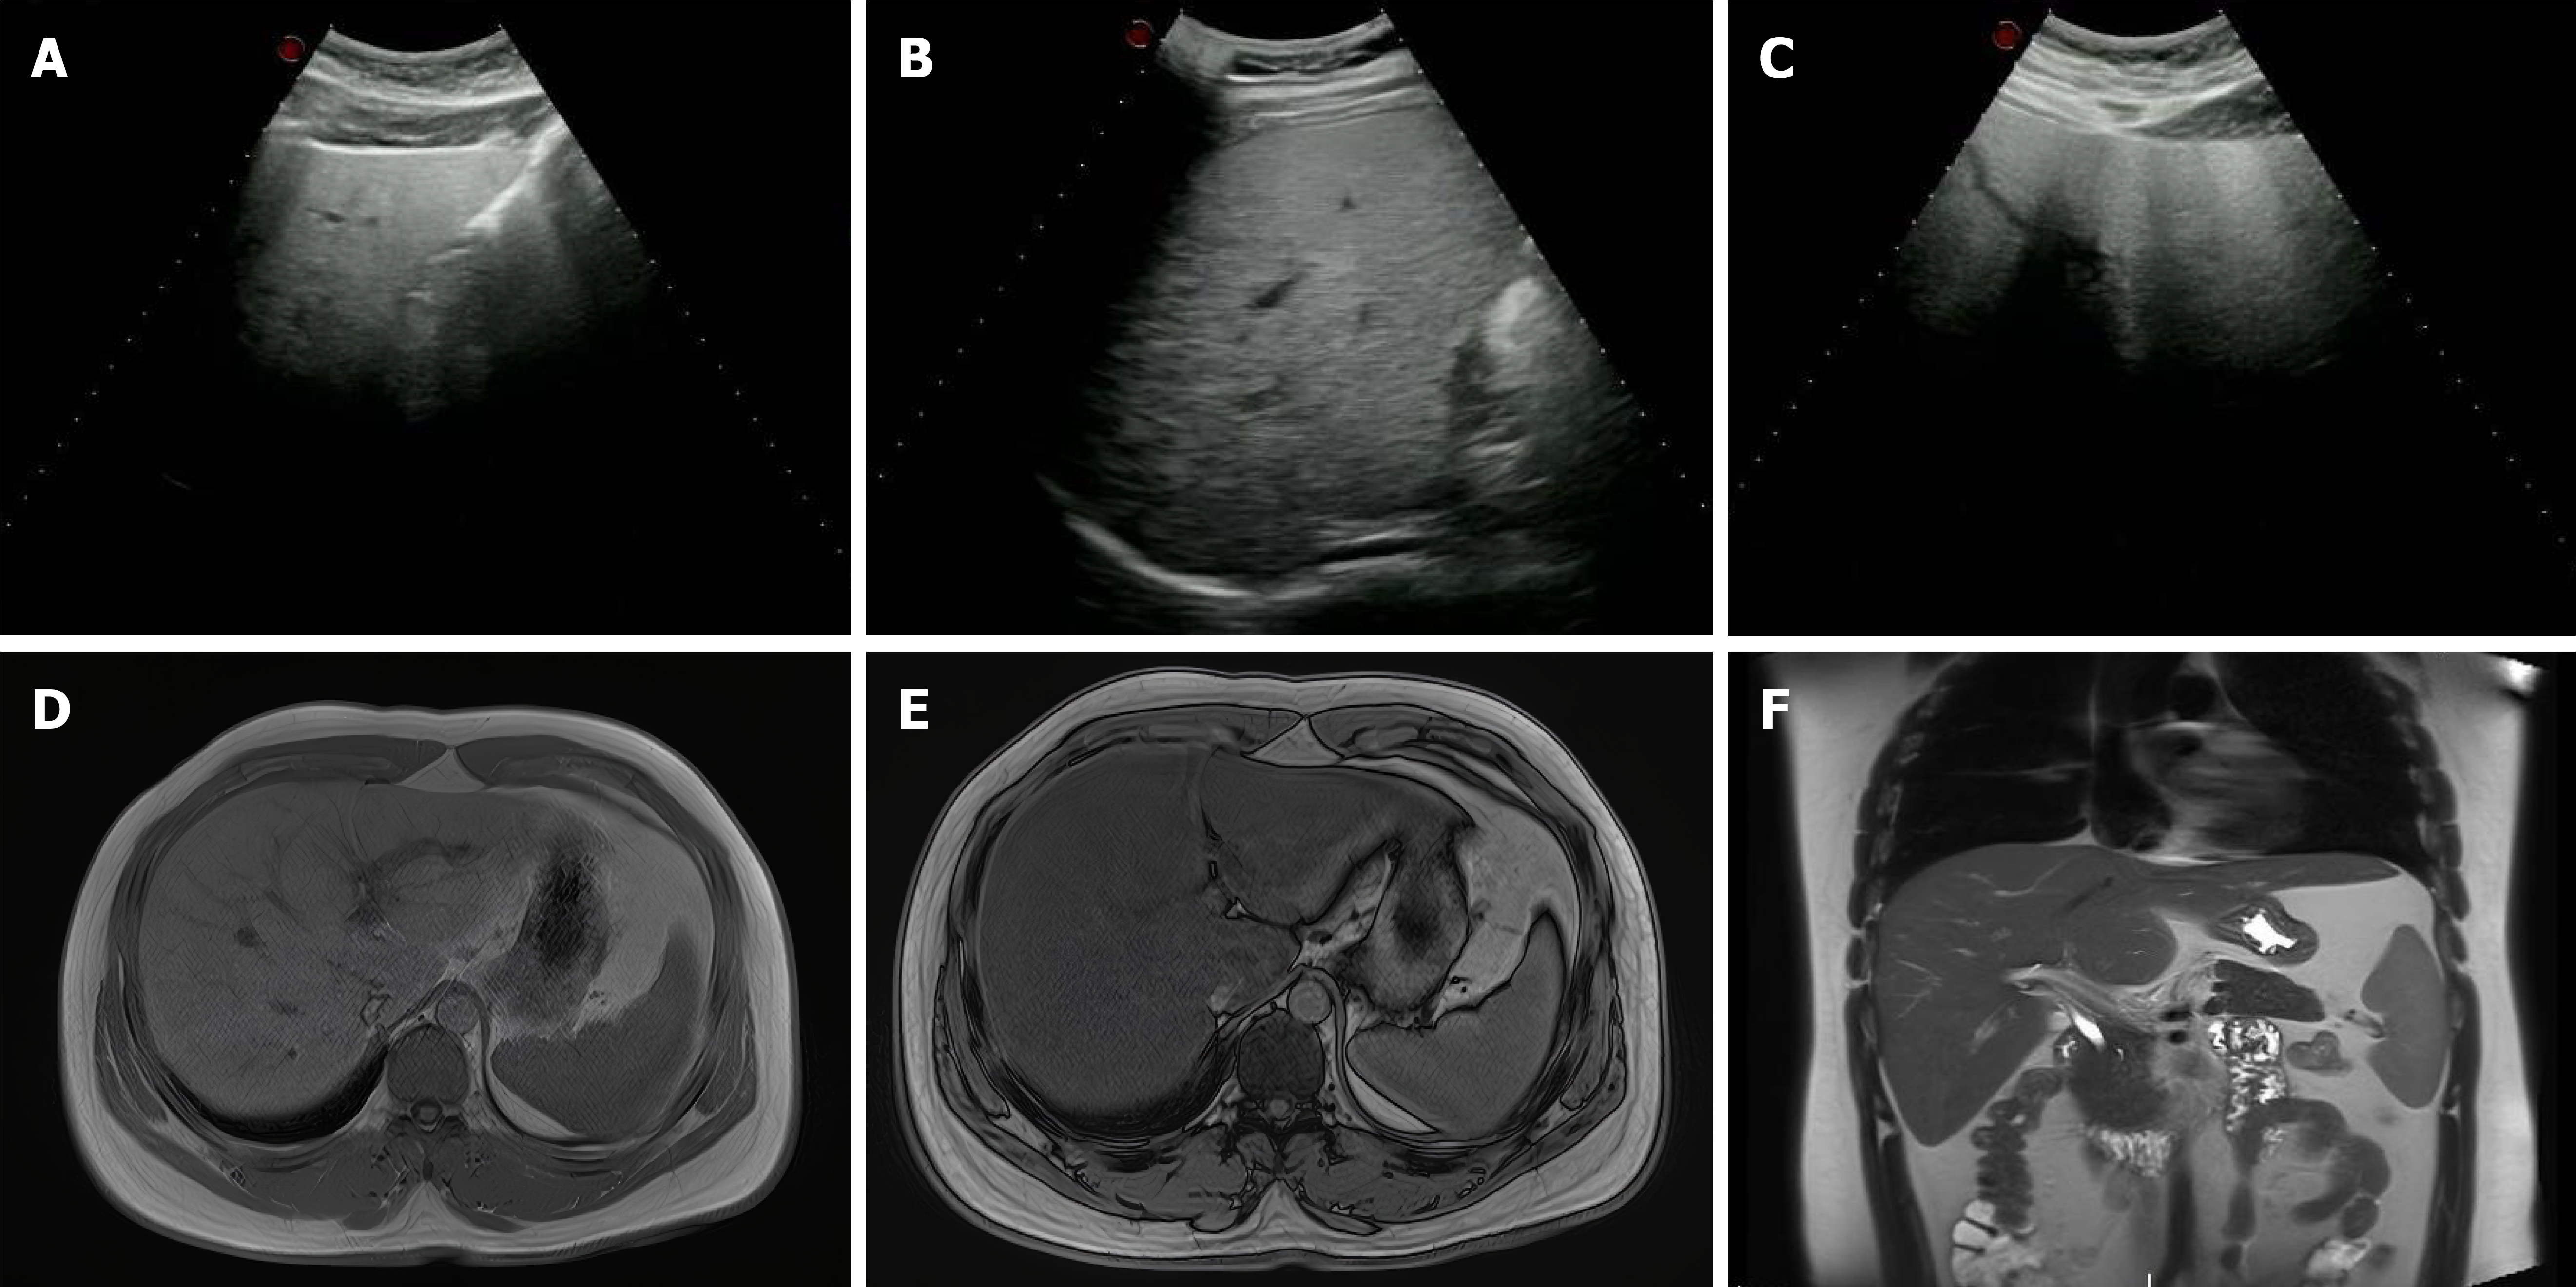
Figure 3 Imaging findings of the patient’s liver.
A-C: Abdominal ultrasound showed fatty liver; D-F: Fat accumulation in the liver as detected by magnetic resonance imaging, with contrast to the spleen shadow.

Figure 4 Liver biopsy.
A: Hematoxylin and eosin staining of the liver biopsy revealed disordered hepatic architecture with fibrosis, indicating fat vesicles and areas of inflammation (arrow) at 20 × magnification image; B: Panel A shows the image at 40 × magnification image (arrow); C: Masson’s trichrome staining of the liver biopsy demonstrates structural disruption and fibrosis of hepatic sinusoids (arrow) at 20 × magnification; D: Reticular fiber staining highlights liver fibrosis (arrow) at 20 × magnification.
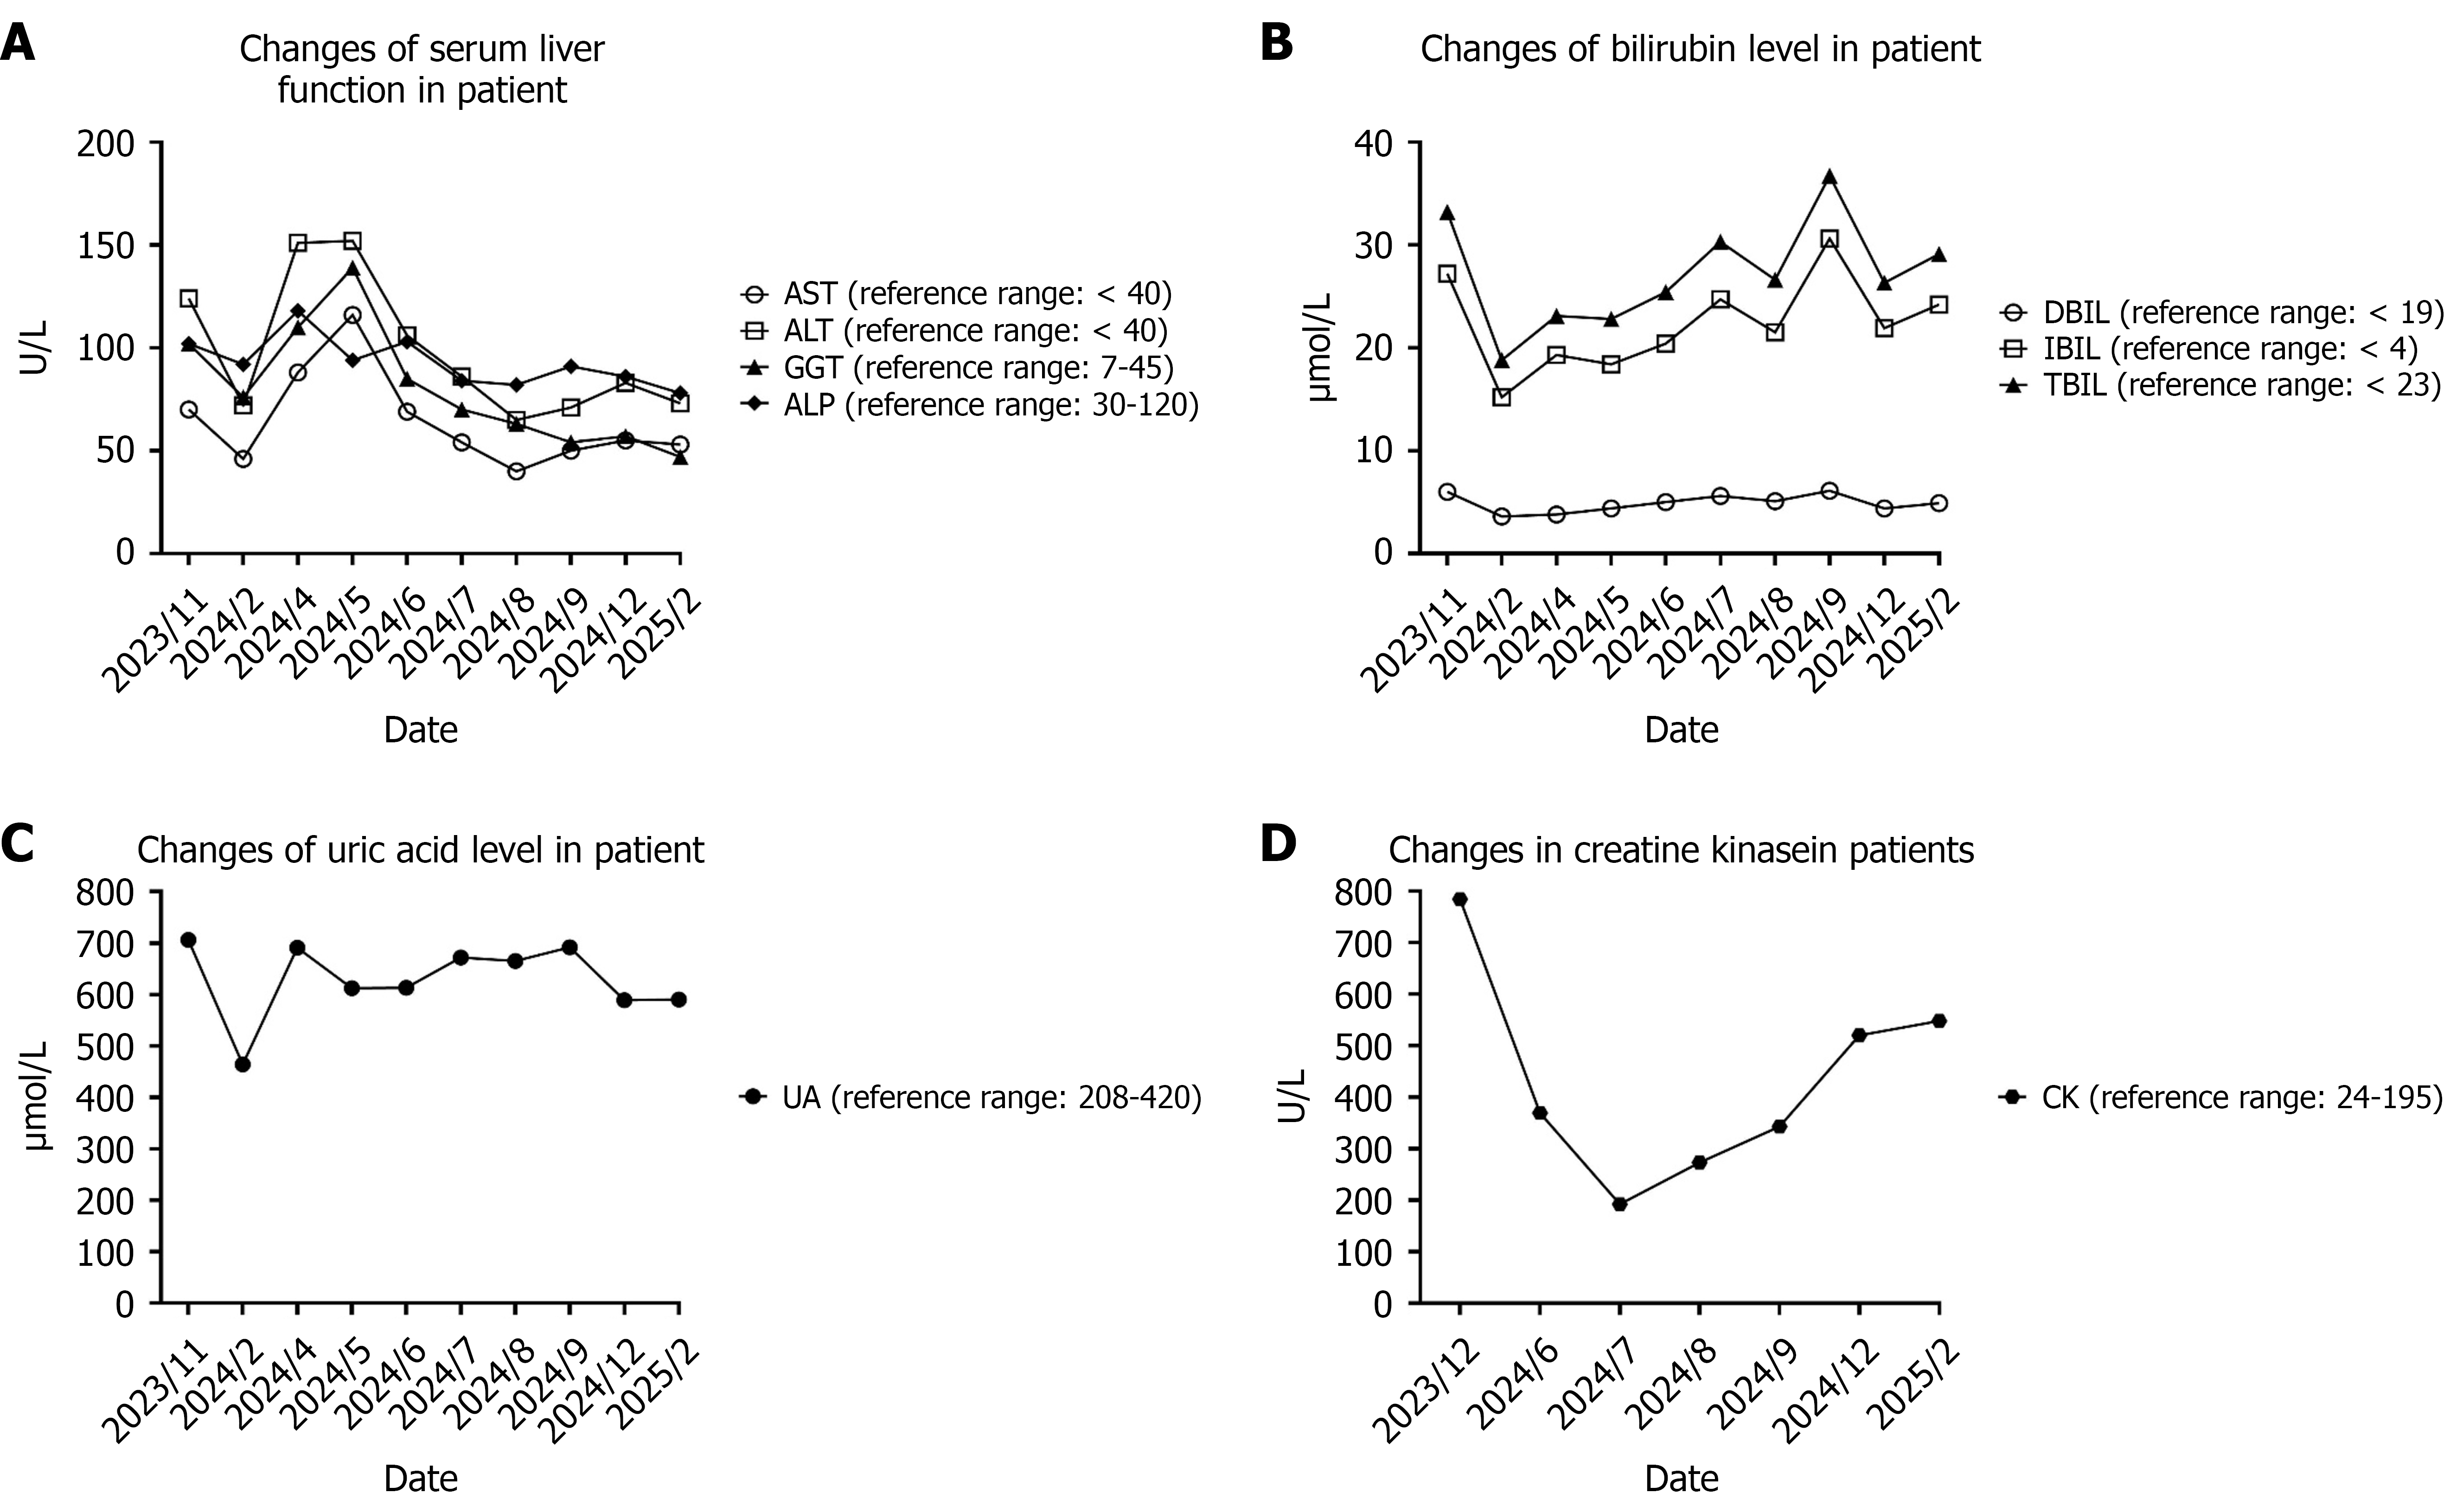
Figure 5 Changes in serum liver function, renal function, and creatine kinase level in the patient.
A: The patient’s serum aspartate transaminase, alanine aminotransferase, γ-glutamyl transferase, and alkaline phosphatase levels; B: The patient’s serum direct bilirubin, indirect bilirubin, and total bilirubin levels; C: The patient’s serum uric acid level; D: The patient’s serum creatine kinase level. AST: Aspartate aminotransferase; ALT: Alanine aminotransferase; GGT: γ-glutamyl transpeptidase; DBIL: Direct bilirubin; IBIL: Indirect bilirubin; TBIL: Total bilirubin CK: Creatine kinase; UA: Uric acid.
- Citation: Jiang ZY, Liu RQ, Tang MJ, Fan HD, Yang WJ, Gong L, Mi XX, Shi JP. Early-onset hepatic fibrosis linking to a novel PYROXD2 mutation: A case report. World J Hepatol 2026; 18(5): 118622
- URL: https://www.wjgnet.com/1948-5182/full/v18/i5/118622.htm
- DOI: https://dx.doi.org/10.4254/wjh.v18.i5.118622