
















Copyright: ©Author(s) 2026.
World J Hepatol. May 27, 2026; 18(5): 118040
Published online May 27, 2026. doi: 10.4254/wjh.v18.i5.118040
Published online May 27, 2026. doi: 10.4254/wjh.v18.i5.118040
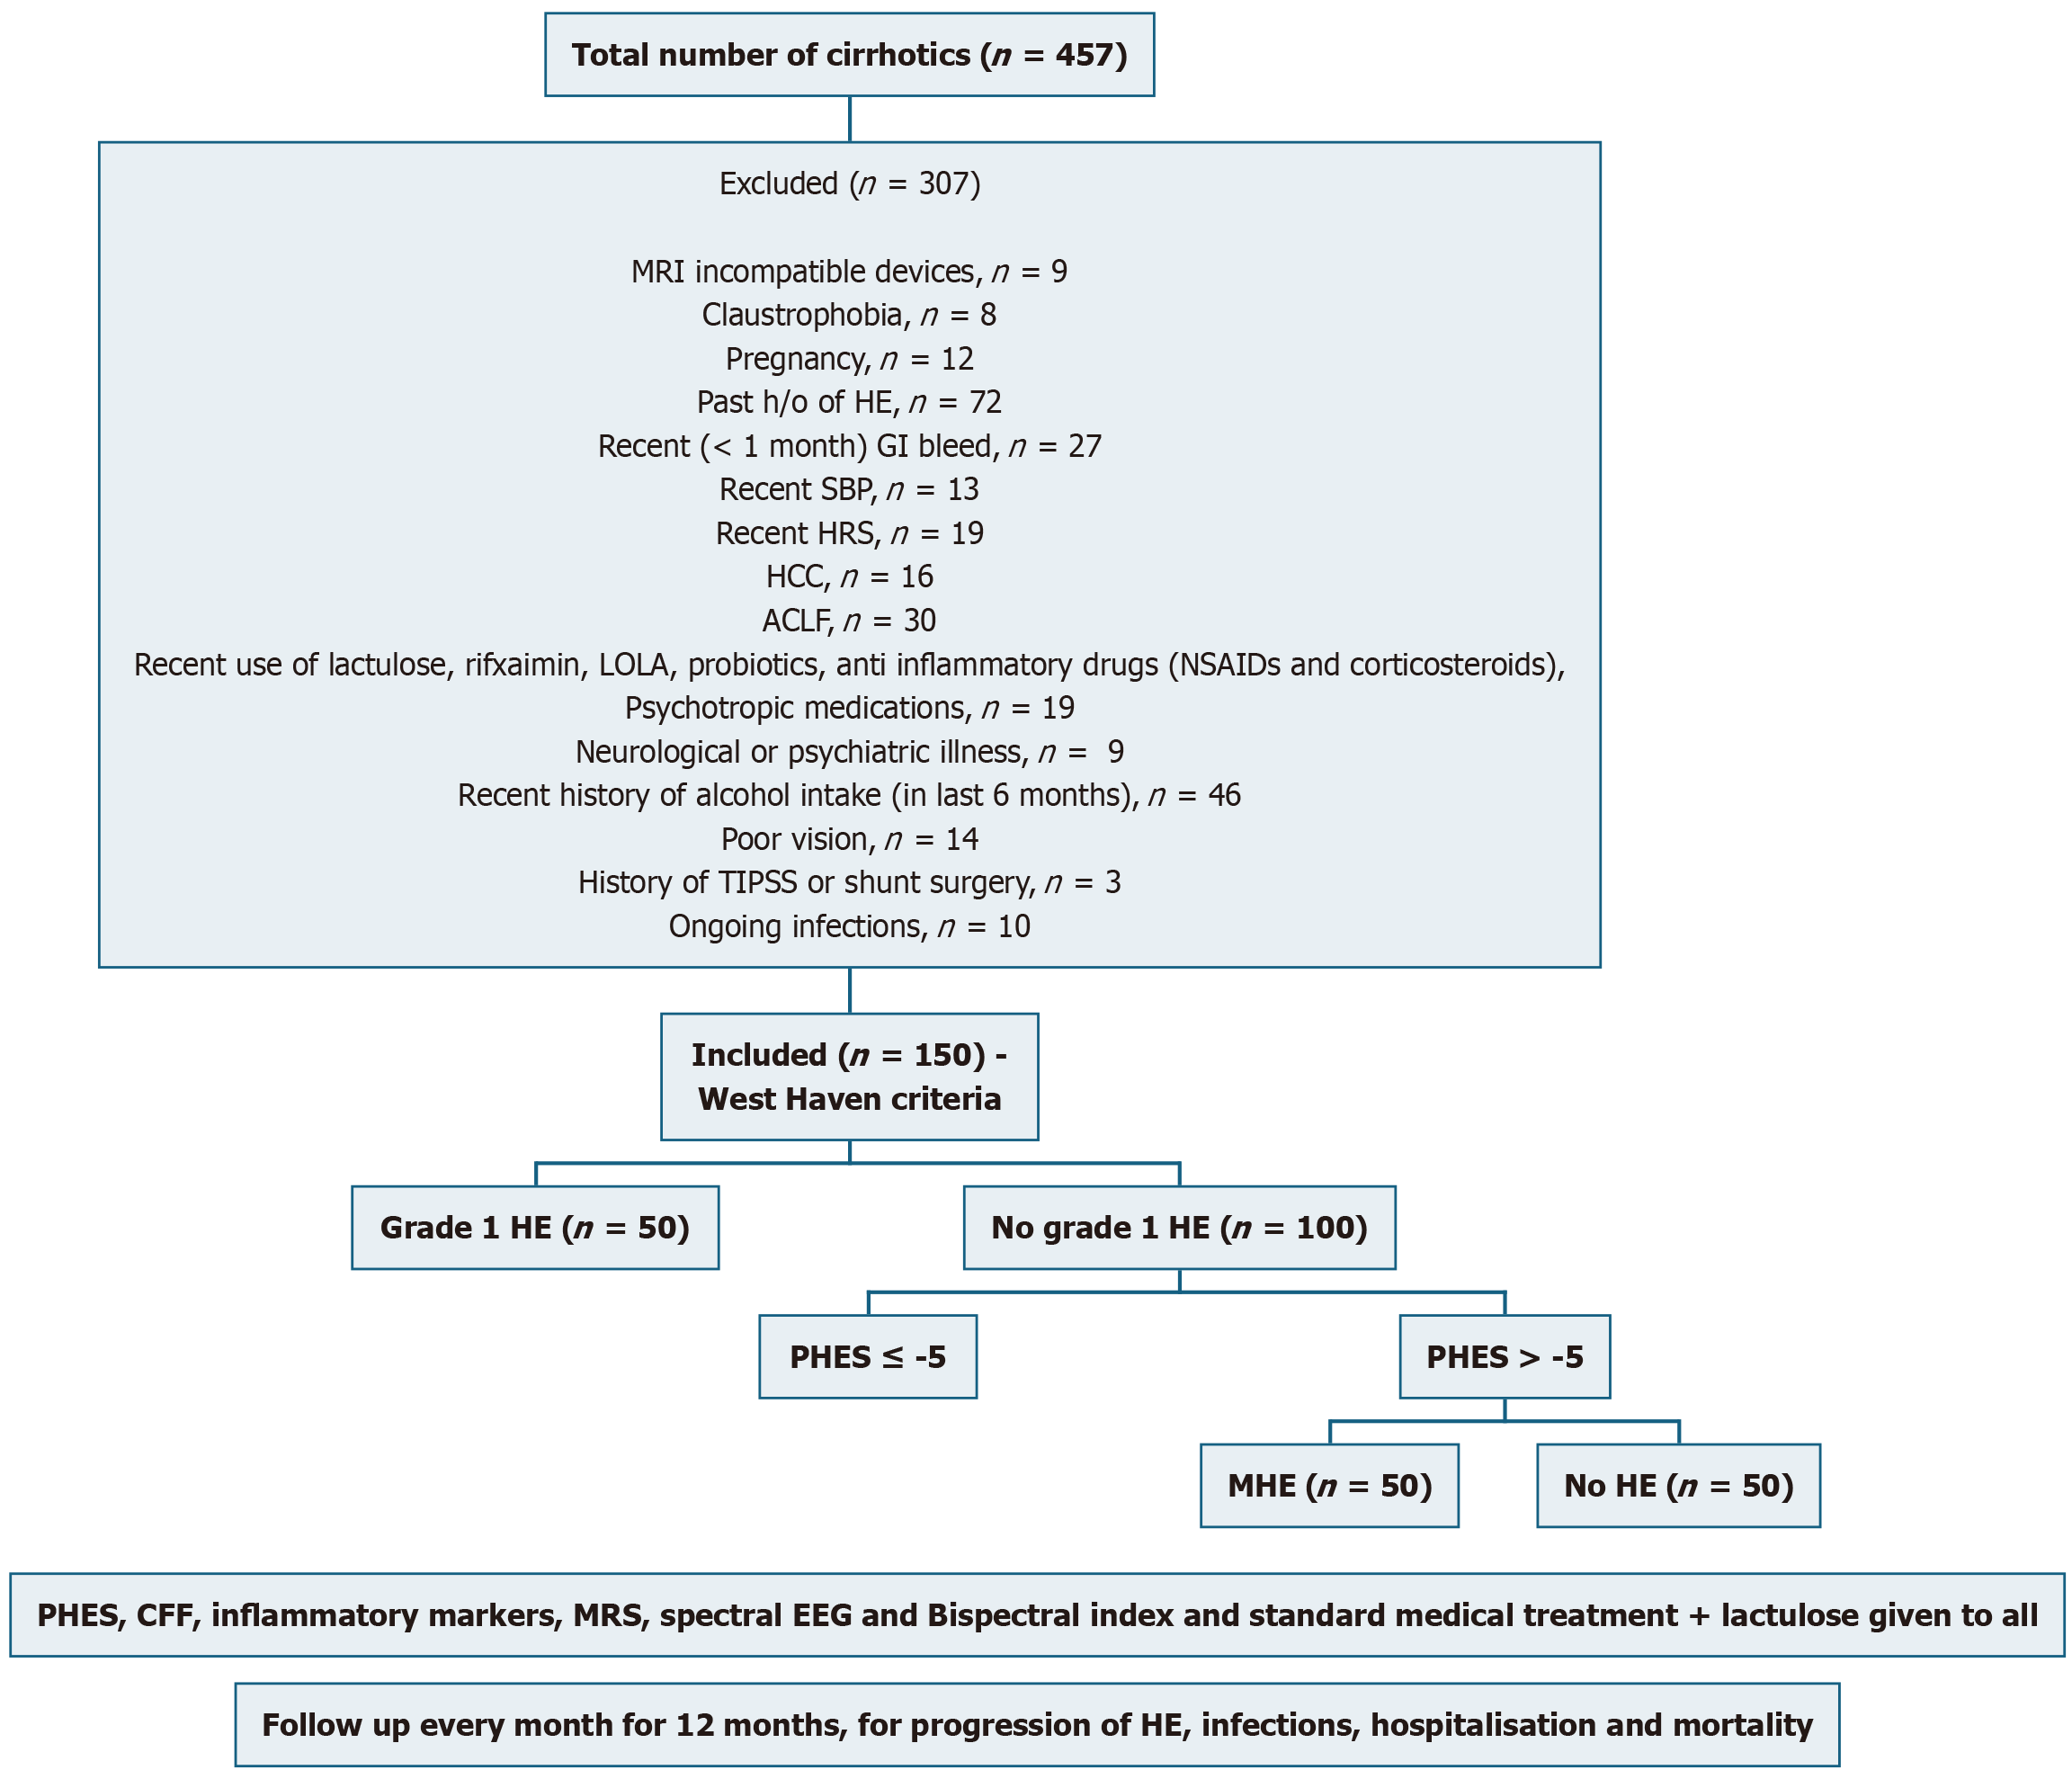
Figure 1 Study flowchart.
MRI: Magnetic resonance imaging; HE: Hepatic encephalopathy; GI: Gastrointestinal; SBP: Subacute bacterial peritonitis; HRS: Hepatorenal syndrome; HCC: Hepatocellular carcinoma; ACLF: Acute-on-chronic liver failure; LOLA: L-ornithine L-aspartate; NSAIDs: Non-steroidal anti-inflammatory drugs; TIPSS: Transjugular intrahepatic portosystemic shunt; PHES: Psychometric hepatic encephalopathy score; MHE: Minimal hepatic encephalopathy; CFF: Critical flicker frequency; MRS: Magnetic resonance spectroscopy; EEG: Electroencephalogram.
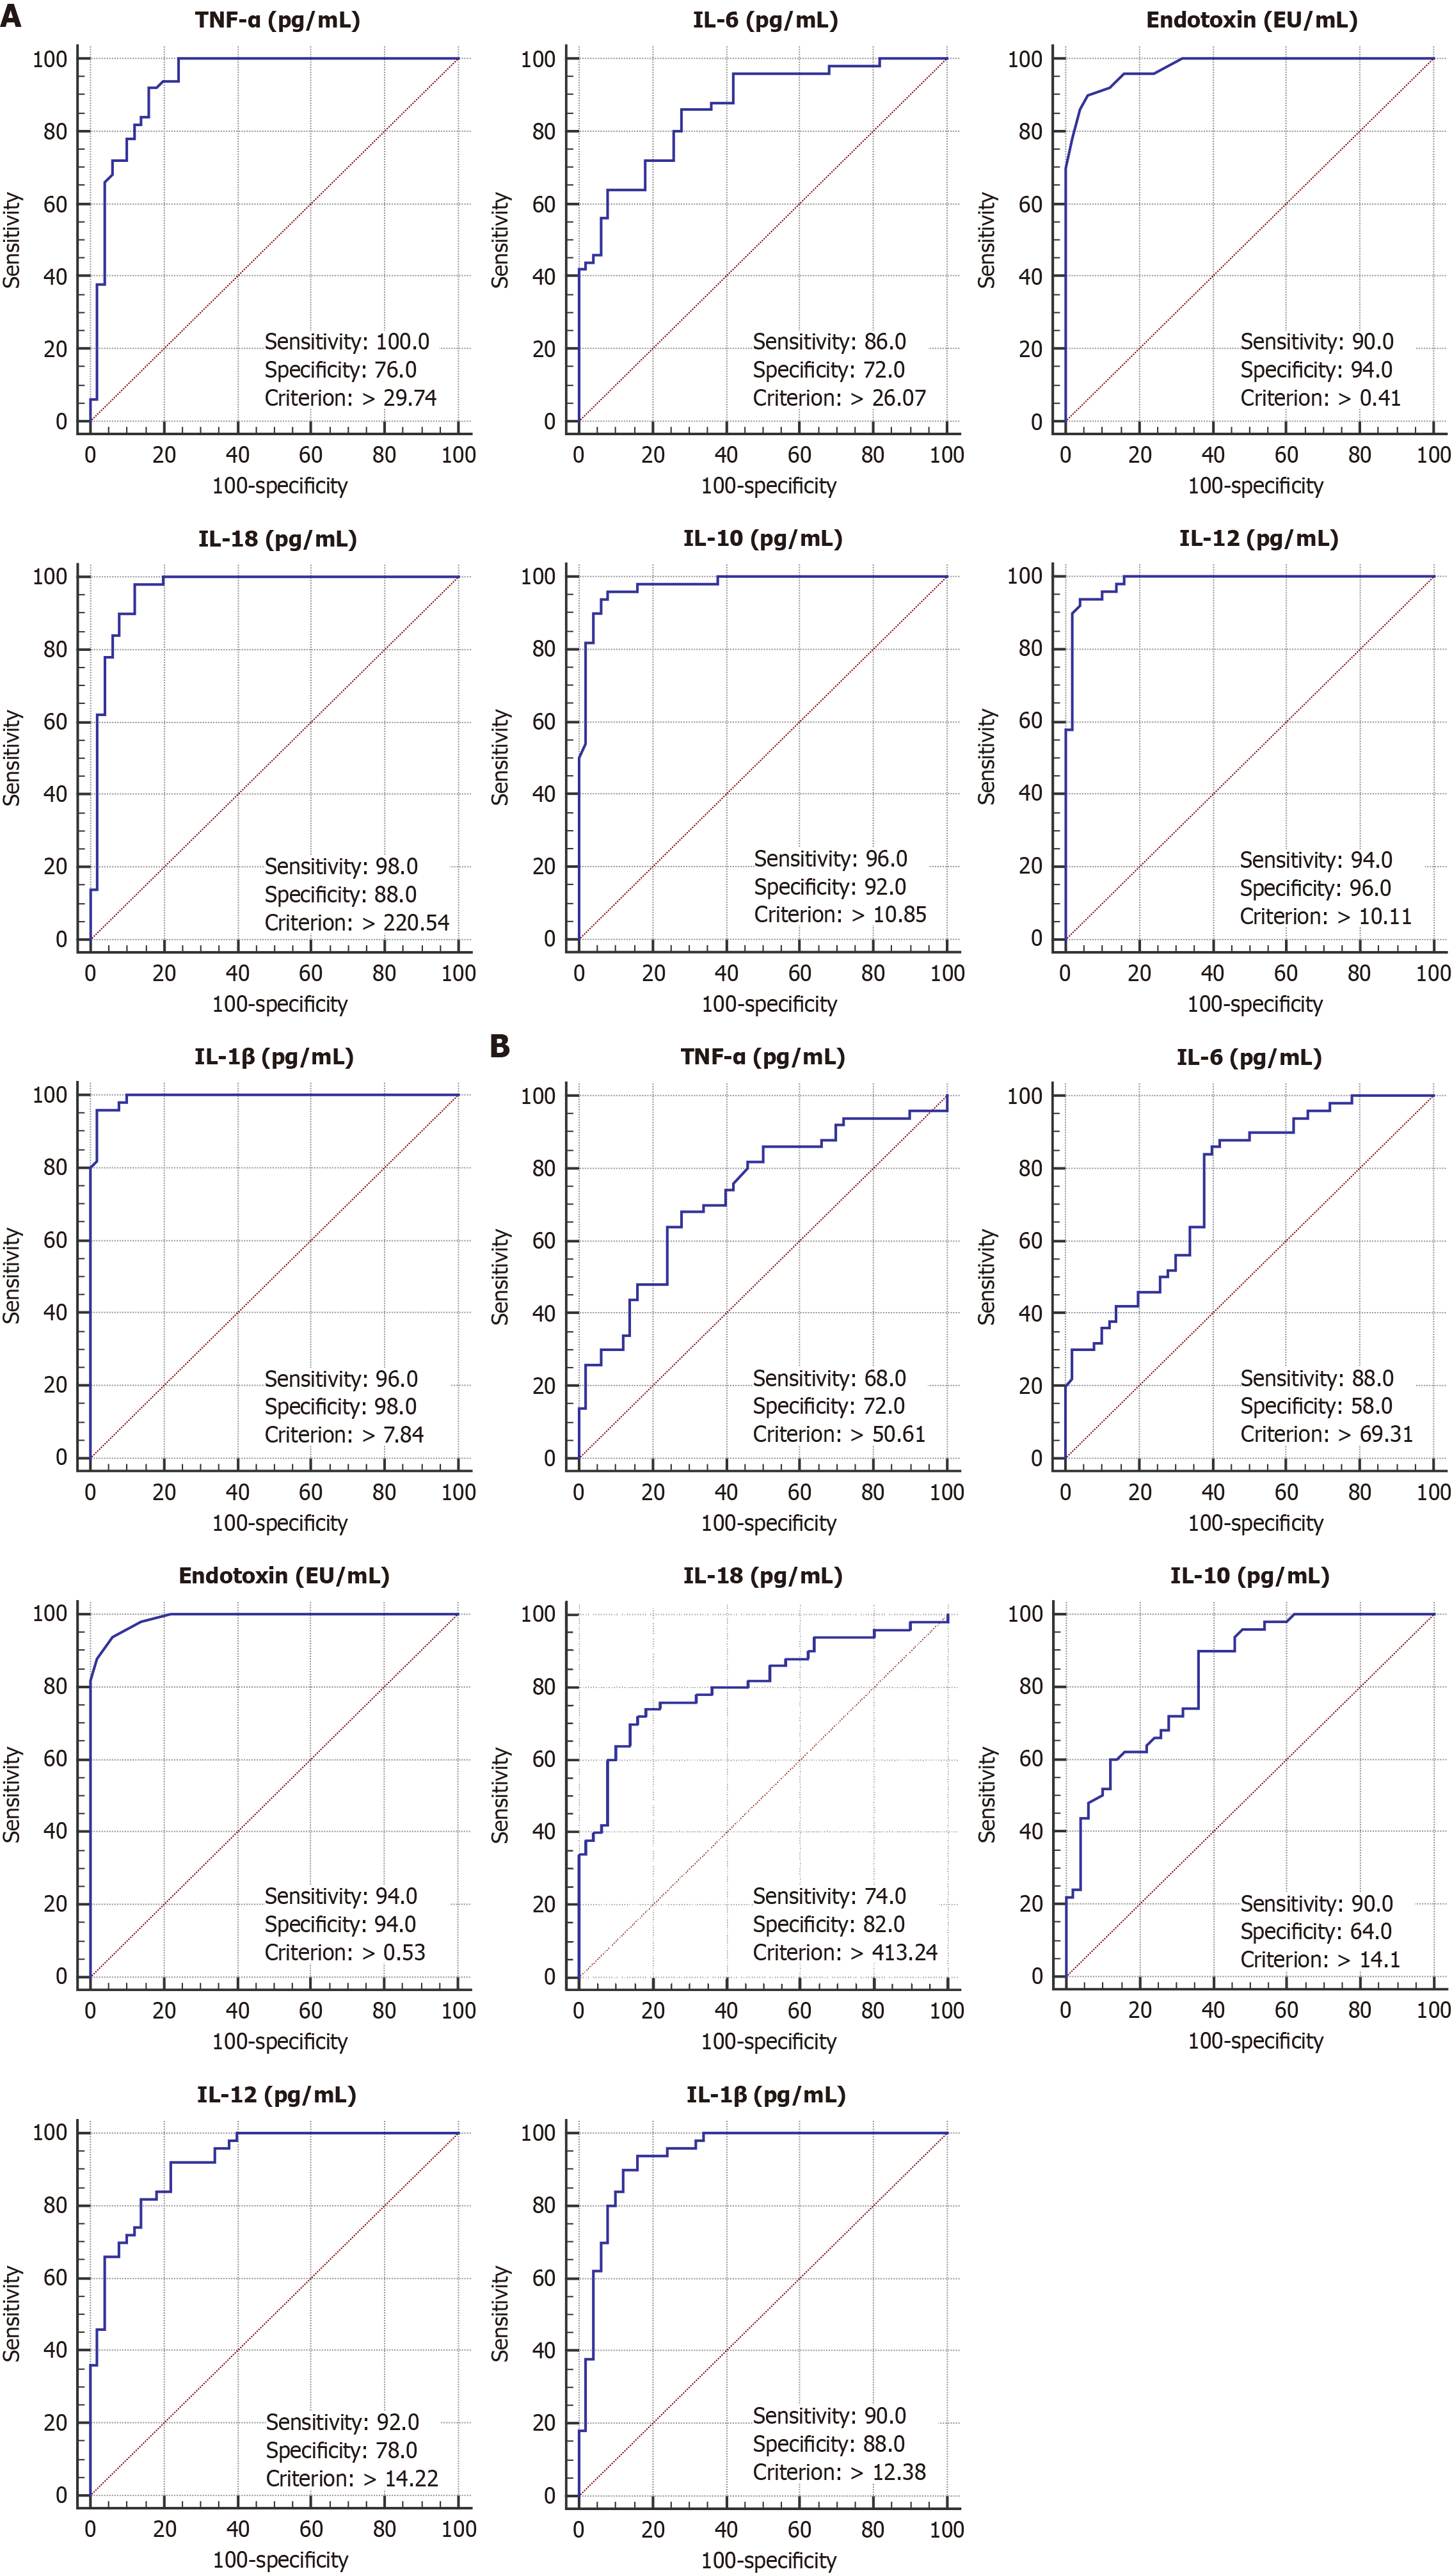
Figure 2 Receiver operating characteristic curves of inflammatory markers for predicting minimal hepatic encephalopathy.
A: Tumor necrosis factor-alpha [area under the receiver operating characteristic (AUROC): 0.934], interleukin-6 (IL-6) (AUROC: 0.864), IL-18 (AUROC: 0.962), endotoxin (AUROC: 0.976), IL-10 (AUROC: 0.976), IL-12 (AUROC: 0.984), IL-1β (AUROC: 0.993); B: Grade 1 hepatic encephalopathy [tumor necrosis factor-alpha (AUROC: 0.729)], IL-6 (AUROC: 0.751), IL-18 (AUROC: 0.812), endotoxin (AUROC: 0.989), IL-10 (AUROC: 0.833), IL-12 (AUROC: 0.921), IL-1β (AUROC: 0.938). TNF-α: Tumor necrosis factor-alpha; IL: Interleukin.
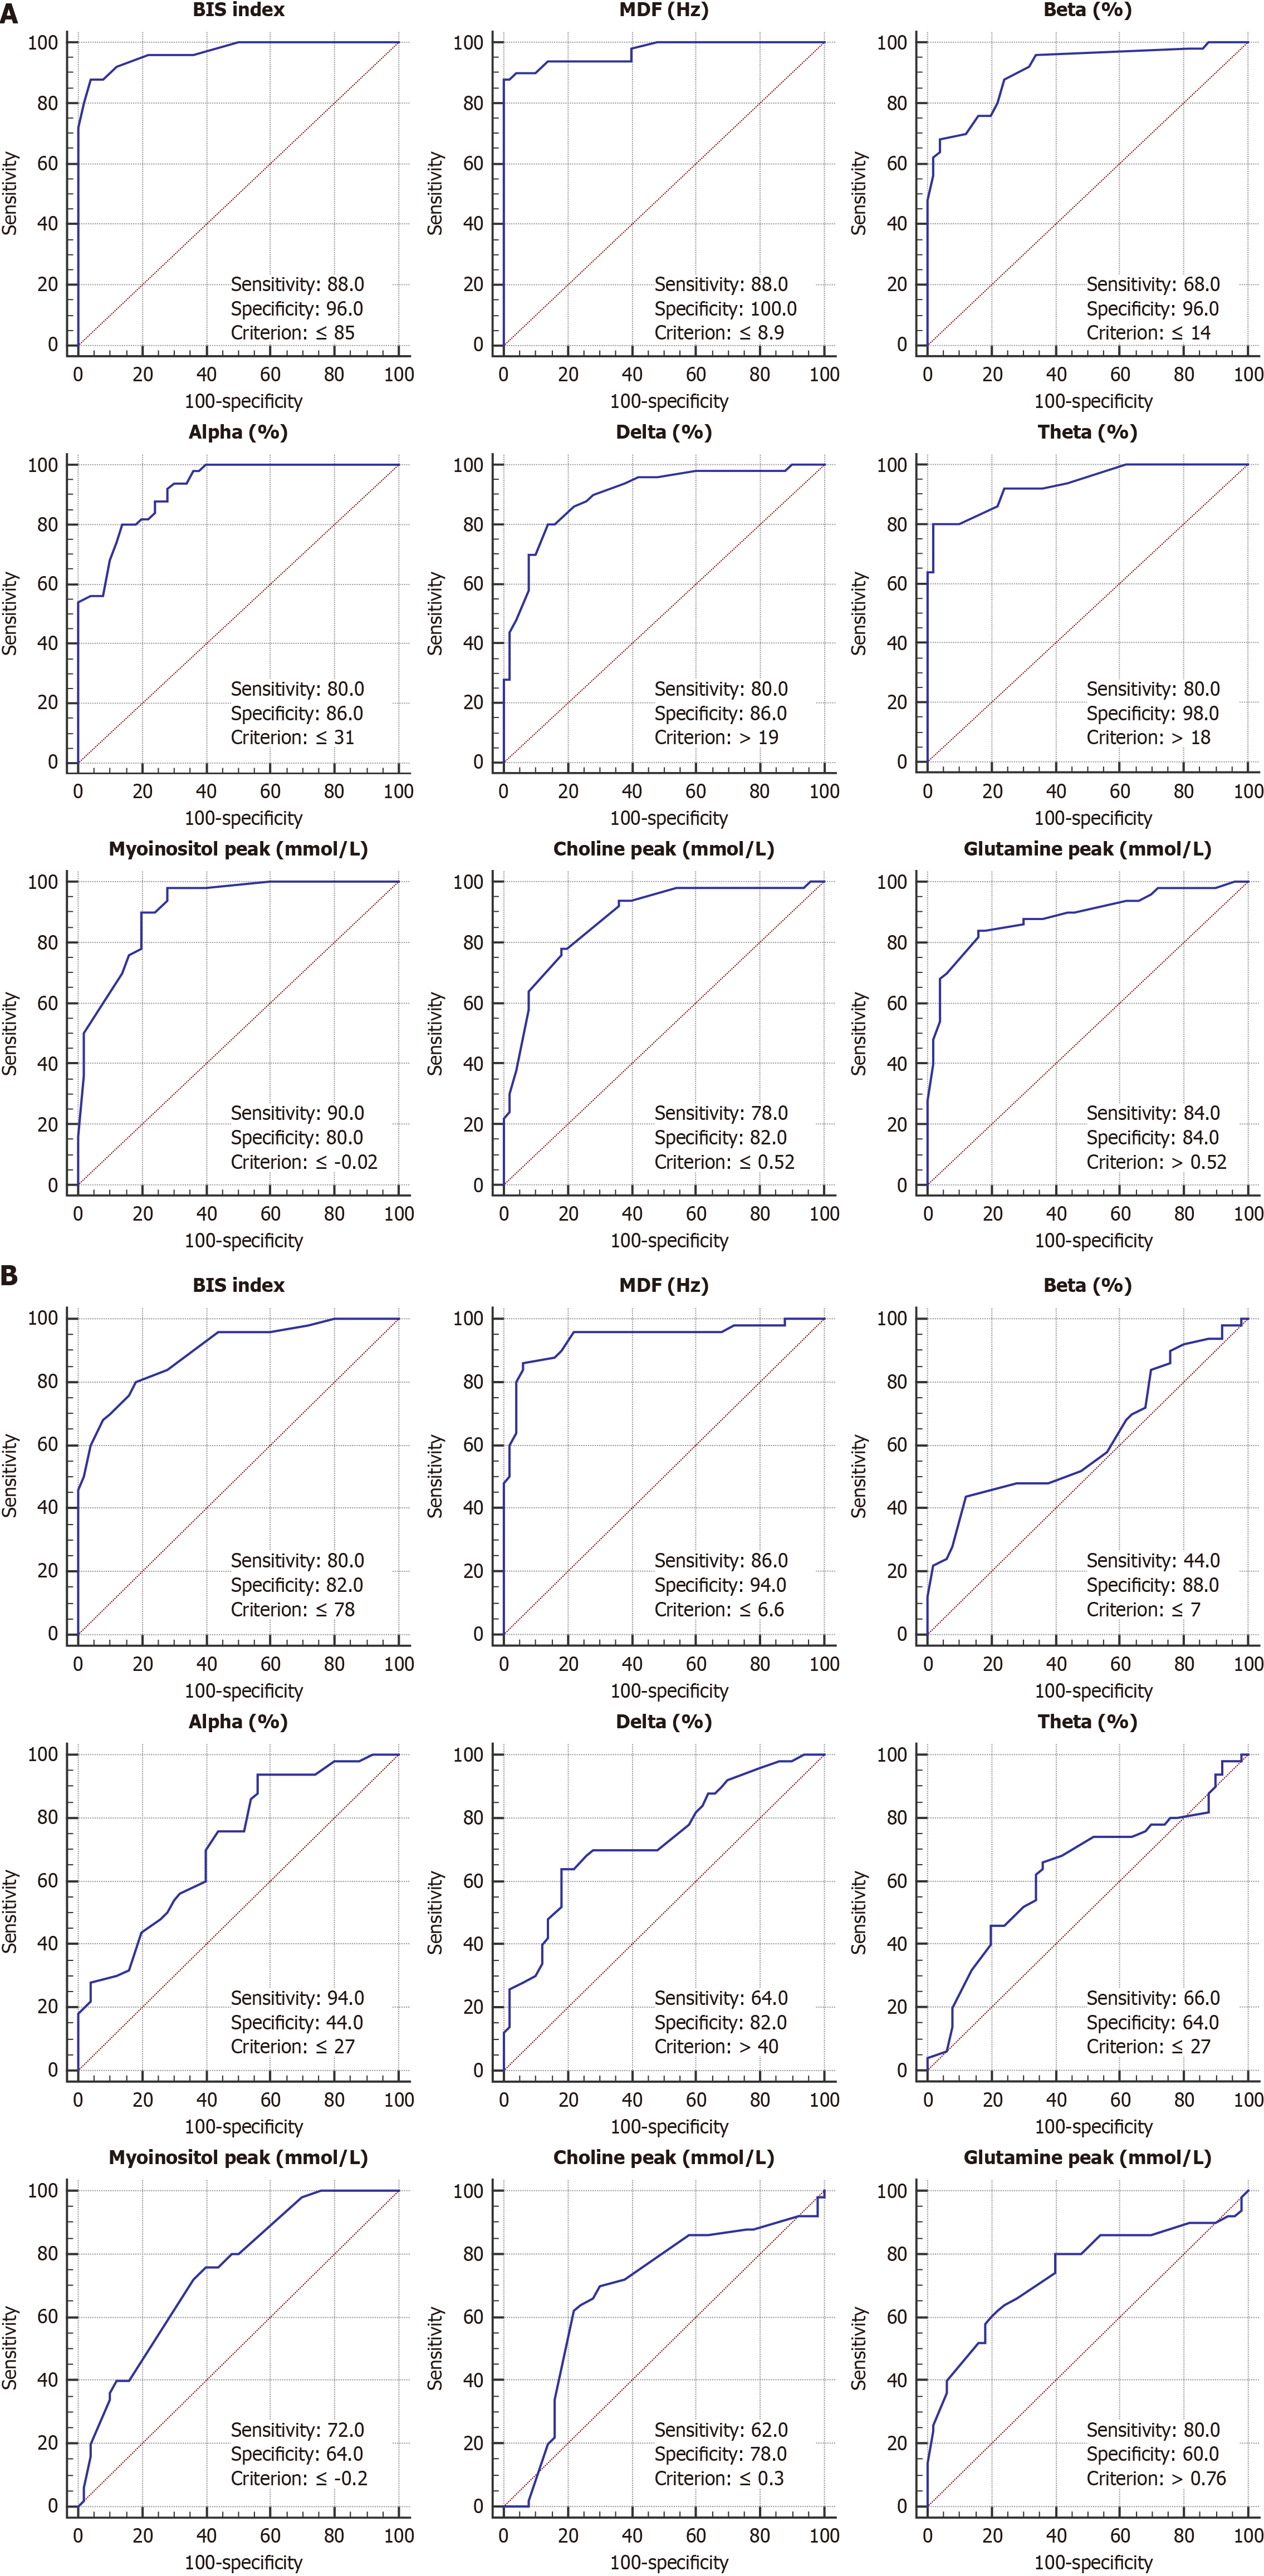
Figure 3 Receiver operating characteristic curves of Bispectral index, mean dominant frequency, relative powers of electroen
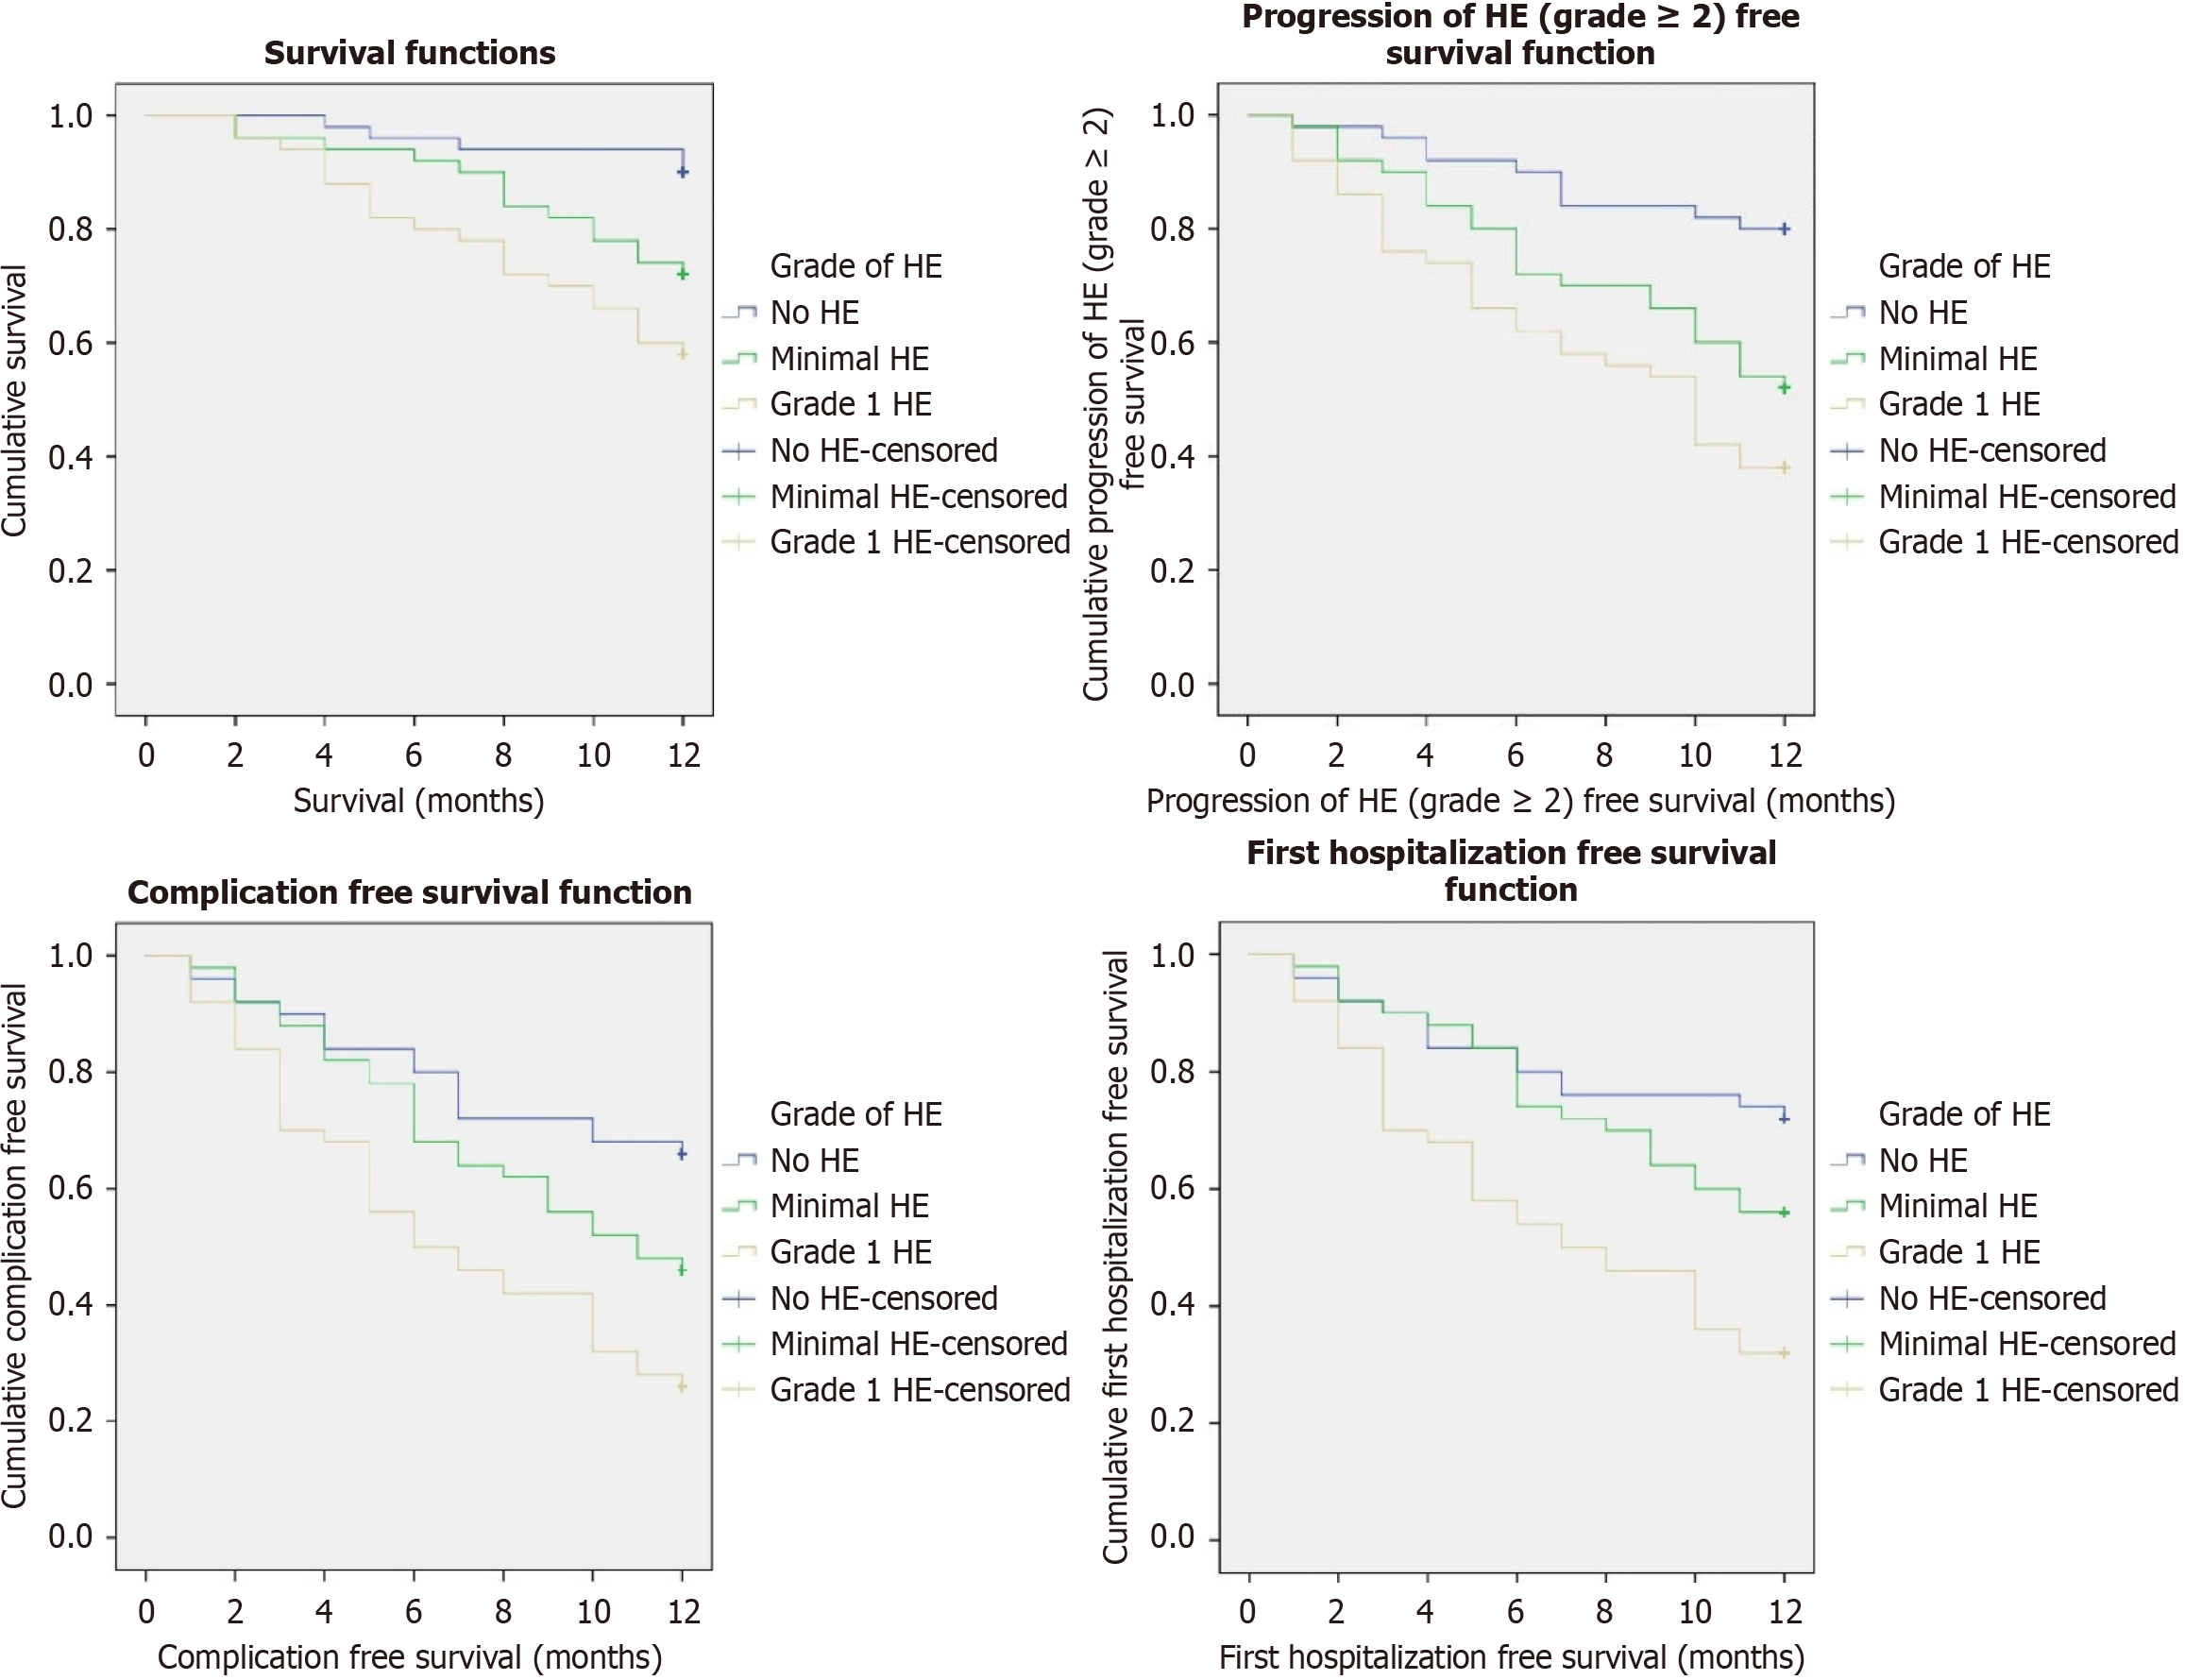
Figure 4 Kaplan-Meier curves comparing no hepatic encephalopathy, minimal hepatic encephalopathy, and grade 1 hepatic encephalopathy for overall survival, progression of hepatic encephalopathy (≥ 2) free survival, complications-free survival, and hospitalization-free survival.
HE: Hepatic encephalopathy.
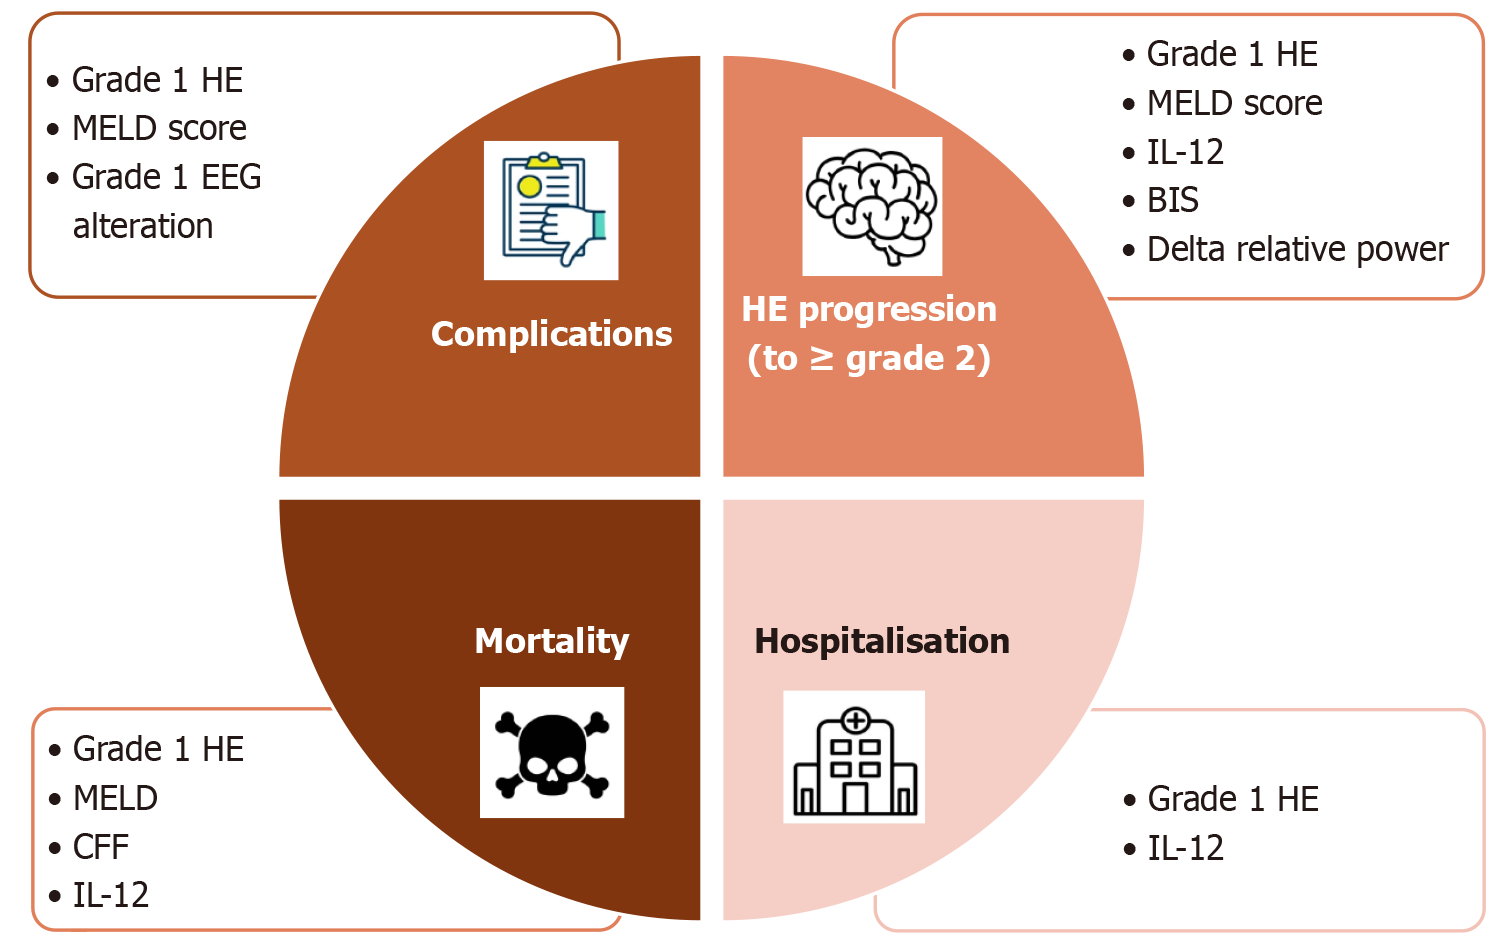
Figure 5 Independent risk factors for complications, hepatic encephalopathy progression (≥ grade 2), hospitalization, and mortality on multivariate analysis.
HE: Hepatic encephalopathy; MELD: Model for end-stage liver disease; EEG: Electroencephalogram; IL: Interleukin; BIS: Bispectral index; CFF: Critical flicker frequency.
- Citation: Kummetha LC, Bhatt S, Vaithiyam V, Sharma BC, Srivastava S, Mahajan B, Bansal K, Chaudhry N, Tandon MS, Sachdeva S, Kumar A, Dalal A, Sonika U. Differentiation of minimal and grade 1 hepatic encephalopathy using neurophysiological, neuropsychological, magnetic resonance spectroscopic, and systemic inflammatory parameters. World J Hepatol 2026; 18(5): 118040
- URL: https://www.wjgnet.com/1948-5182/full/v18/i5/118040.htm
- DOI: https://dx.doi.org/10.4254/wjh.v18.i5.118040