















Copyright: ©Author(s) 2026.
World J Hepatol. Oct 27, 2026; 18(10): 123267
Published online Oct 27, 2026. doi: 10.4254/wjh.123267
Published online Oct 27, 2026. doi: 10.4254/wjh.123267
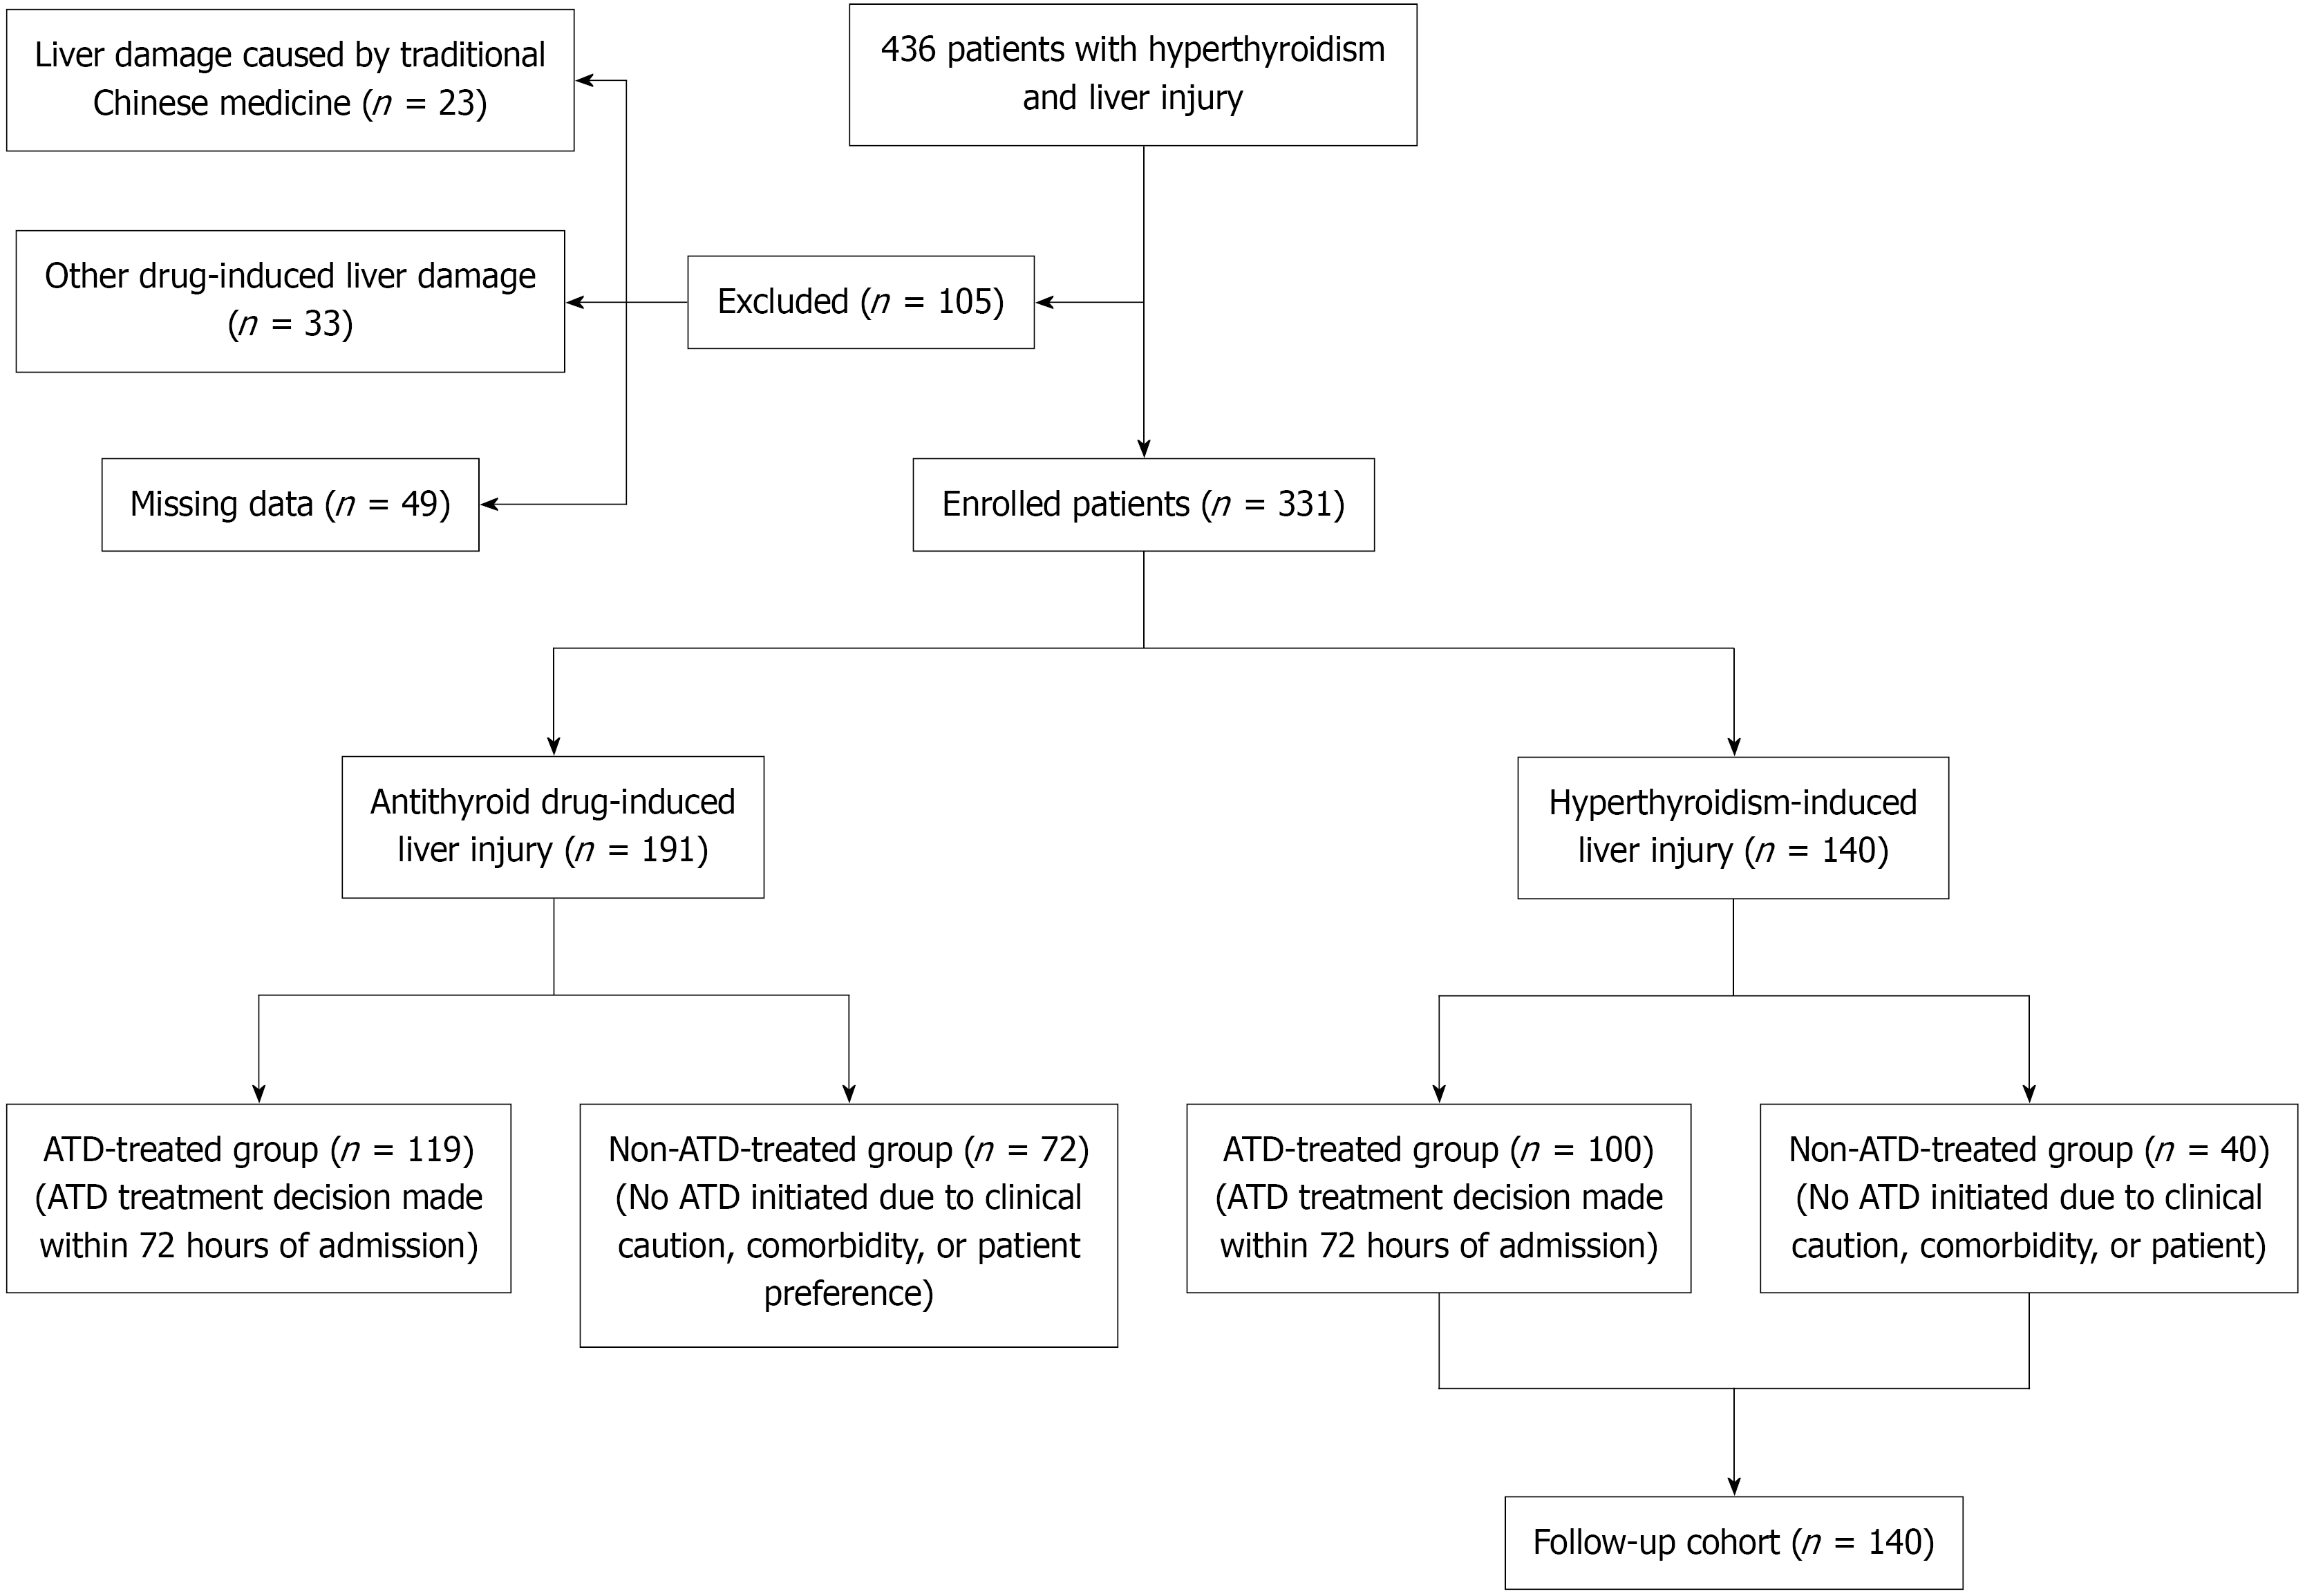
Figure 1 Study flow diagram.
ATD: Antithyroid drug.
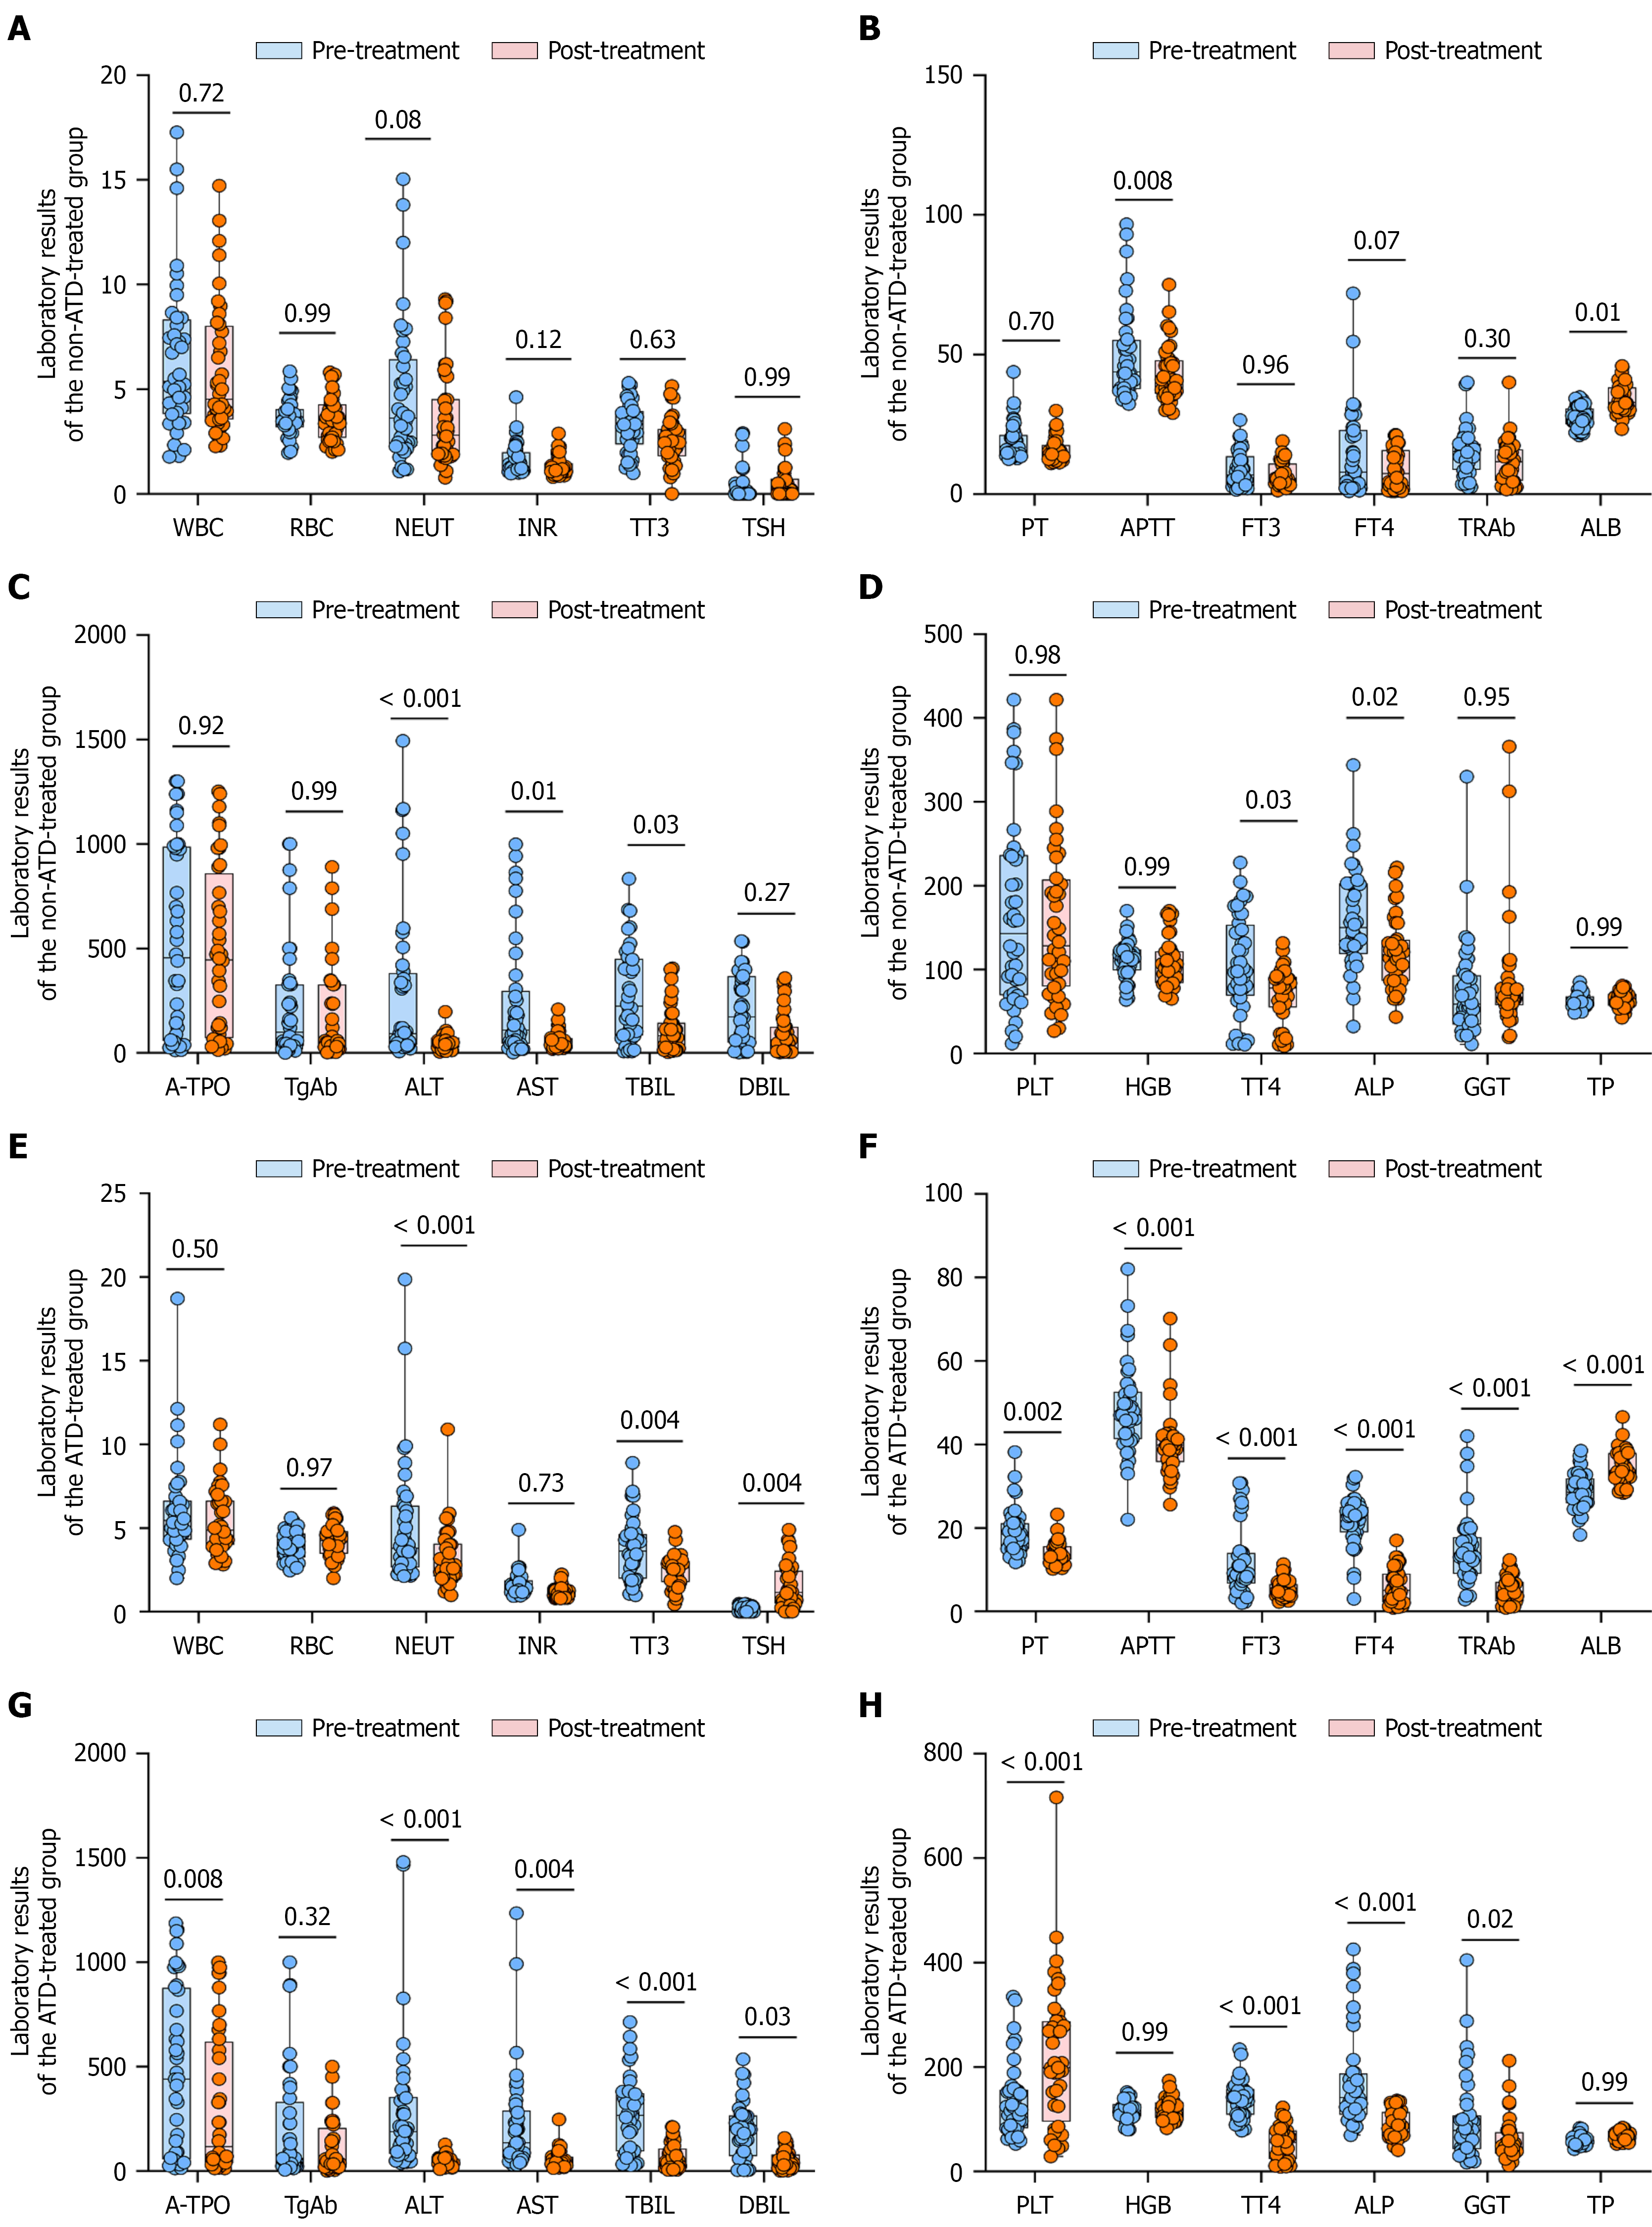
Figure 2 Comparison of clinical parameters between antithyroid drug-treated and non-antithyroid drug groups before and after treatment.
A-D: They compare the indicators of blood routine, coagulation function, thyroid function, and liver function before and after treatment in the non-antithyroid drug treatment group, including white blood cell, red blood cell, neutrophil (NEUT), platelet (PLT), hemoglobin, international normalized ratio, prothrombin time (PT), activated partial thromboplastin time (APTT), thyroid-stimulating hormone (TSH), free triiodothyronine (FT3), free thyroxine (FT4), thyrotropin receptor antibody (TRAb), thyroid peroxidase antibody, thyroglobulin antibody, albumin (ALB), alanine aminotransferase (ALT), aspartate aminotransferase (AST), total bilirubin (TBIL), direct bilirubin (DBIL), total thyroxine (TT4), and alkaline phosphatase (ALP). Among these, APTT, ALB, ALT, AST, TBIL, TT4, and ALP all showed P < 0.05, indicating statistically significant differences before and after treatment; E-H: They compare the indicators of blood routine, coagulation function, thyroid function, and liver function before and after treatment in the antithyroid drug treatment group, including white blood cell, red blood cell, NEUT, PLT, hemoglobin, international normalized ratio, PT, APTT, TSH, FT3, FT4, TRAb, thyroid peroxidase antibody, thyroglobulin antibody, ALB, ALT, AST, TBIL, and DBIL. Among these, NEUT, TT3, TSH, PT, APTT, FT3, FT4, TRAb, ALB, ALT, AST, TBIL, DBIL, PLT, TT4, ALP, and GGT all showed P < 0.05, indicating statistically significant differences before and after treatment. It presents P values for the differences between the two groups [antithyroid drug (+) vs antithyroid drug (-)] at pre-treatment and post-treatment time points for each laboratory indicator. P values were calculated using an appropriate statistical test (e.g., independent t-test or Mann-Whitney U test). A P value < 0.05 was considered statistically significant. WBC: White blood cell; RBC: Red blood cell; NEUT: Neutrophil; ALT: Alanine aminotransferase; AST: Aspartate aminotransferase; ALB: Albumin; TP: Total protein; TBIL: Total bilirubin; DBIL: Direct bilirubin; ALP: Alkaline phosphatase; GGT: Γ-glutamyl transferase; FT3: Free triiodothyronine; FT4: Free thyroxine; TT3: Total triiodothyronine; TT4: Total thyroxine; TRAb: Thyrotropin receptor antibody; A-TPO: Thyroid peroxidase antibody; TgAb: Thyroglobulin antibody; PT: Prothrombin time; APTT: Activated partial thromboplastin time; INR: International normalized ratio; TSH: Thyroid stimulating hormone; PLT: Platelet; HGB: Hemoglobin; ATD: Antithyroid drug.
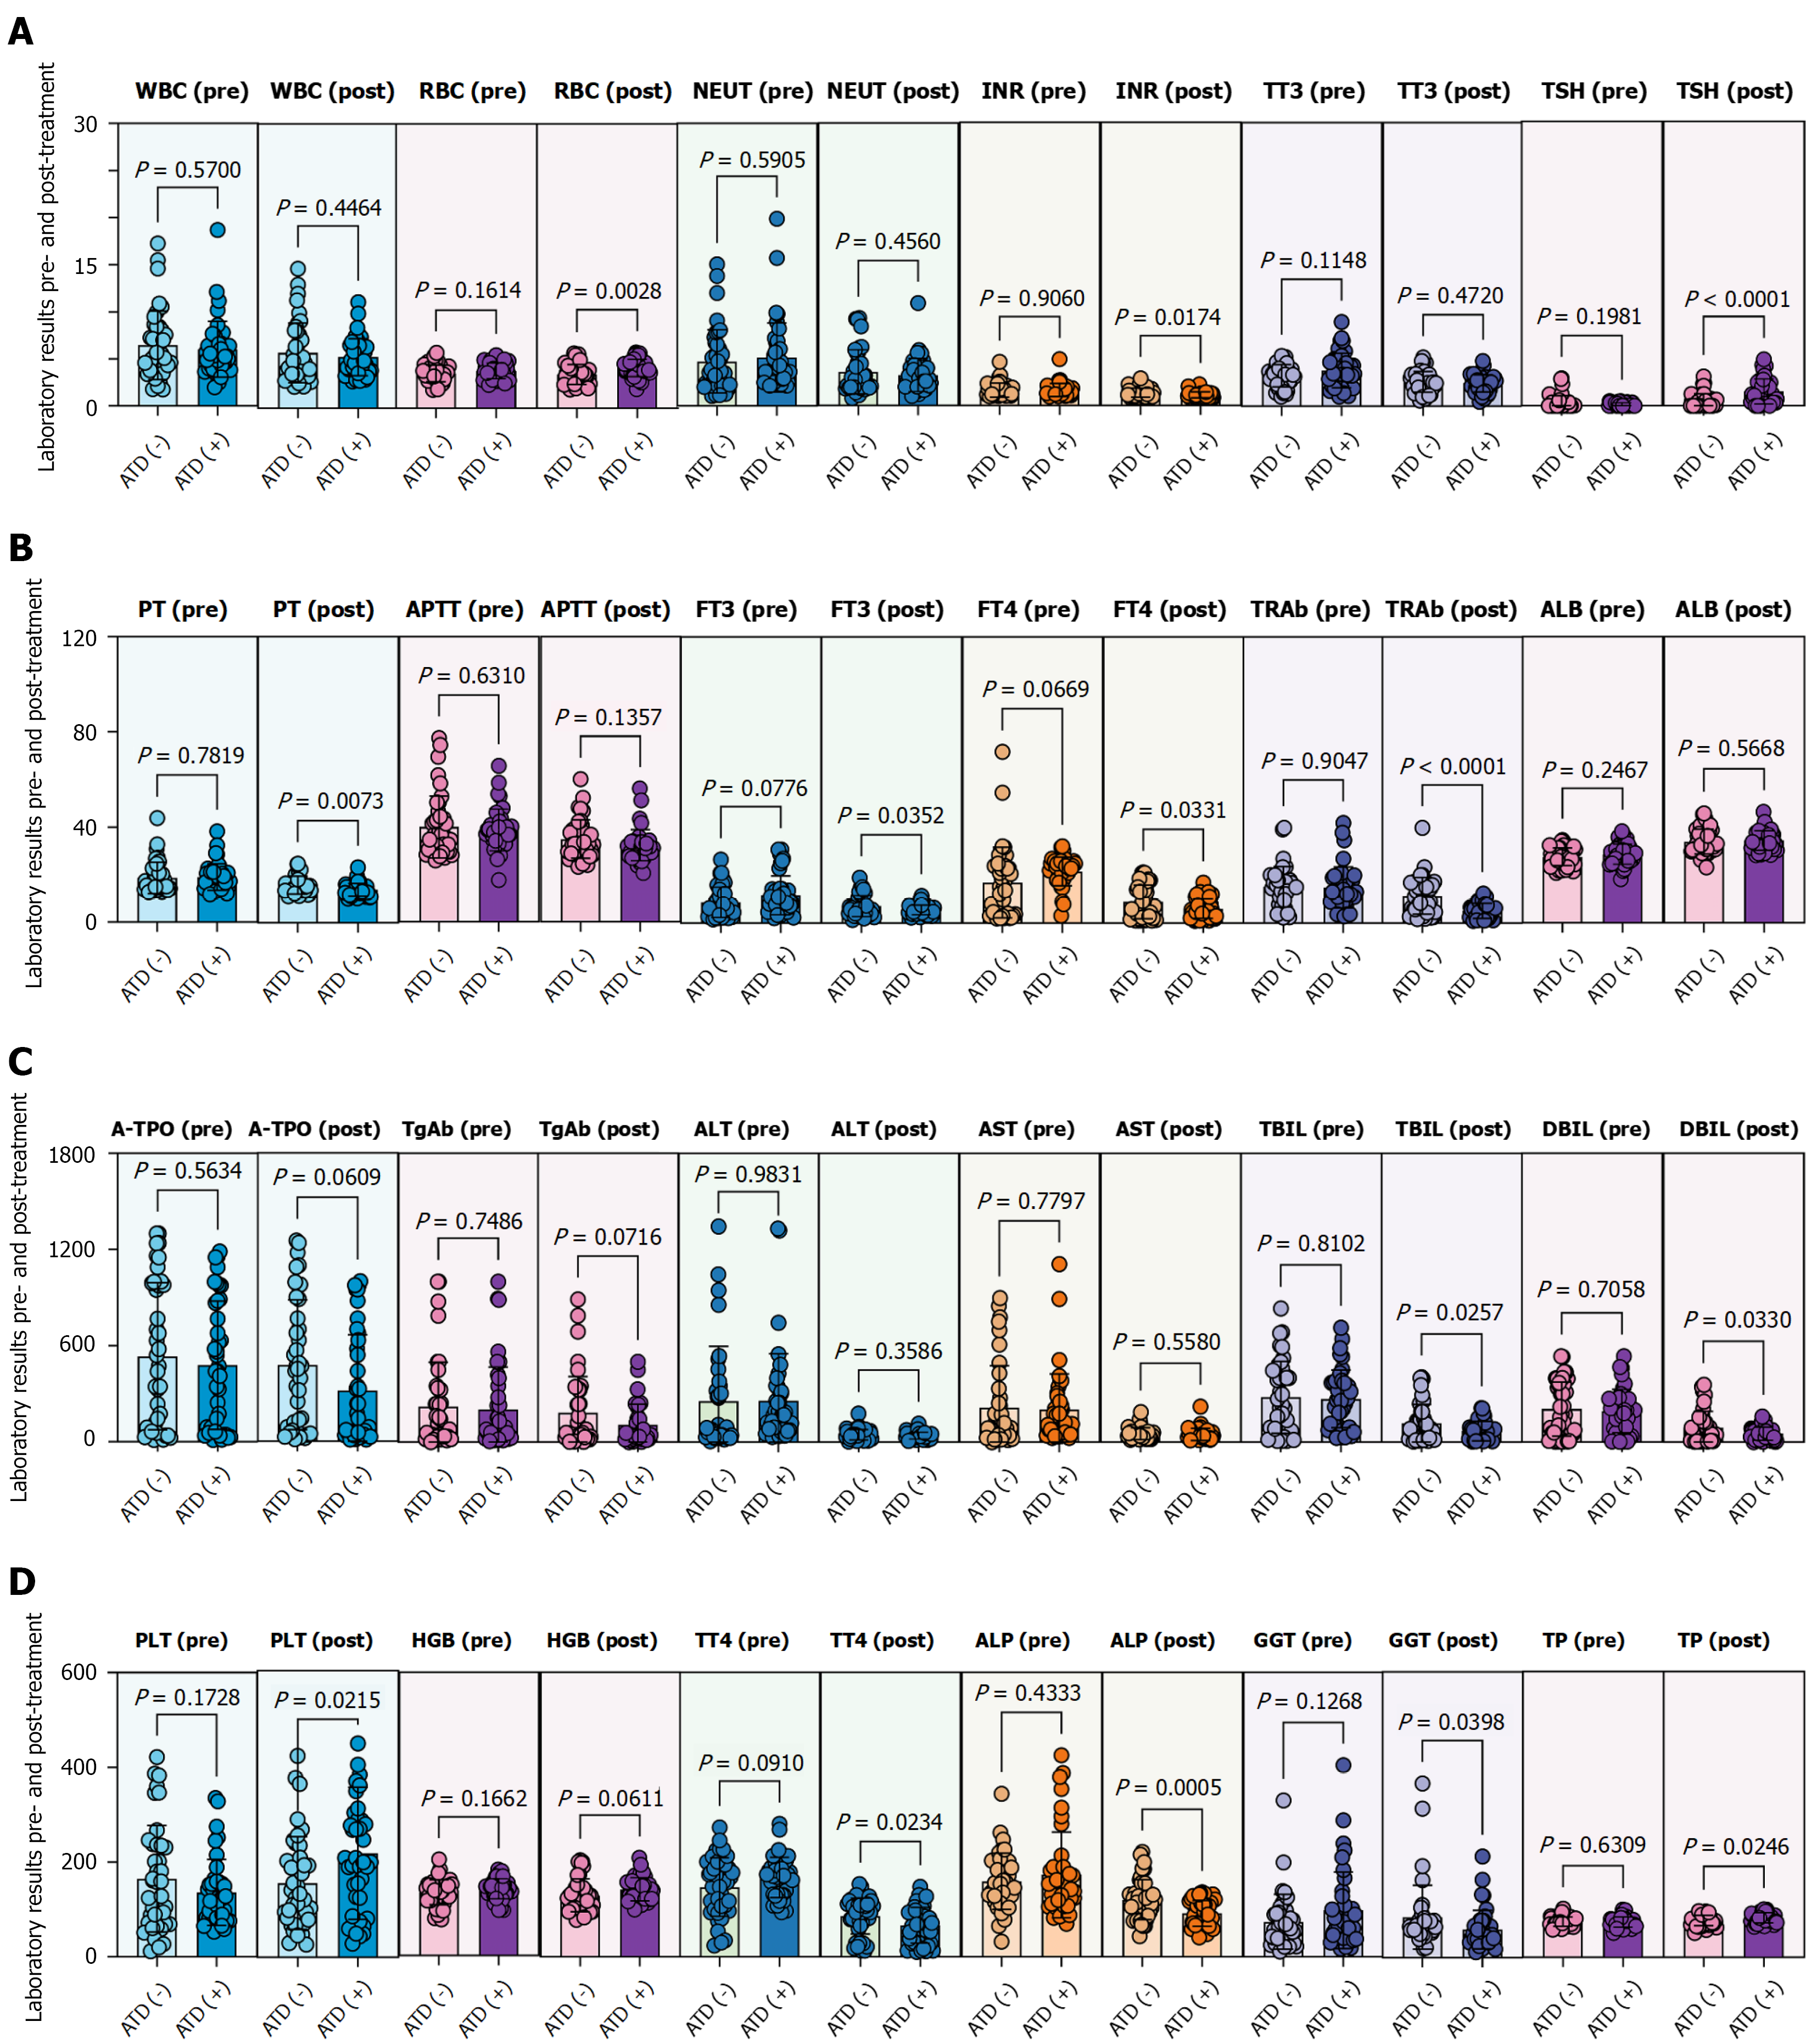
Figure 3 Matrix of P values for comparisons of clinical parameters between antithyroid drug-treated and non-antithyroid drug groups before and after treatment.
A: It compares the differences in white blood cell, red blood cell, neutrophil, international normalized ratio, total triiodothyronine, and thyroid stimulating hormone between the antithyroid drug (ATD) treatment group [ATD (+)] and the non-ATD treatment group [ATD (-)] before and after treatment. Before treatment, there were no statistically significant differences between the two groups for any of these indicators (P > 0.05). After treatment, the differences in red blood cell, international normalized ratio, and thyroid stimulating hormone between the two groups were statistically significant (P < 0.05); B: It compares the differences in prothrombin time, activated partial thromboplastin time, free triiodothyronine, free thyroxine, thyrotropin receptor antibody, and albumin between the ATD treatment group [ATD (+)] and the non-ATD treatment group [ATD (-)] before and after treatment. Before treatment, none of the differences between the two groups were statistically significant for any of the indicators (P > 0.05). After treatment, the differences in prothrombin time, free triiodothyronine, free thyroxine, and thyrotropin receptor antibody between the two groups were statistically significant (P < 0.05); C: It compares the differences in thyroid peroxidase antibody, thyroglobulin antibody, alanine aminotransferase, aspartate aminotransferase, total bilirubin, and direct bilirubin between the ATD treatment group [ATD (+)] and the non-ATD treatment group [ATD (-)] before and after treatment. Before treatment, there were no statistically significant differences between the two groups for any of these indicators (P > 0.05). After treatment, the differences in total bilirubin and direct bilirubin between the two groups were statistically significant (P < 0.05); D: It compares the differences in platelet, hemoglobin, total thyroxine, alkaline phosphatase, γ-glutamyl transferase, and total protein between the ATD treatment group [ATD (+)] and the non-ATD treatment group [ATD (-)] before and after treatment. Before treatment, there were no statistically significant differences between the two groups for any of these indicators (P > 0.05). After treatment, the differences in platelet, total thyroxine, alkaline phosphatase, γ-glutamyl transferase, and total protein between the two groups were statistically significant (P < 0.05). Rows and columns represent laboratory indicators measured at pre-treatment and post-treatment time points in patients stratified by ATD use: (1) ATD (+) indicates patients receiving ATD therapy; and (2) ATD (-) indicates patients not receiving ATD therapy. Each cell contains the P value from a statistical test (e.g., paired t-test, Wilcoxon signed-rank test, or correlation analysis) assessing the relationship or difference between the corresponding row and column parameters. P values less than 0.05 are considered statistically significant. WBC: White blood cell; RBC: Red blood cell; ATD: Antithyroid drug; NEUT: Neutrophil; ALT: Alanine aminotransferase; AST: Aspartate aminotransferase; ALB: Albumin; TP: Total protein; TBIL: Total bilirubin; DBIL: Direct bilirubin; ALP: Alkaline phosphatase; GGT: Γ-glutamyl transferase; FT3: Free triiodothyronine; FT4: Free thyroxine; TT3: Total triiodothyronine; TT4: Total thyroxine; TRAb: Thyrotropin receptor antibody; A-TPO: Thyroid peroxidase antibody; TgAb: Thyroglobulin antibody; PT: Prothrombin time; APTT: Activated partial thromboplastin time; INR: International normalized ratio; TSH: Thyroid stimulating hormone; PLT: Platelet; HGB: Hemoglobin; Pre: Pre-treatment; Post: Post-treatment.
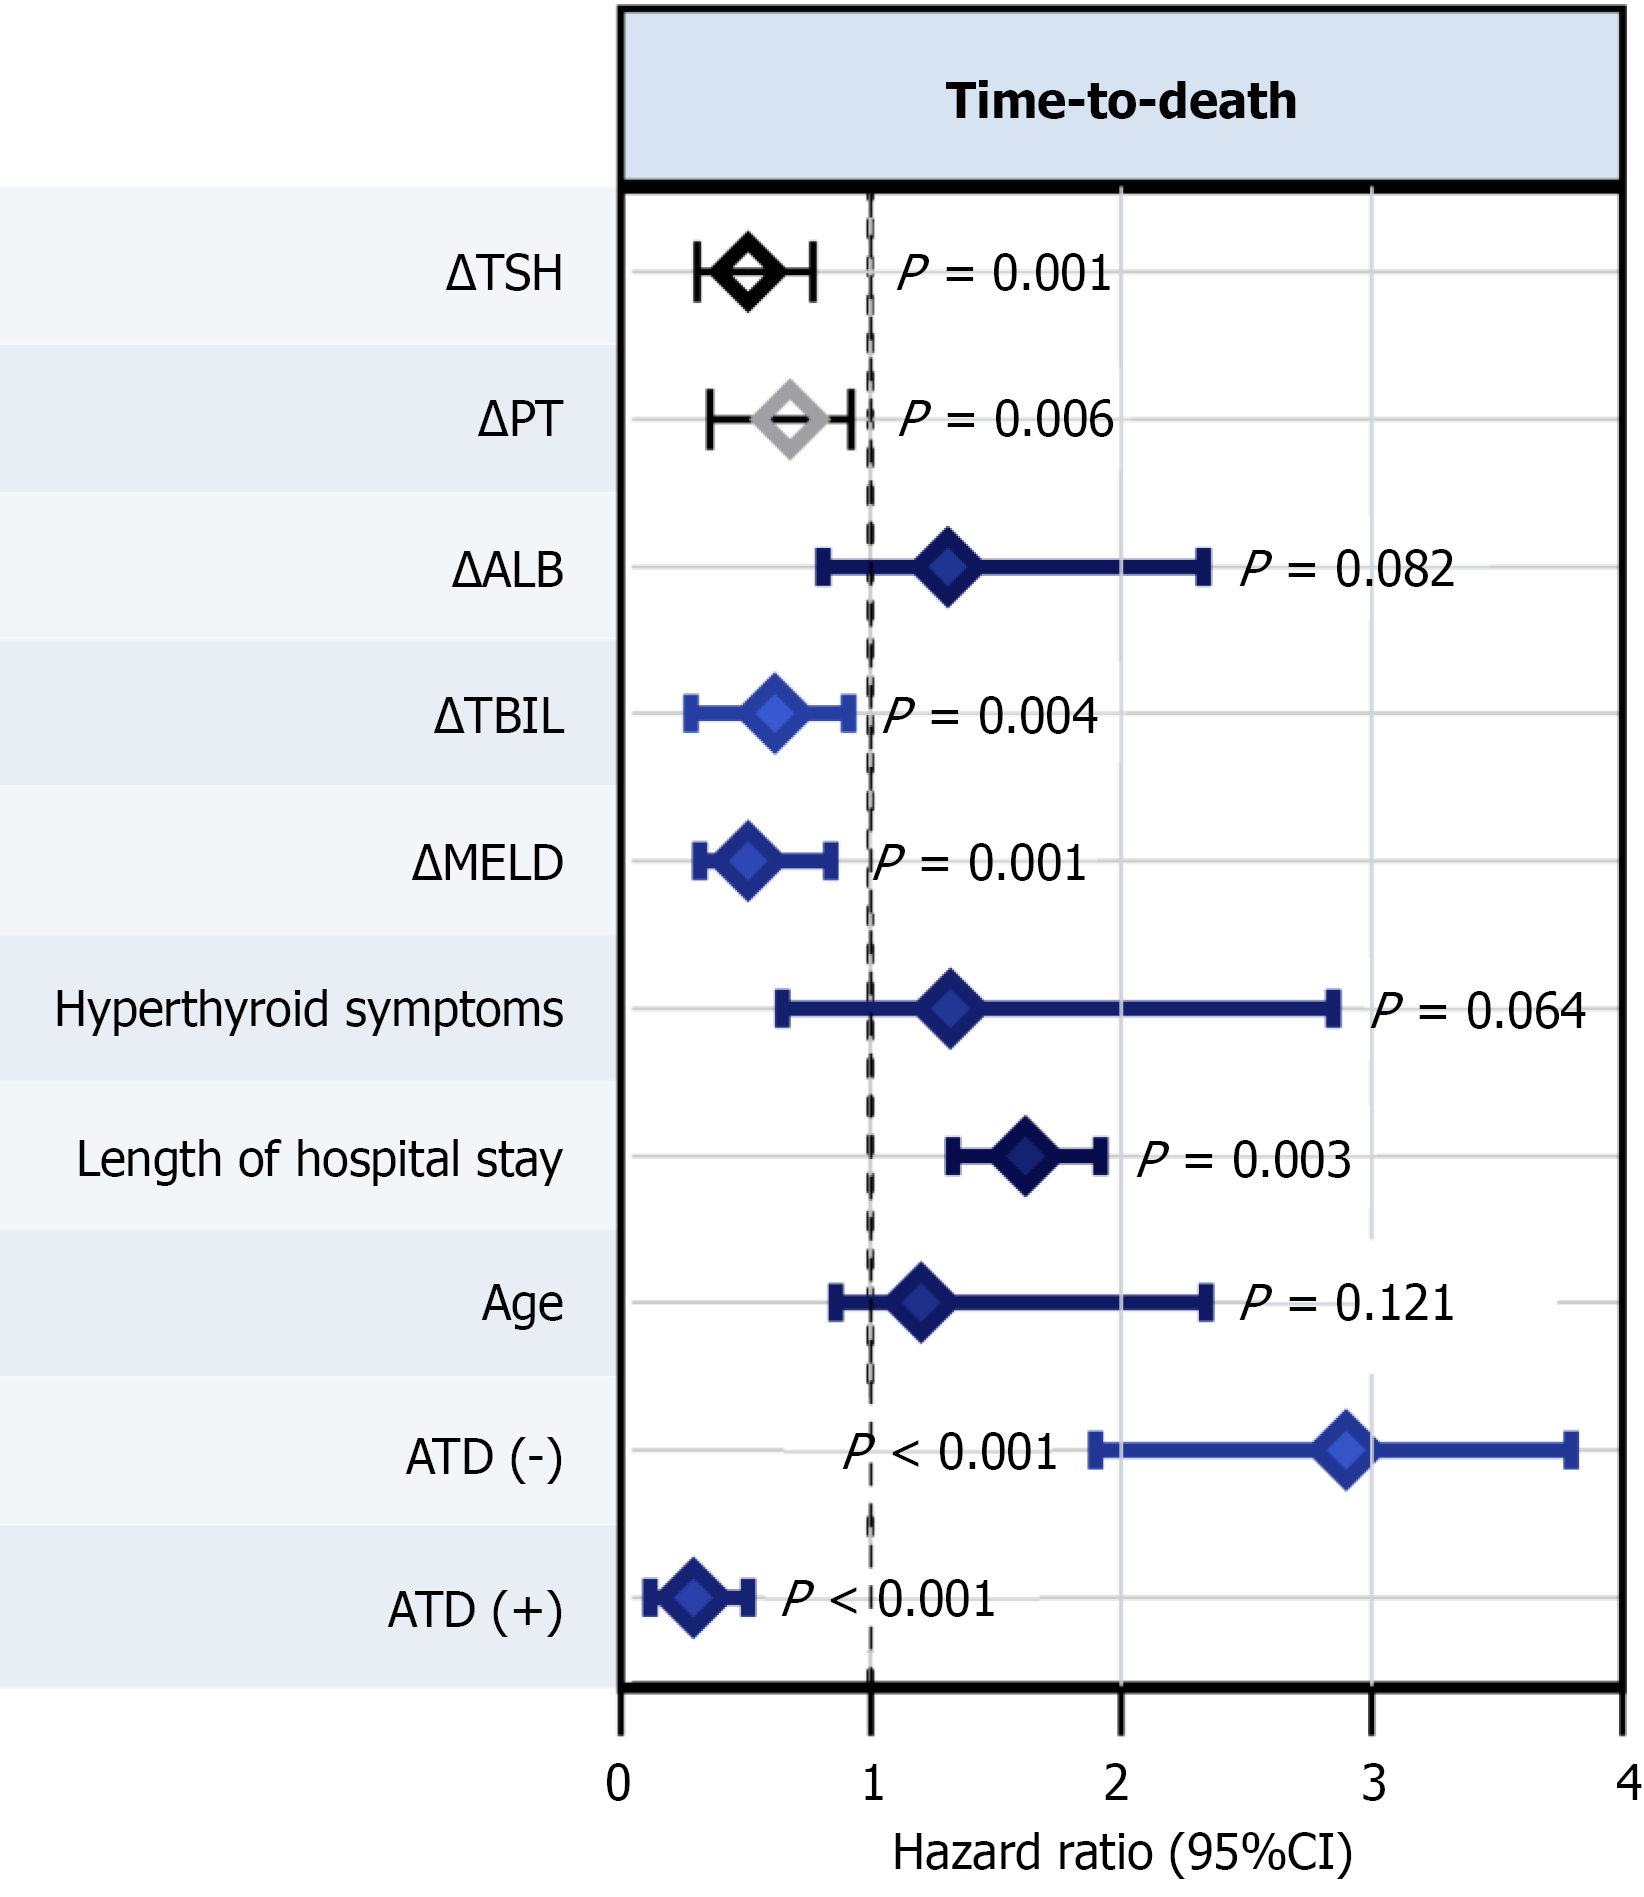
Figure 4 Univariate Cox regression analysis of factors associated with time to death.
The plot presents the P values for each variable derived from univariate Cox proportional hazards models examining the association with mortality. Variables include changes in thyroid-stimulating hormone, prothrombin time, albumin, total bilirubin, model for end-stage liver disease score, presence of hyperthyroid symptoms, length of hospital stay, age, and antithyroid drug (ATD) treatment status [ATD (-) and ATD (+)]. P values < 0.05 were considered statistically significant. TSH: Thyroid stimulating hormone; PT: Prothrombin time; ALB: Albumin; TBIL: Total bilirubin; MELD: Model for end-stage liver disease; ATD: Antithyroid drug.
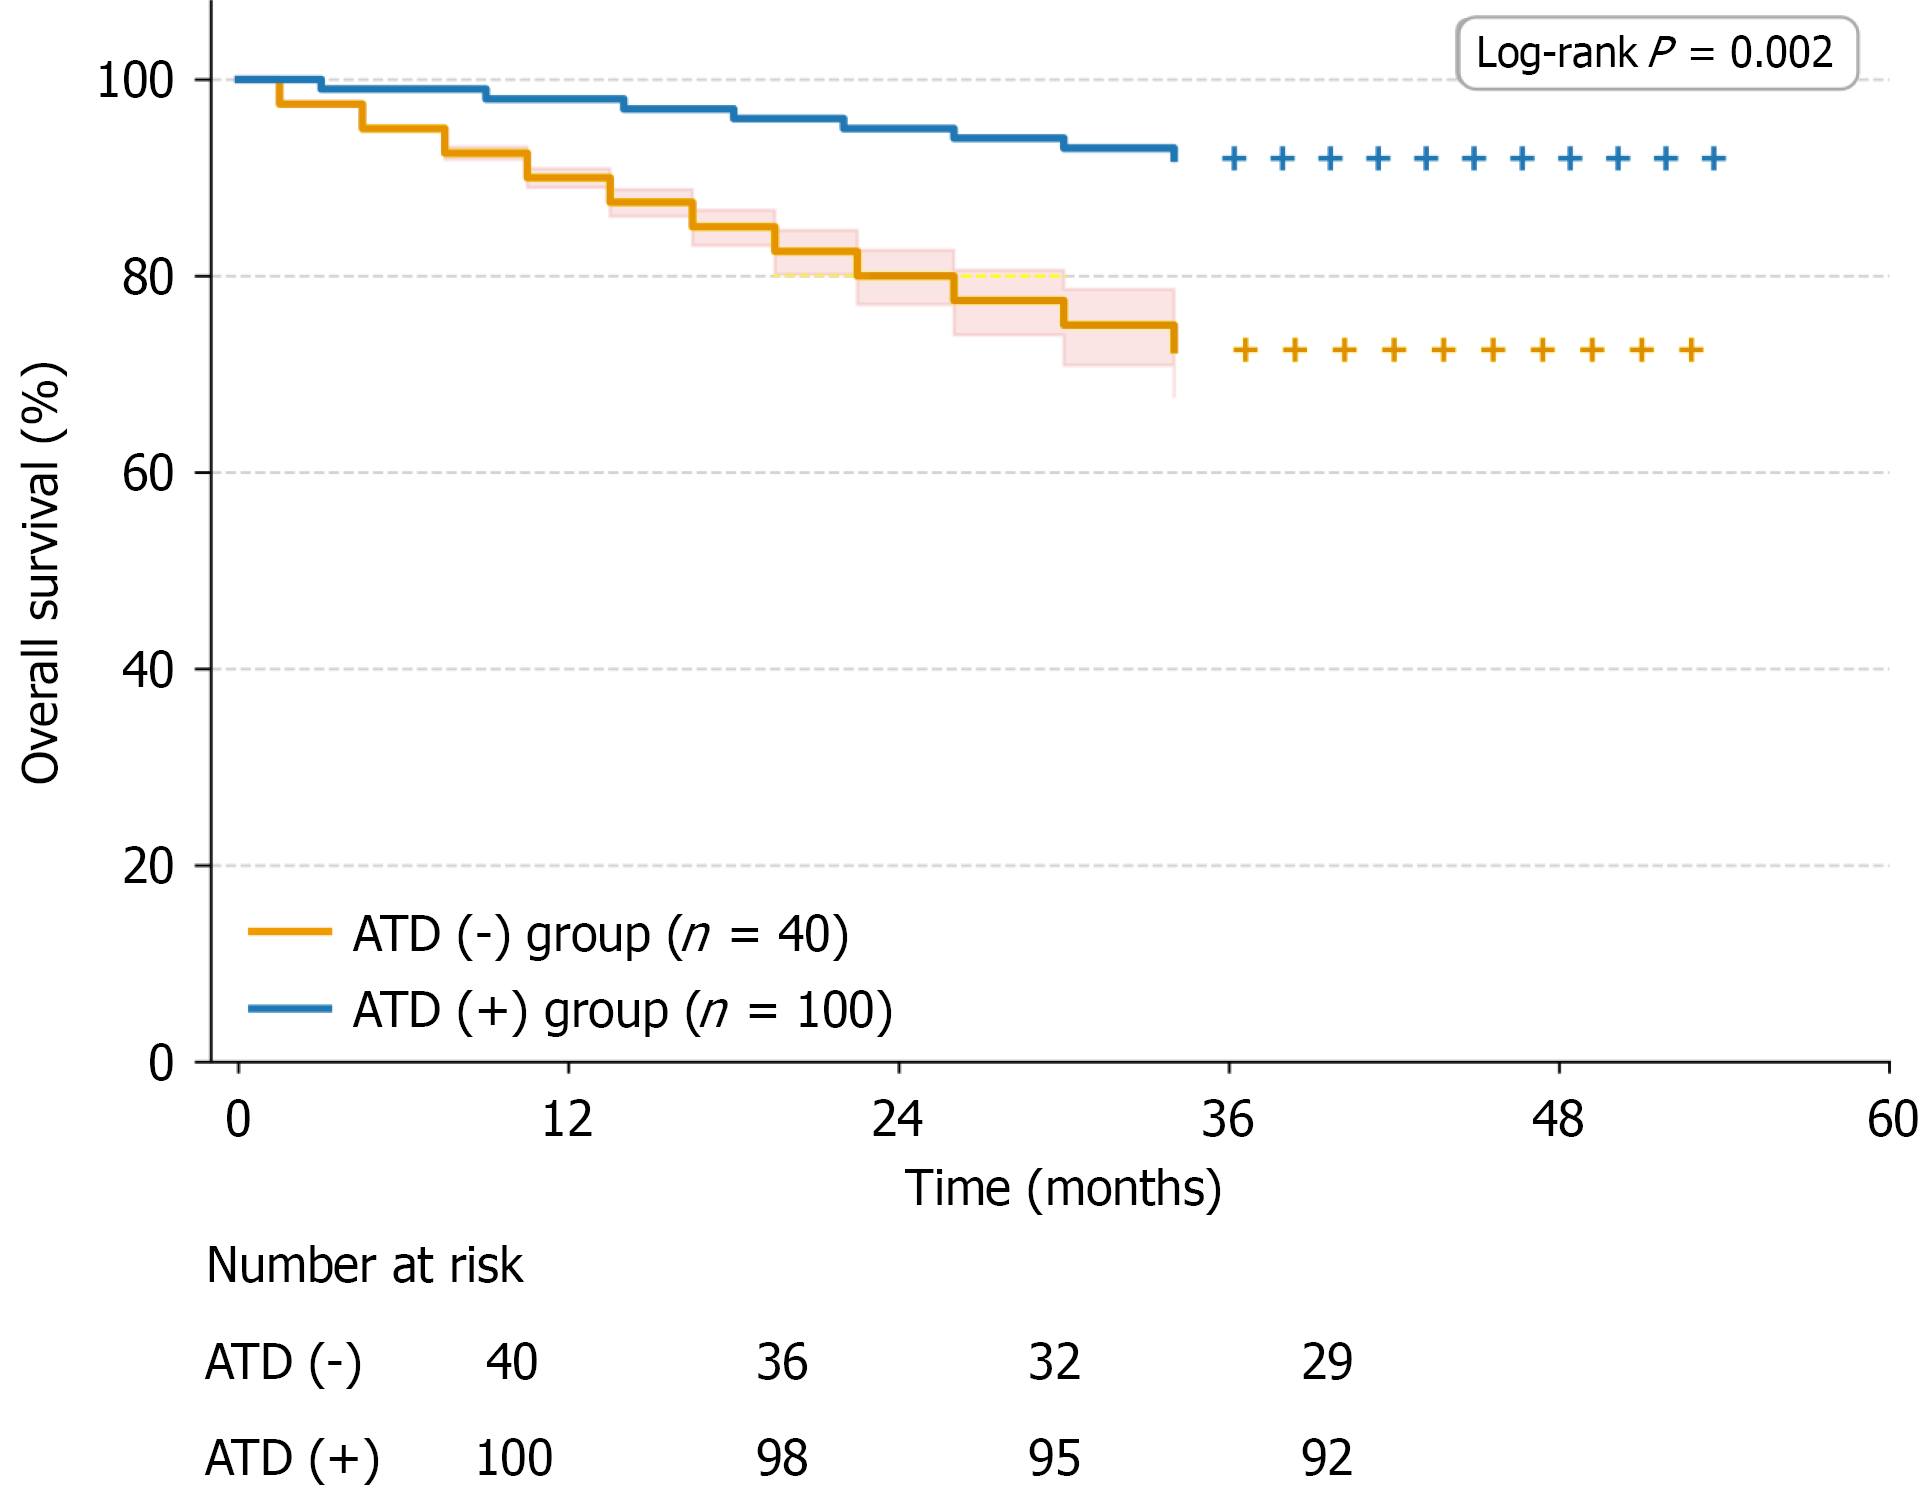
Figure 5 Overall survival comparison between antithyroid drug-treated and non-antithyroid drug groups.
The table shows the overall survival probabilities over time (in months) for patients receiving antithyroid drug (ATD) therapy [ATD (+)] and those not receiving ATD therapy [ATD (-)]. ATD: Antithyroid drug.
- Citation: Yu W, Dai ZS, Li YH, Li MP, Li J, Jiao KX, Ma J, Li Y. Proactive antithyroid therapy improves survival in hyperthyroidism-induced liver injury: A real-world cohort study. World J Hepatol 2026; 18(10): 123267
- URL: https://www.wjgnet.com/1948-5182/full/v18/i10/123267.htm
- DOI: https://dx.doi.org/10.4254/wjh.123267