Copyright
©The Author(s) 2025.
World J Hepatol. Sep 27, 2025; 17(9): 110162
Published online Sep 27, 2025. doi: 10.4254/wjh.v17.i9.110162
Published online Sep 27, 2025. doi: 10.4254/wjh.v17.i9.110162
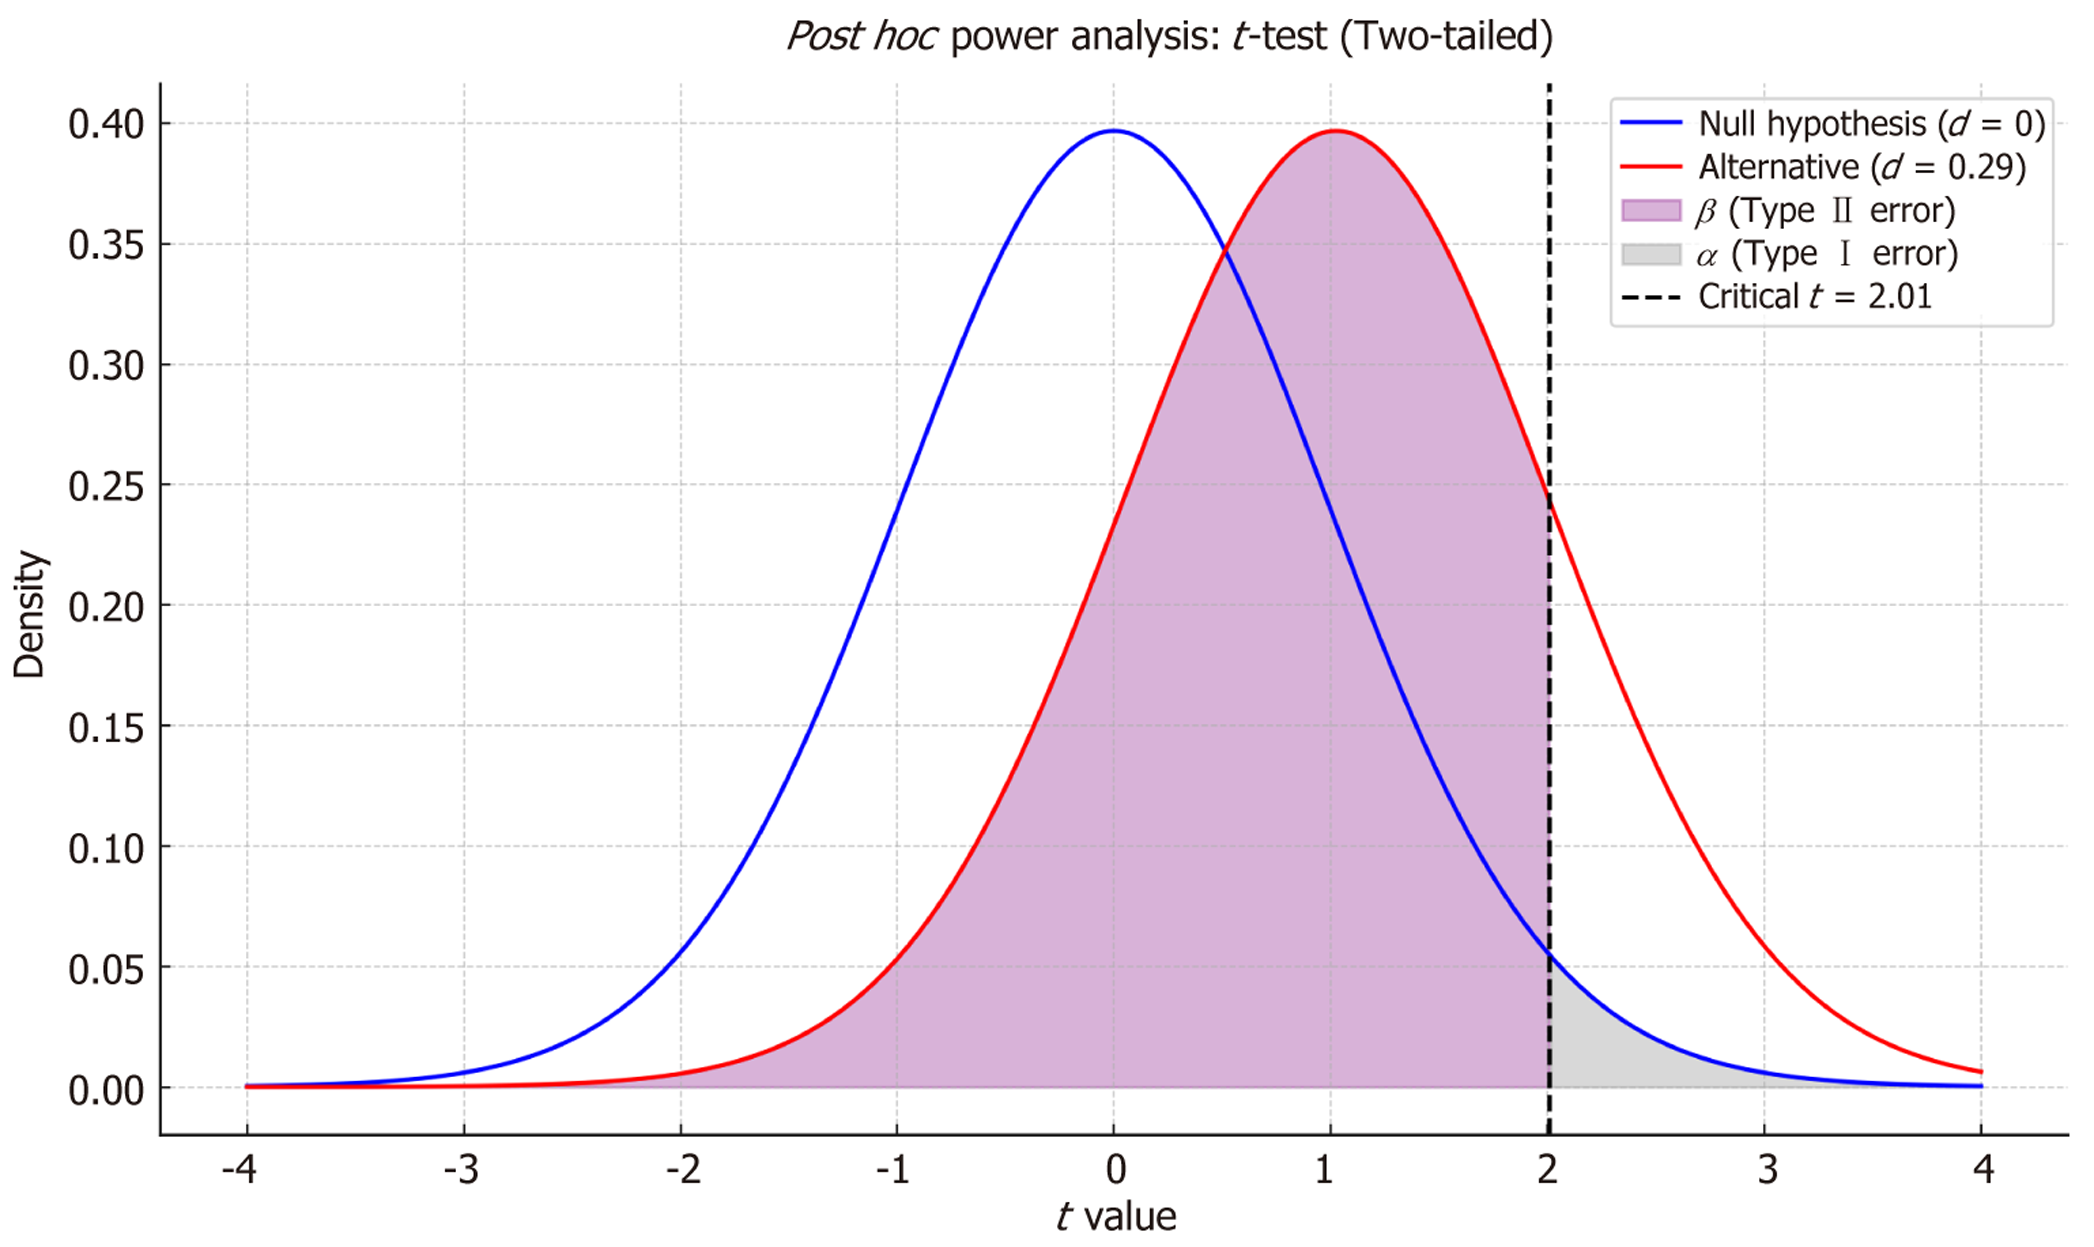
Figure 1 Post-hoc power analysis based on comparing low-density lipoprotein cholesterol levels between groups (effect size d = 0.
29, n = 25 per group). It displays the null distribution (d = 0, blue) and the alternative distribution (d = 0.29, red), with a two-tailed alpha level of 0.05 and a critical t-value of 2.01. The shaded purple area represents the type II error (β), and the gray area represents the type I error (α). The achieved power for this test was 17.1%.
- Citation: Martínez-Sánchez FD, Martínez-Vázquez SE, Gutiérrez-Monterrubio R, Muñoz-Martínez S, Garcia-Juarez I. Silymarin-alpha lipoic acid and metabolic dysfunction-associated steatotic liver disease: Insights and methodological considerations. World J Hepatol 2025; 17(9): 110162
- URL: https://www.wjgnet.com/1948-5182/full/v17/i9/110162.htm
- DOI: https://dx.doi.org/10.4254/wjh.v17.i9.110162


