Copyright
©The Author(s) 2025.
World J Hepatol. May 27, 2025; 17(5): 106124
Published online May 27, 2025. doi: 10.4254/wjh.v17.i5.106124
Published online May 27, 2025. doi: 10.4254/wjh.v17.i5.106124
Figure 1 Baseline characteristics of different chronic liver disease groups.
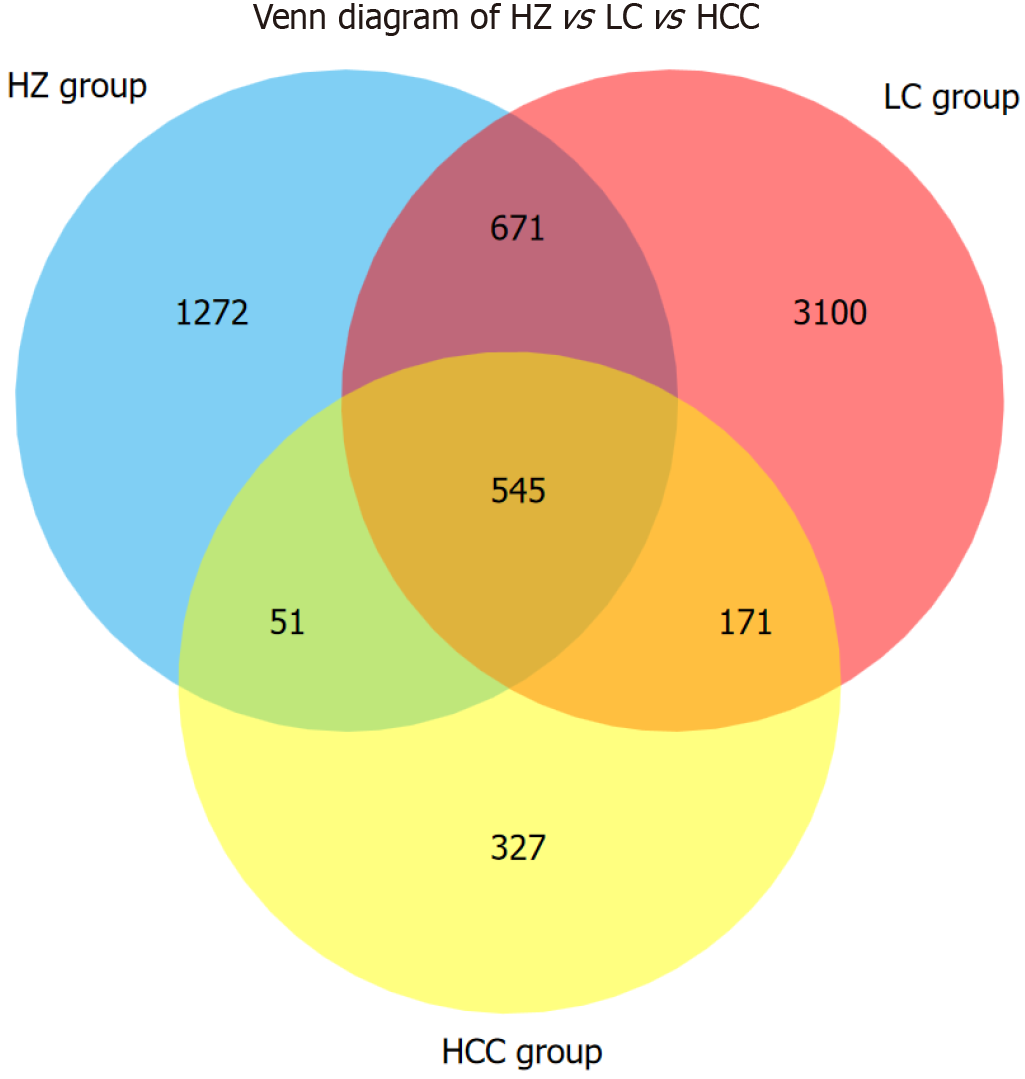
ZC: Healthy control group; HZ: Chronic hepatitis B group; LC: Liver cirrhosis; HCC: Hepatocellular carcinoma.
Figure 2 Analysis of gut microbiota diversity in healthy control group and C chronic liver disease liver disease groups.
The P value in the top left corner is derived from the Wilcoxon rank-sum test conducted across all groups depicted in the figure. Significant differences between pairwise groups are indicated by aP < 0.05, bP = 0.01, cP < 0.01, and dP < 0.01, while “ns” denotes no significant difference. A: The Chao1 index mainly reflects the number of species contained in the community, and the higher the value, the higher the estimated species richness in the community; B: The Shannon index mainly reflects the richness and evenness of species, and the larger the value, the higher the richness and evenness in the community; C: The Simpson index mainly reflects the diversity of species, and the higher the value, the higher the species diversity in the community. ZC: Healthy control group; HZ: Chronic hepatitis B group; LC: Liver cirrhosis; HCC: Hepatocellular carcinoma.
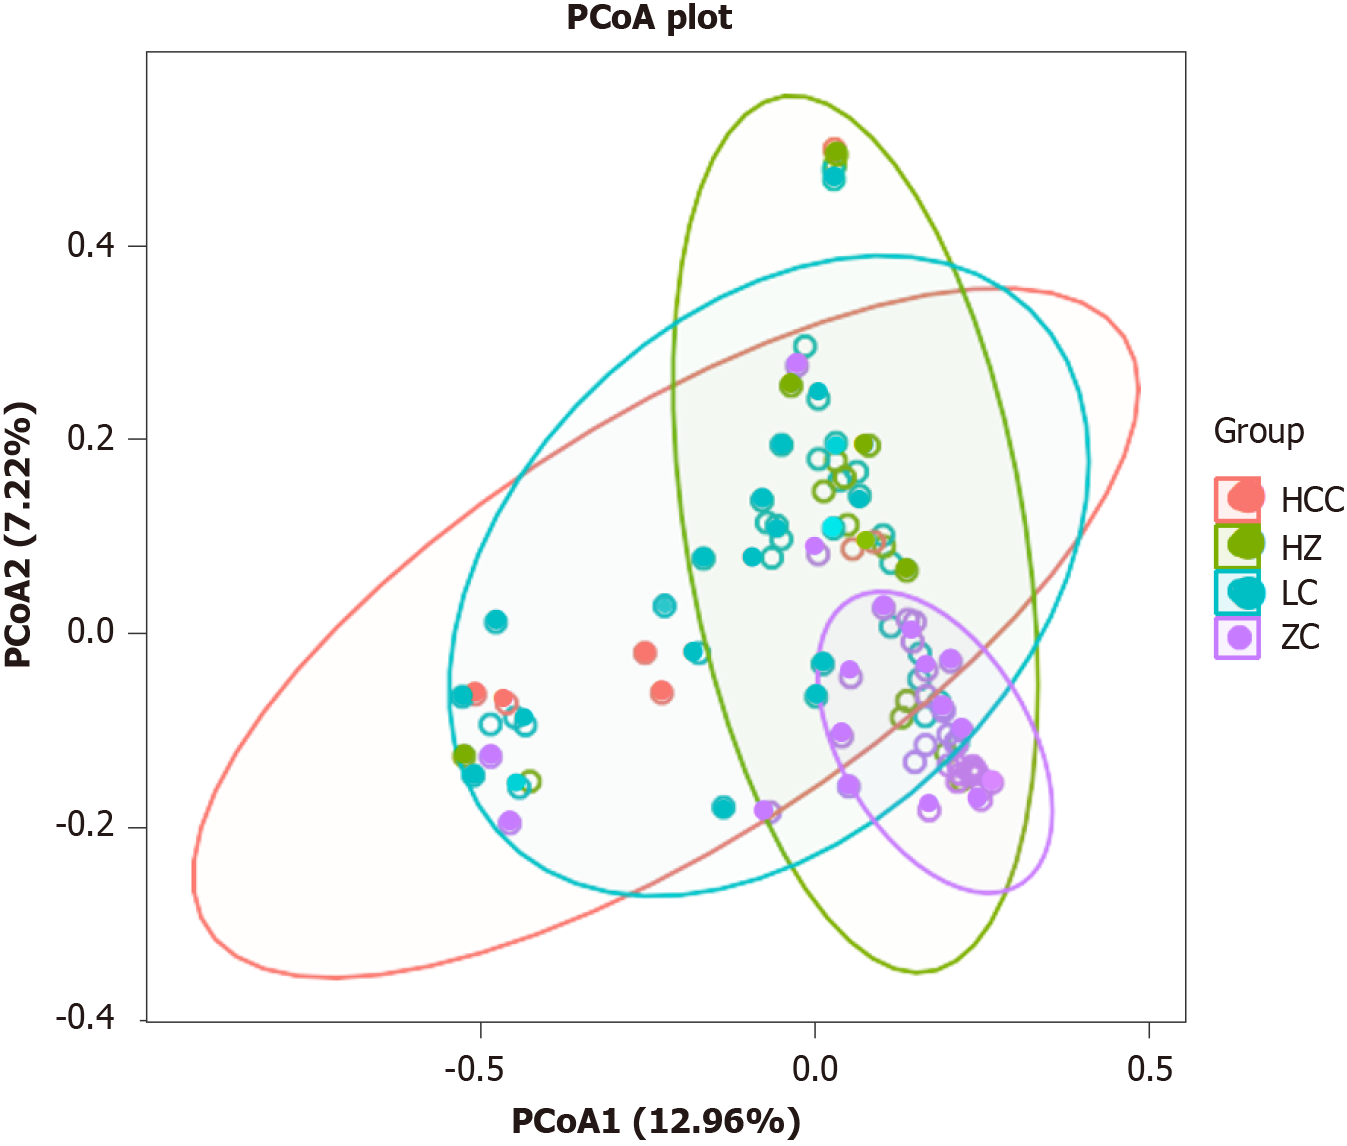
Figure 3 Analysis of gut microbiota structure between healthy control group and chronic liver disease group.
ZC: Healthy control group; HZ: Chronic hepatitis B group; LC: Liver cirrhosis; HCC: Hepatocellular carcinoma; PCoA: Principal coordinates analysis.
Figure 4 Microbiota in chronic liver disease and healthy controls: findings from abundance comparisons at phylum, family, and genus levels.
A and B: Comparison of gut microbiota (GM) abundance at the phylum level between healthy control group and chronic liver disease group. In this figure, the X-axis categorizes the sample groups, and the Y-axis shows the relative abundance of specific taxa. Different colors represent different species at the same taxonomic level. The bar chart illustrates the composition of highly expressed species within each group, facilitating the comparison of species composition and expression patterns across groups; C and D: Comparison of GM abundance at the family level between healthy control group and chronic liver disease group; E and F: Comparison of GM abundance at the genus level between healthy control group and chronic liver disease group. ZC: Healthy control group; HZ: Chronic hepatitis B group; LC: Liver cirrhosis; HCC: Hepatocellular carcinoma.
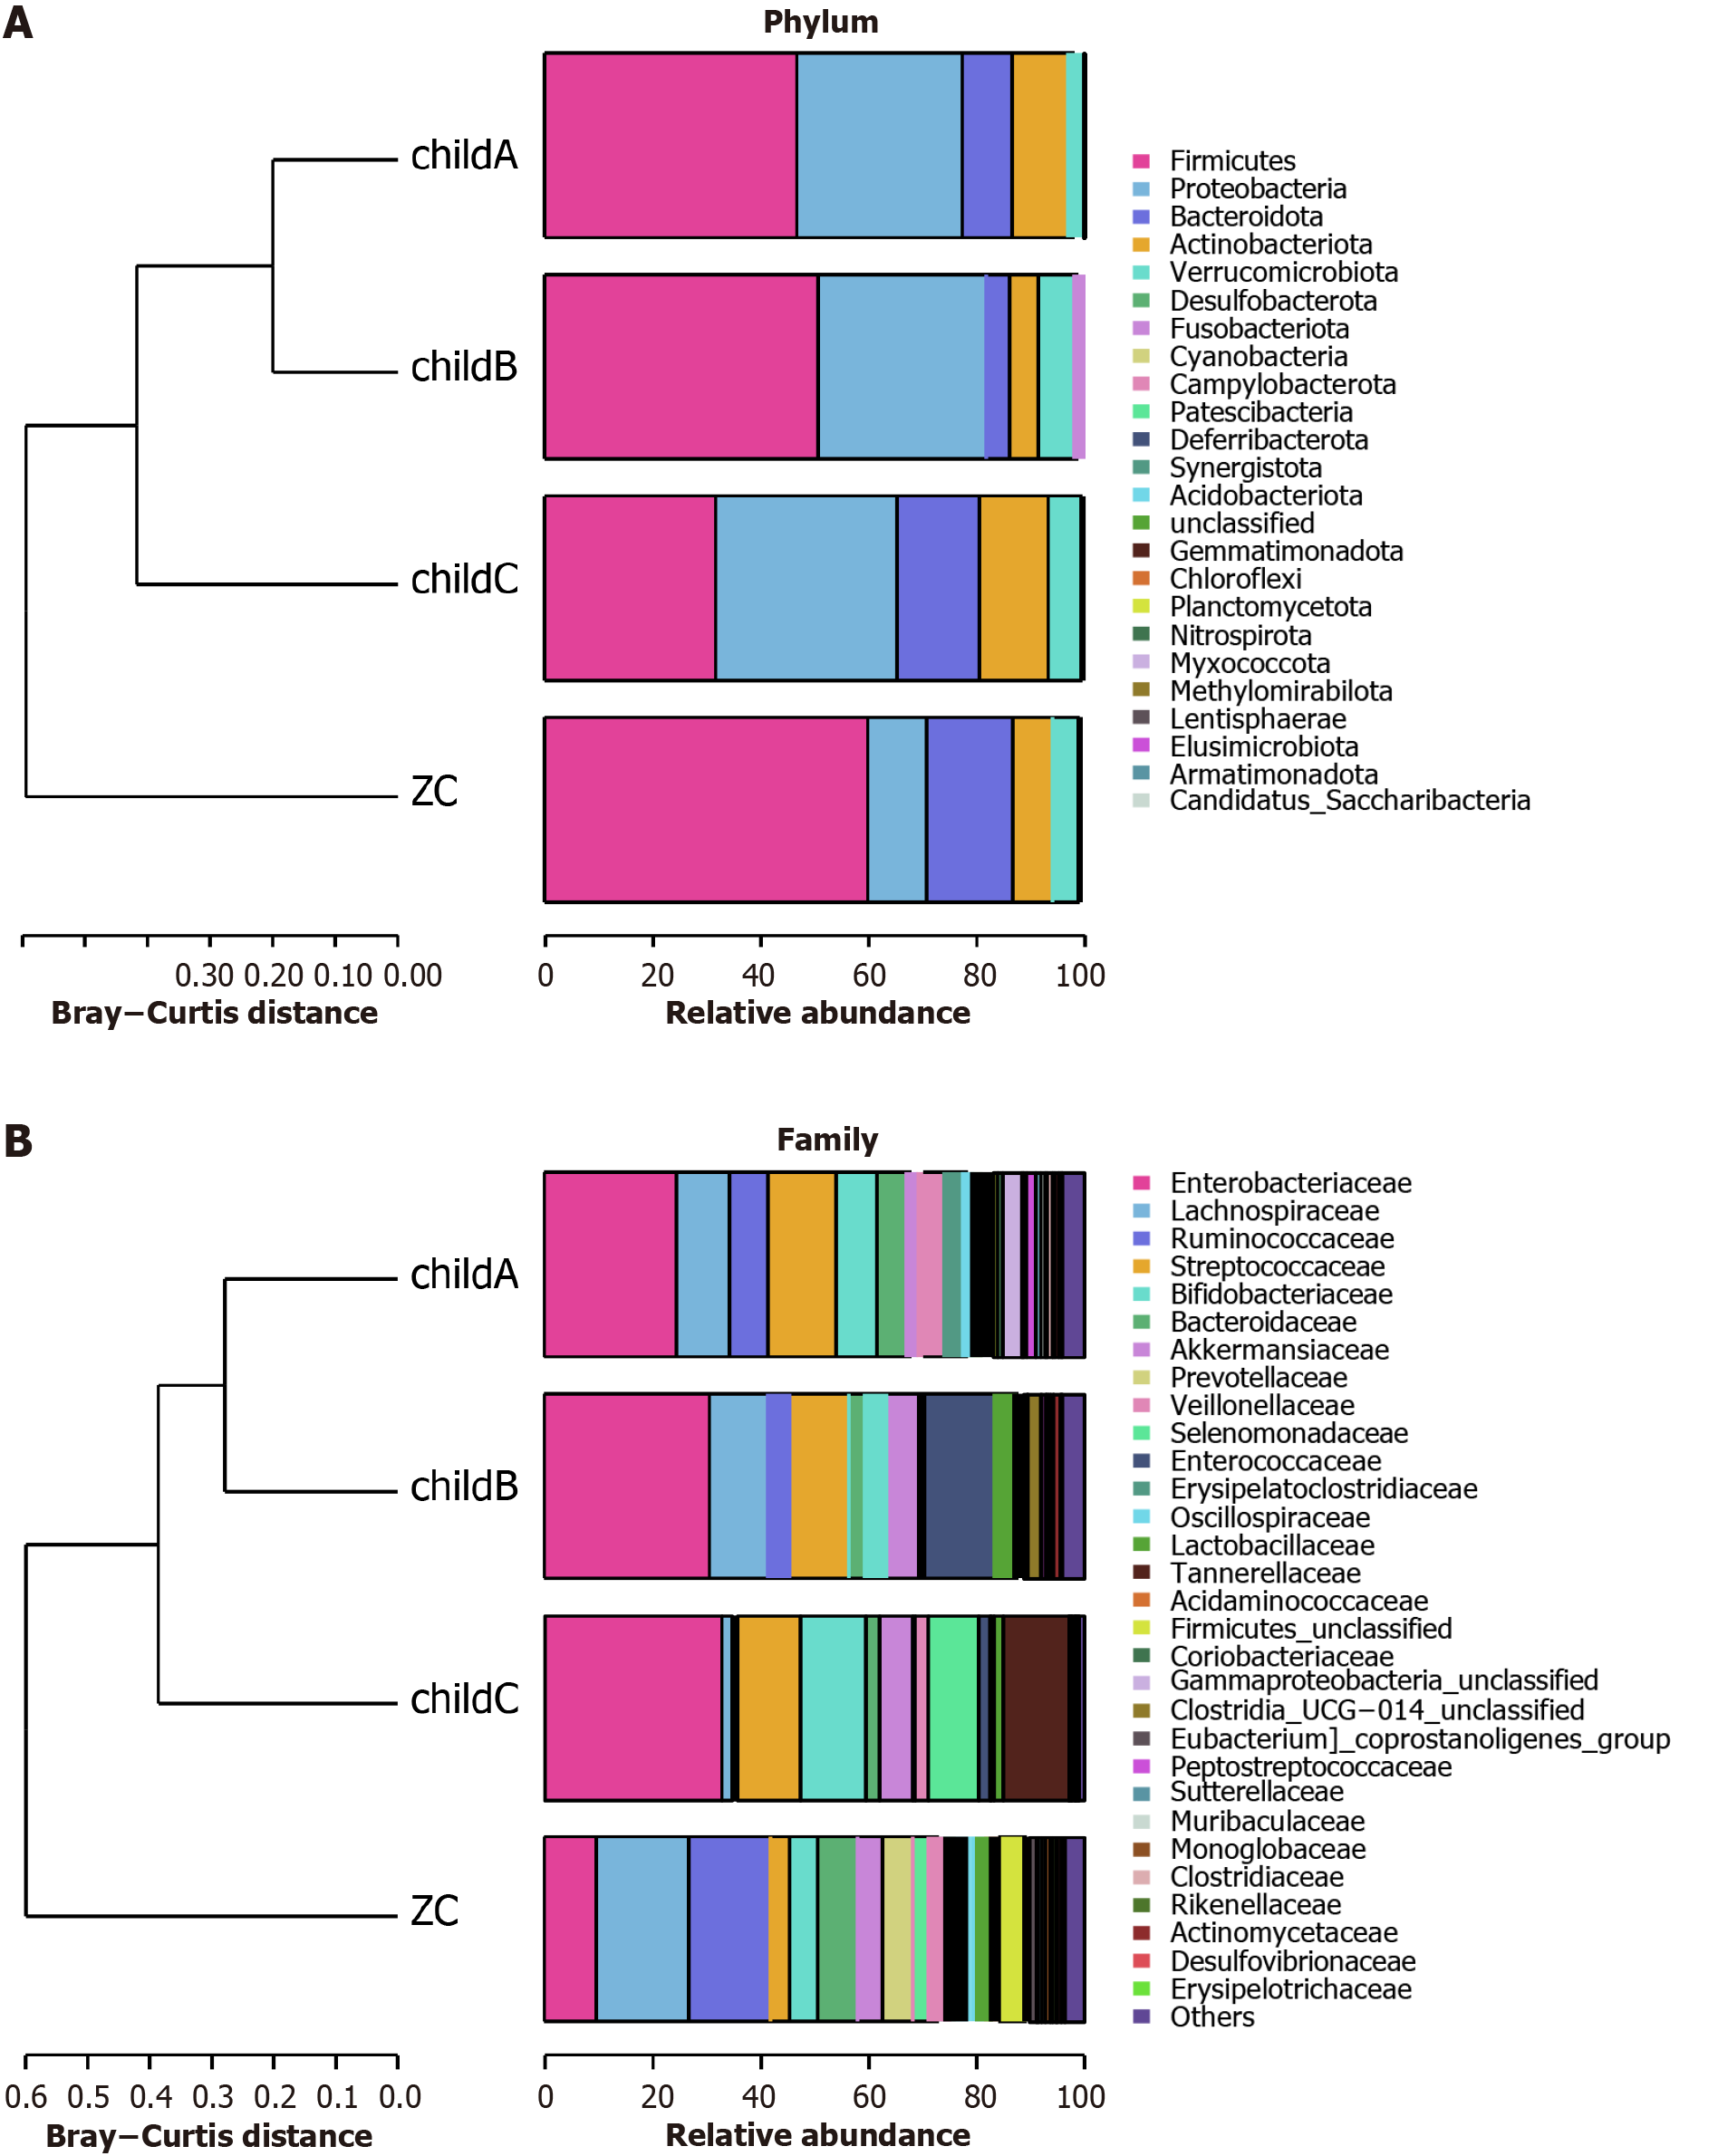
Figure 5 Abundance in cirrhosis patients based on Child-Pugh classifications: Differences at phylum and family levels.
A: Species abundance analysis at the phylum level for cirrhosis patients with different Child-Pugh classifications; B: Species abundance analysis at the family level for cirrhosis patients with different Child-Pugh classifications. ZC: Healthy control group.
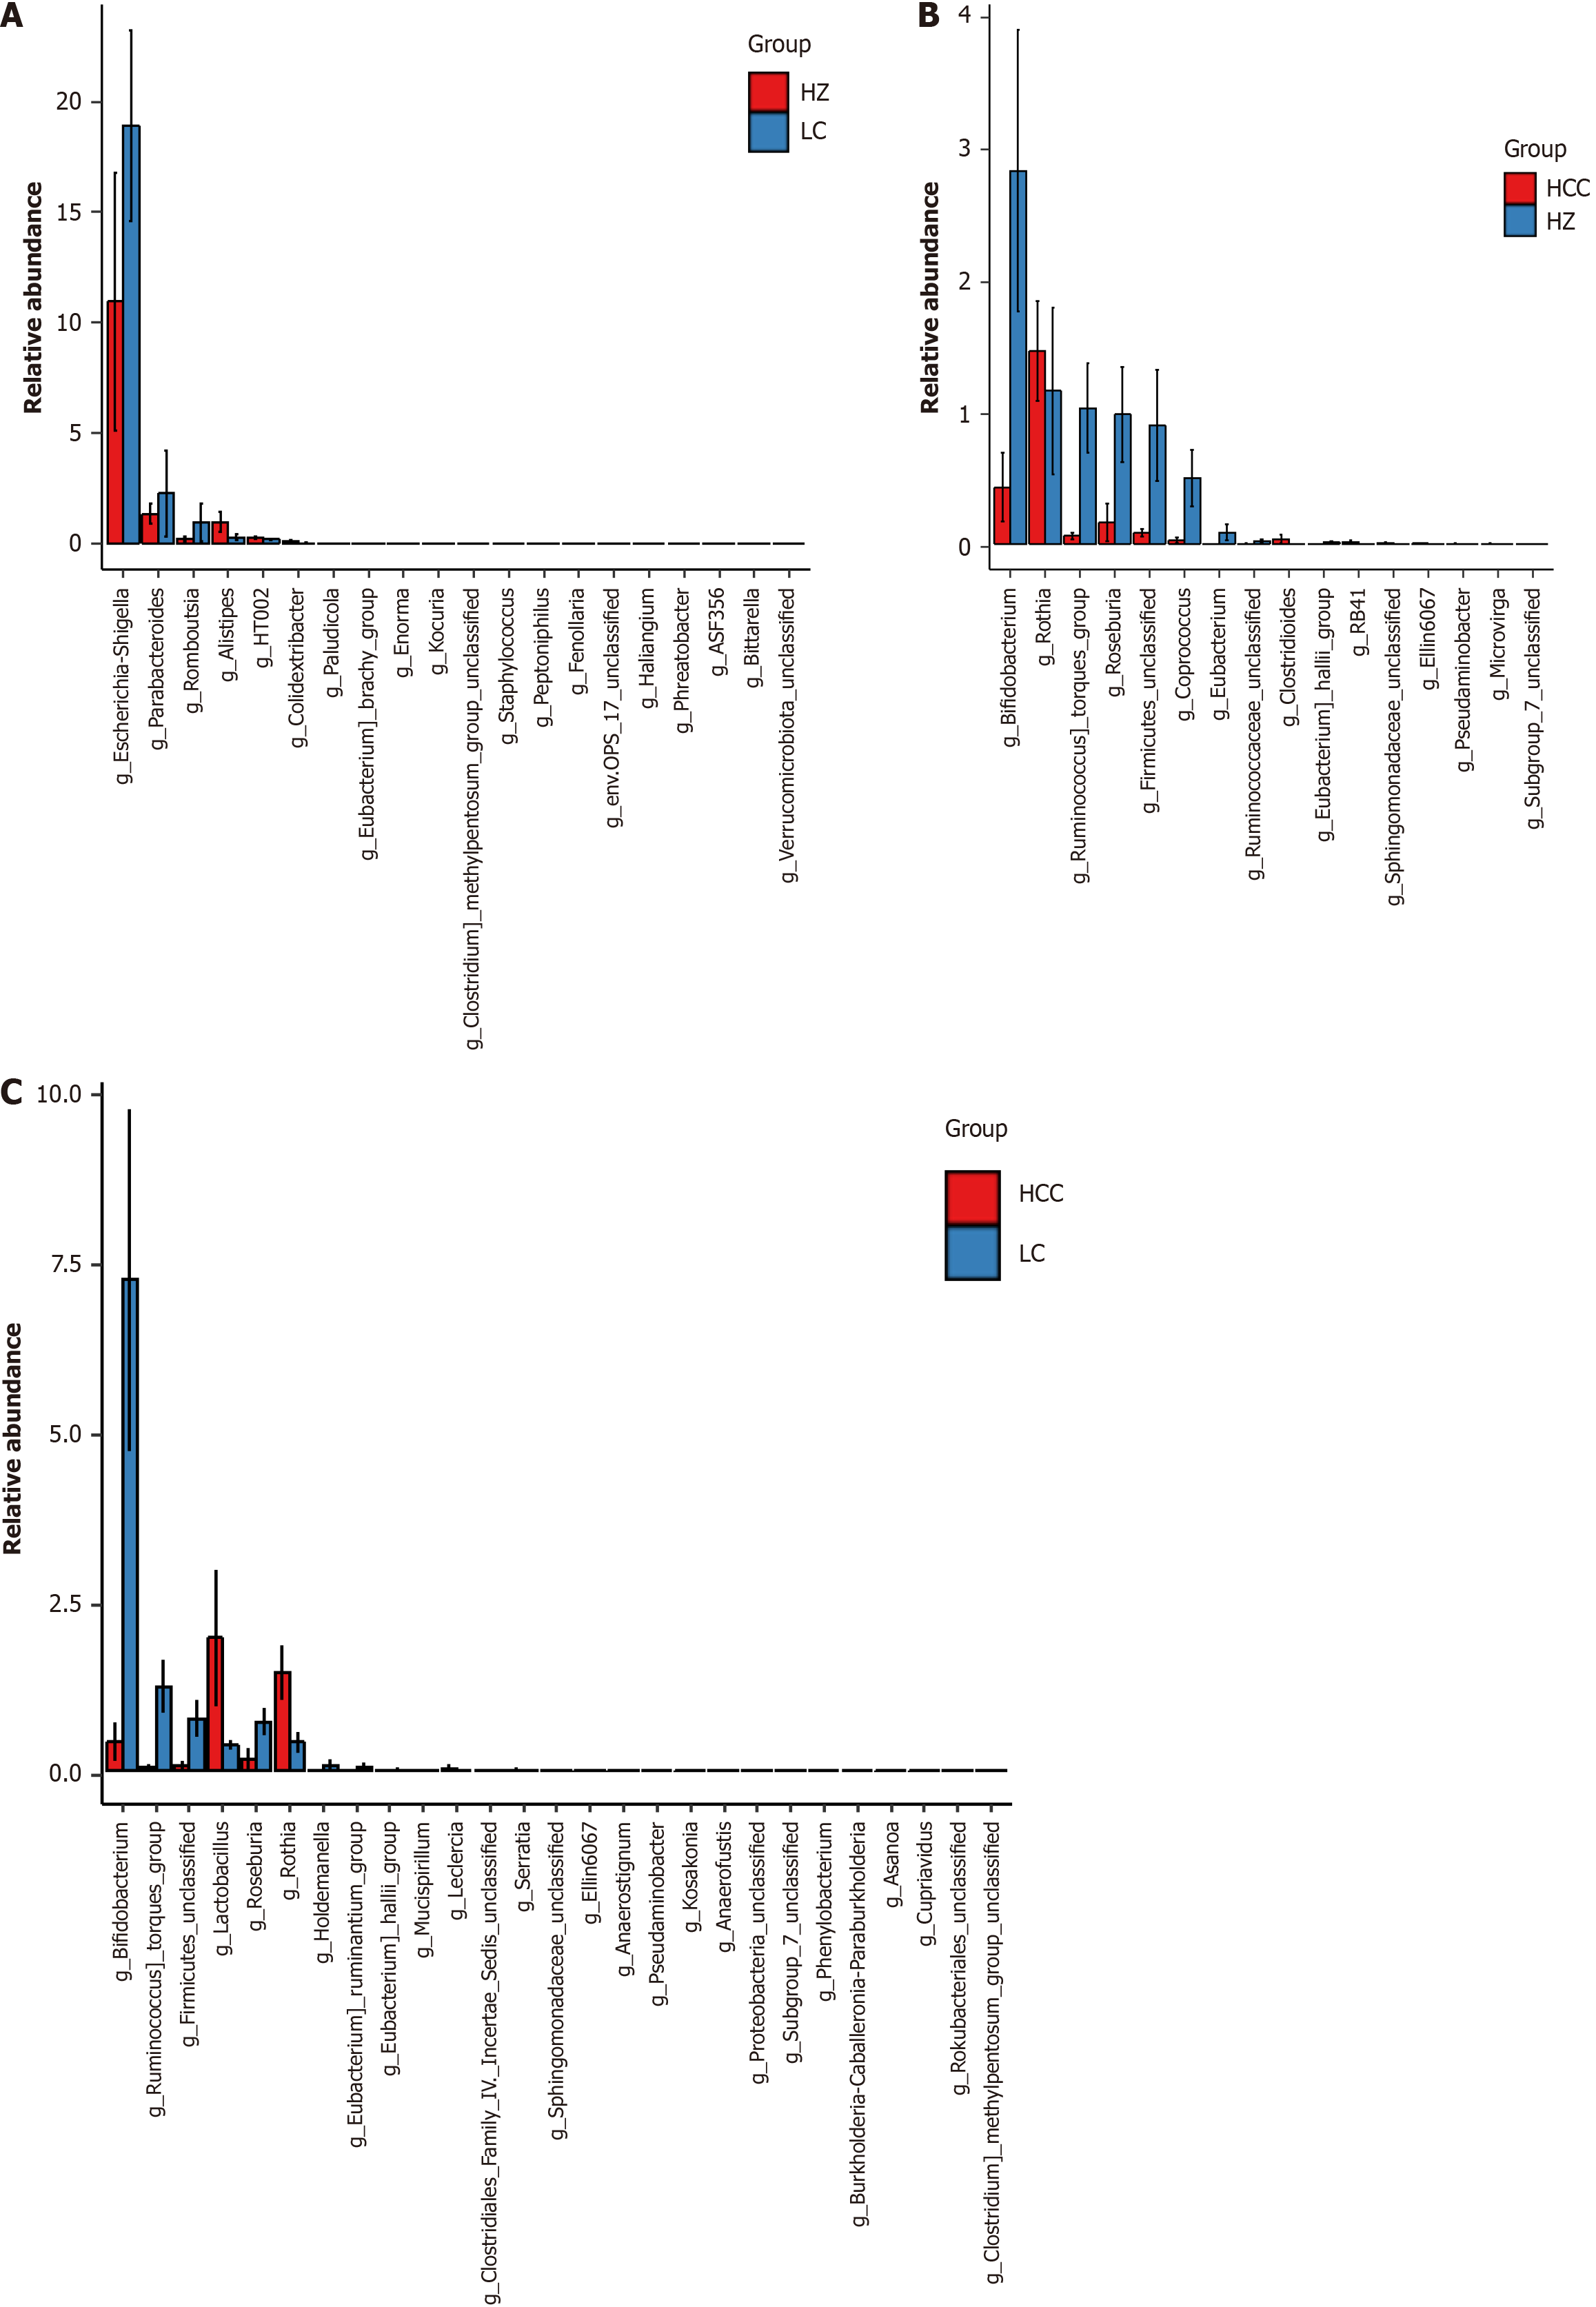
Figure 6 Analysis of differential species at genus level in chronic hepatitis B, liver cirrhosis, and hepatocellular carcinoma groups.
A: Differential species analysis at the genus level between the chronic hepatitis B group and the cirrhosis group. In the figure, the X-axis lists differential species, arranged from left to right in order of decreasing abundance, and the Y-axis displays the relative abundance. The height of the bars visually quantifies the abundance of each differential species across the various groups; B: Differential species analysis at the genus level between the chronic hepatitis B group and the hepatocellular carcinoma group; C: Differential species analysis at the genus level between the hepatocellular carcinoma group and the liver cirrhosis group. HZ: Chronic hepatitis B group; LC: Liver cirrhosis; HCC: Hepatocellular carcinoma.
Figure 7 Microbiota characteristics of healthy controls and different liver disease groups: Linear discriminant analysis effect size analysis reveals significant differential biomarkers.
A and B: Linear discriminant analysis effect size (LEfSe) analysis between the chronic hepatitis B group and the healthy control group. The primary objective of LEfSe analysis is to compare two or more groups and identify marker species that exhibit statistically significant differences in abundance across the taxonomic levels of phylum, class, order, family, genus, and species; C and D: LEfSe analysis between the cirrhosis group and the healthy control group; E and F: LEfSe analysis between the hepatocellular carcinoma group and the healthy control group. LAD: Linear discriminant analysis; ZC: Healthy control group; HZ: Chronic hepatitis B group; LC: Liver cirrhosis; HCC: Hepatocellular carcinoma.
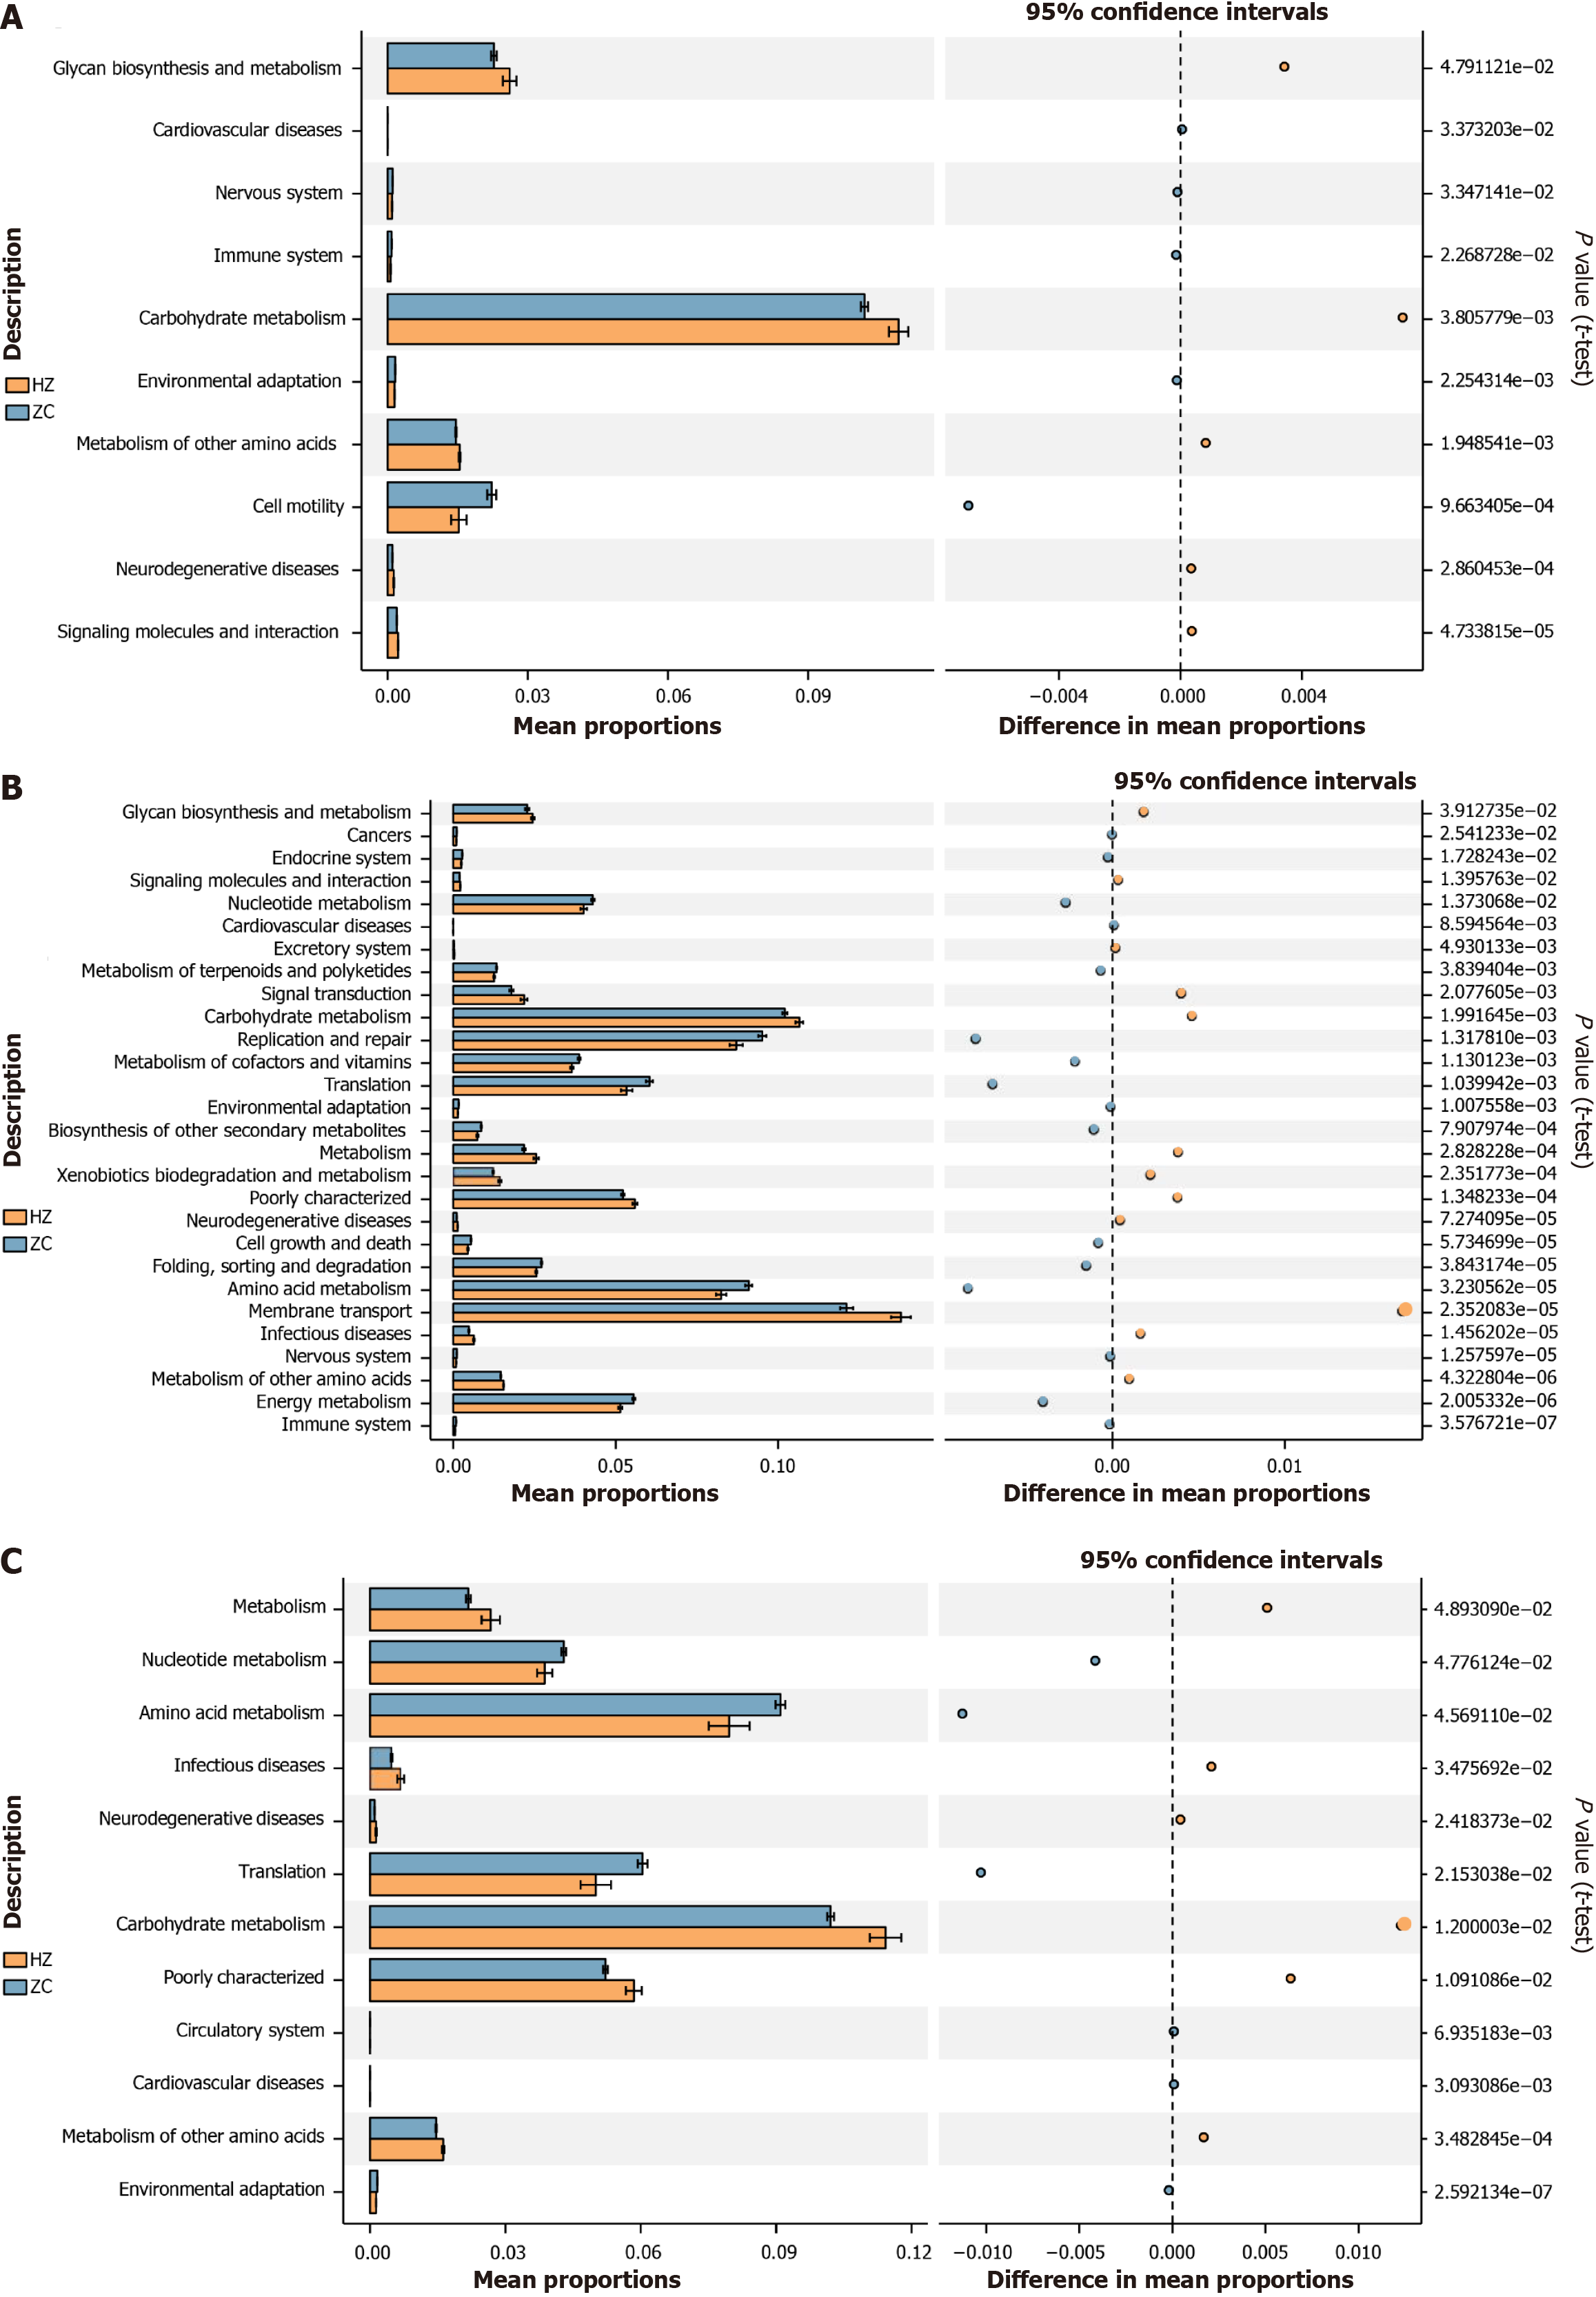
Figure 8 The gut microbiota function prediction: contrasting the healthy control with chronic hepatitis B, cirrhosis, and hepatocellular carcinoma group.
A: Prediction of gut microbiota function between the chronic hepatitis B group and the healthy control group. Utilizing PICRUSt software and Kyoto Encyclopedia of Genes and Genomes enrichment analysis, this study functionally annotated the 16S rDNA gene sequencing data with the Kyoto Encyclopedia of Genes and Genomes Orthology database to further analyze the metabolic functions at level 2 of the GM. Functional differences were presented, with P values < 0.05 from pairwise t-test comparisons; B: Prediction of GM function between the cirrhosis group and the healthy control group; C: Prediction of GM function between the hepatocellular carcinoma group and the healthy control group. ZC: Healthy control group; HZ: Chronic hepatitis B group; LC: Liver cirrhosis; HCC: Hepatocellular carcinoma.
- Citation: Ma C, Yang J, Fu XN, Luo JY, Liu P, Zeng XL, Li XY, Zhang SL, Zheng S. Microbial characteristics of gut microbiome dysbiosis in patients with chronic liver disease. World J Hepatol 2025; 17(5): 106124
- URL: https://www.wjgnet.com/1948-5182/full/v17/i5/106124.htm
- DOI: https://dx.doi.org/10.4254/wjh.v17.i5.106124


