Copyright
©The Author(s) 2025.
World J Hepatol. Apr 27, 2025; 17(4): 104890
Published online Apr 27, 2025. doi: 10.4254/wjh.v17.i4.104890
Published online Apr 27, 2025. doi: 10.4254/wjh.v17.i4.104890
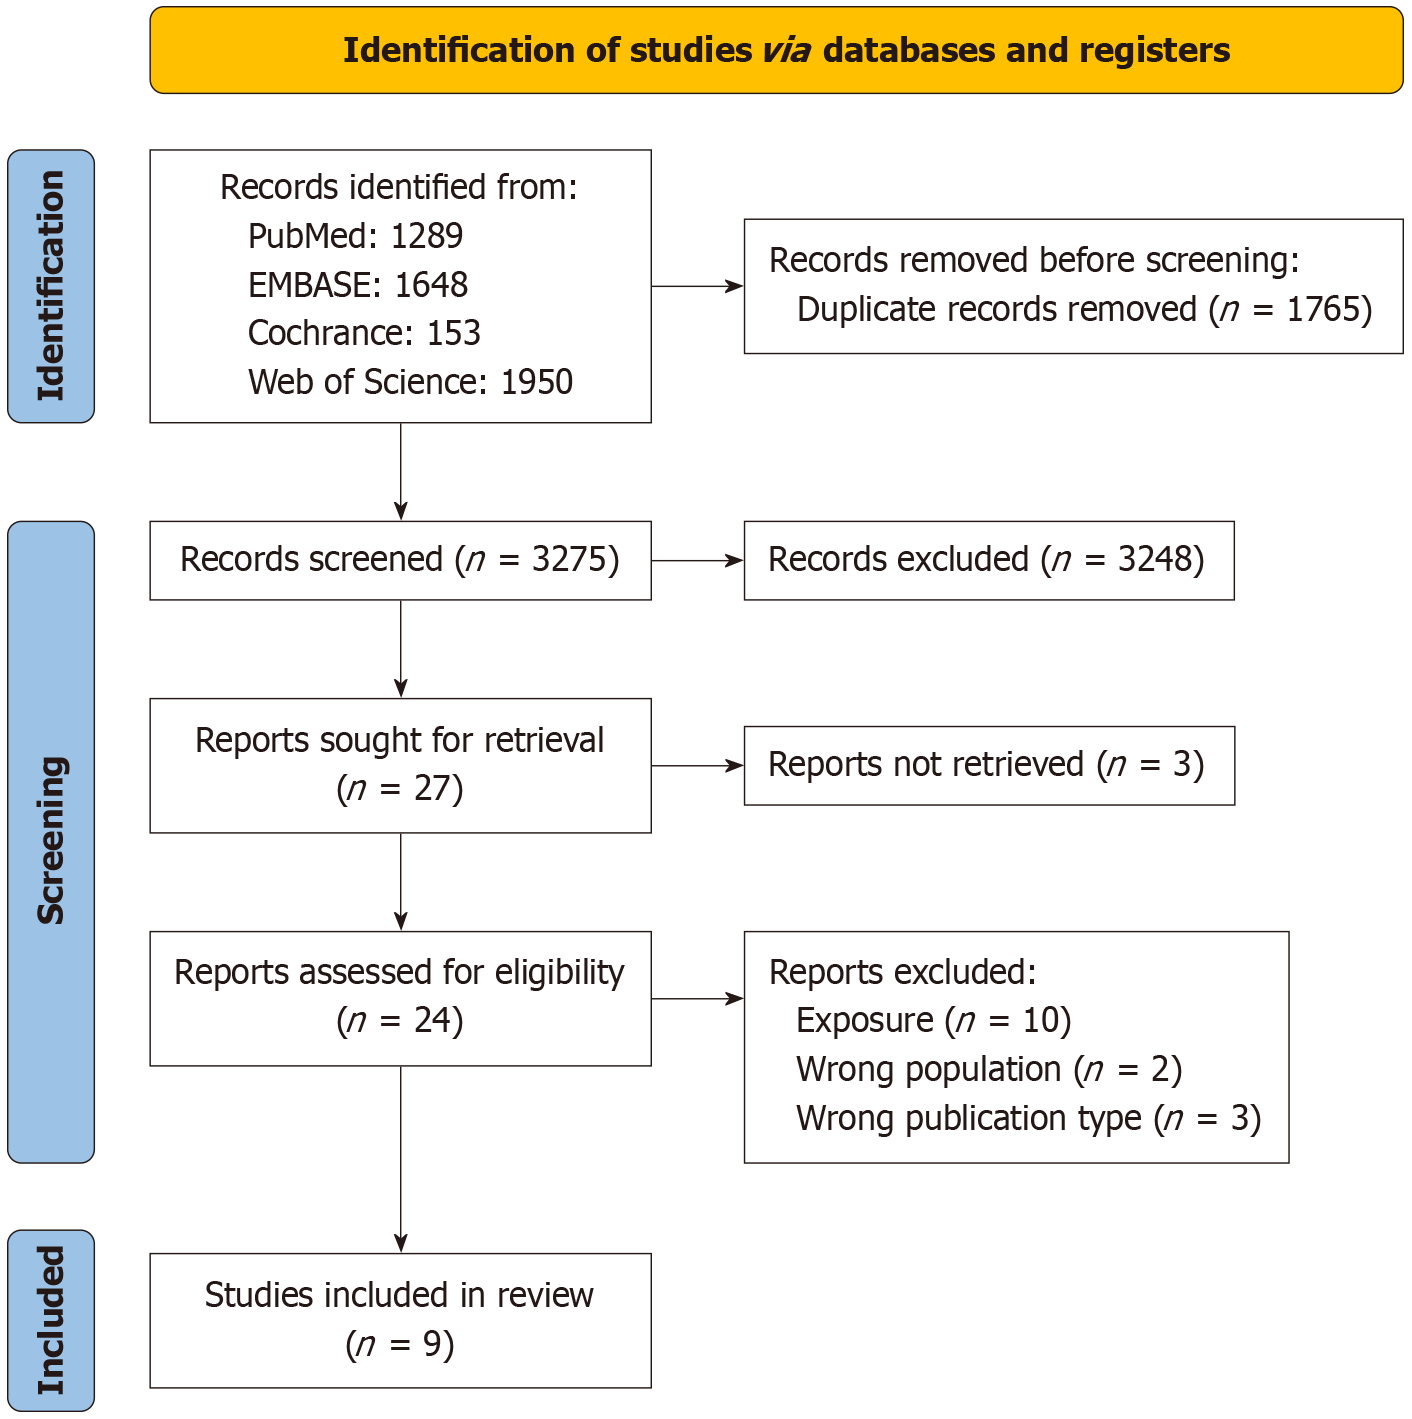
Figure 1 Literature screening process diagram.
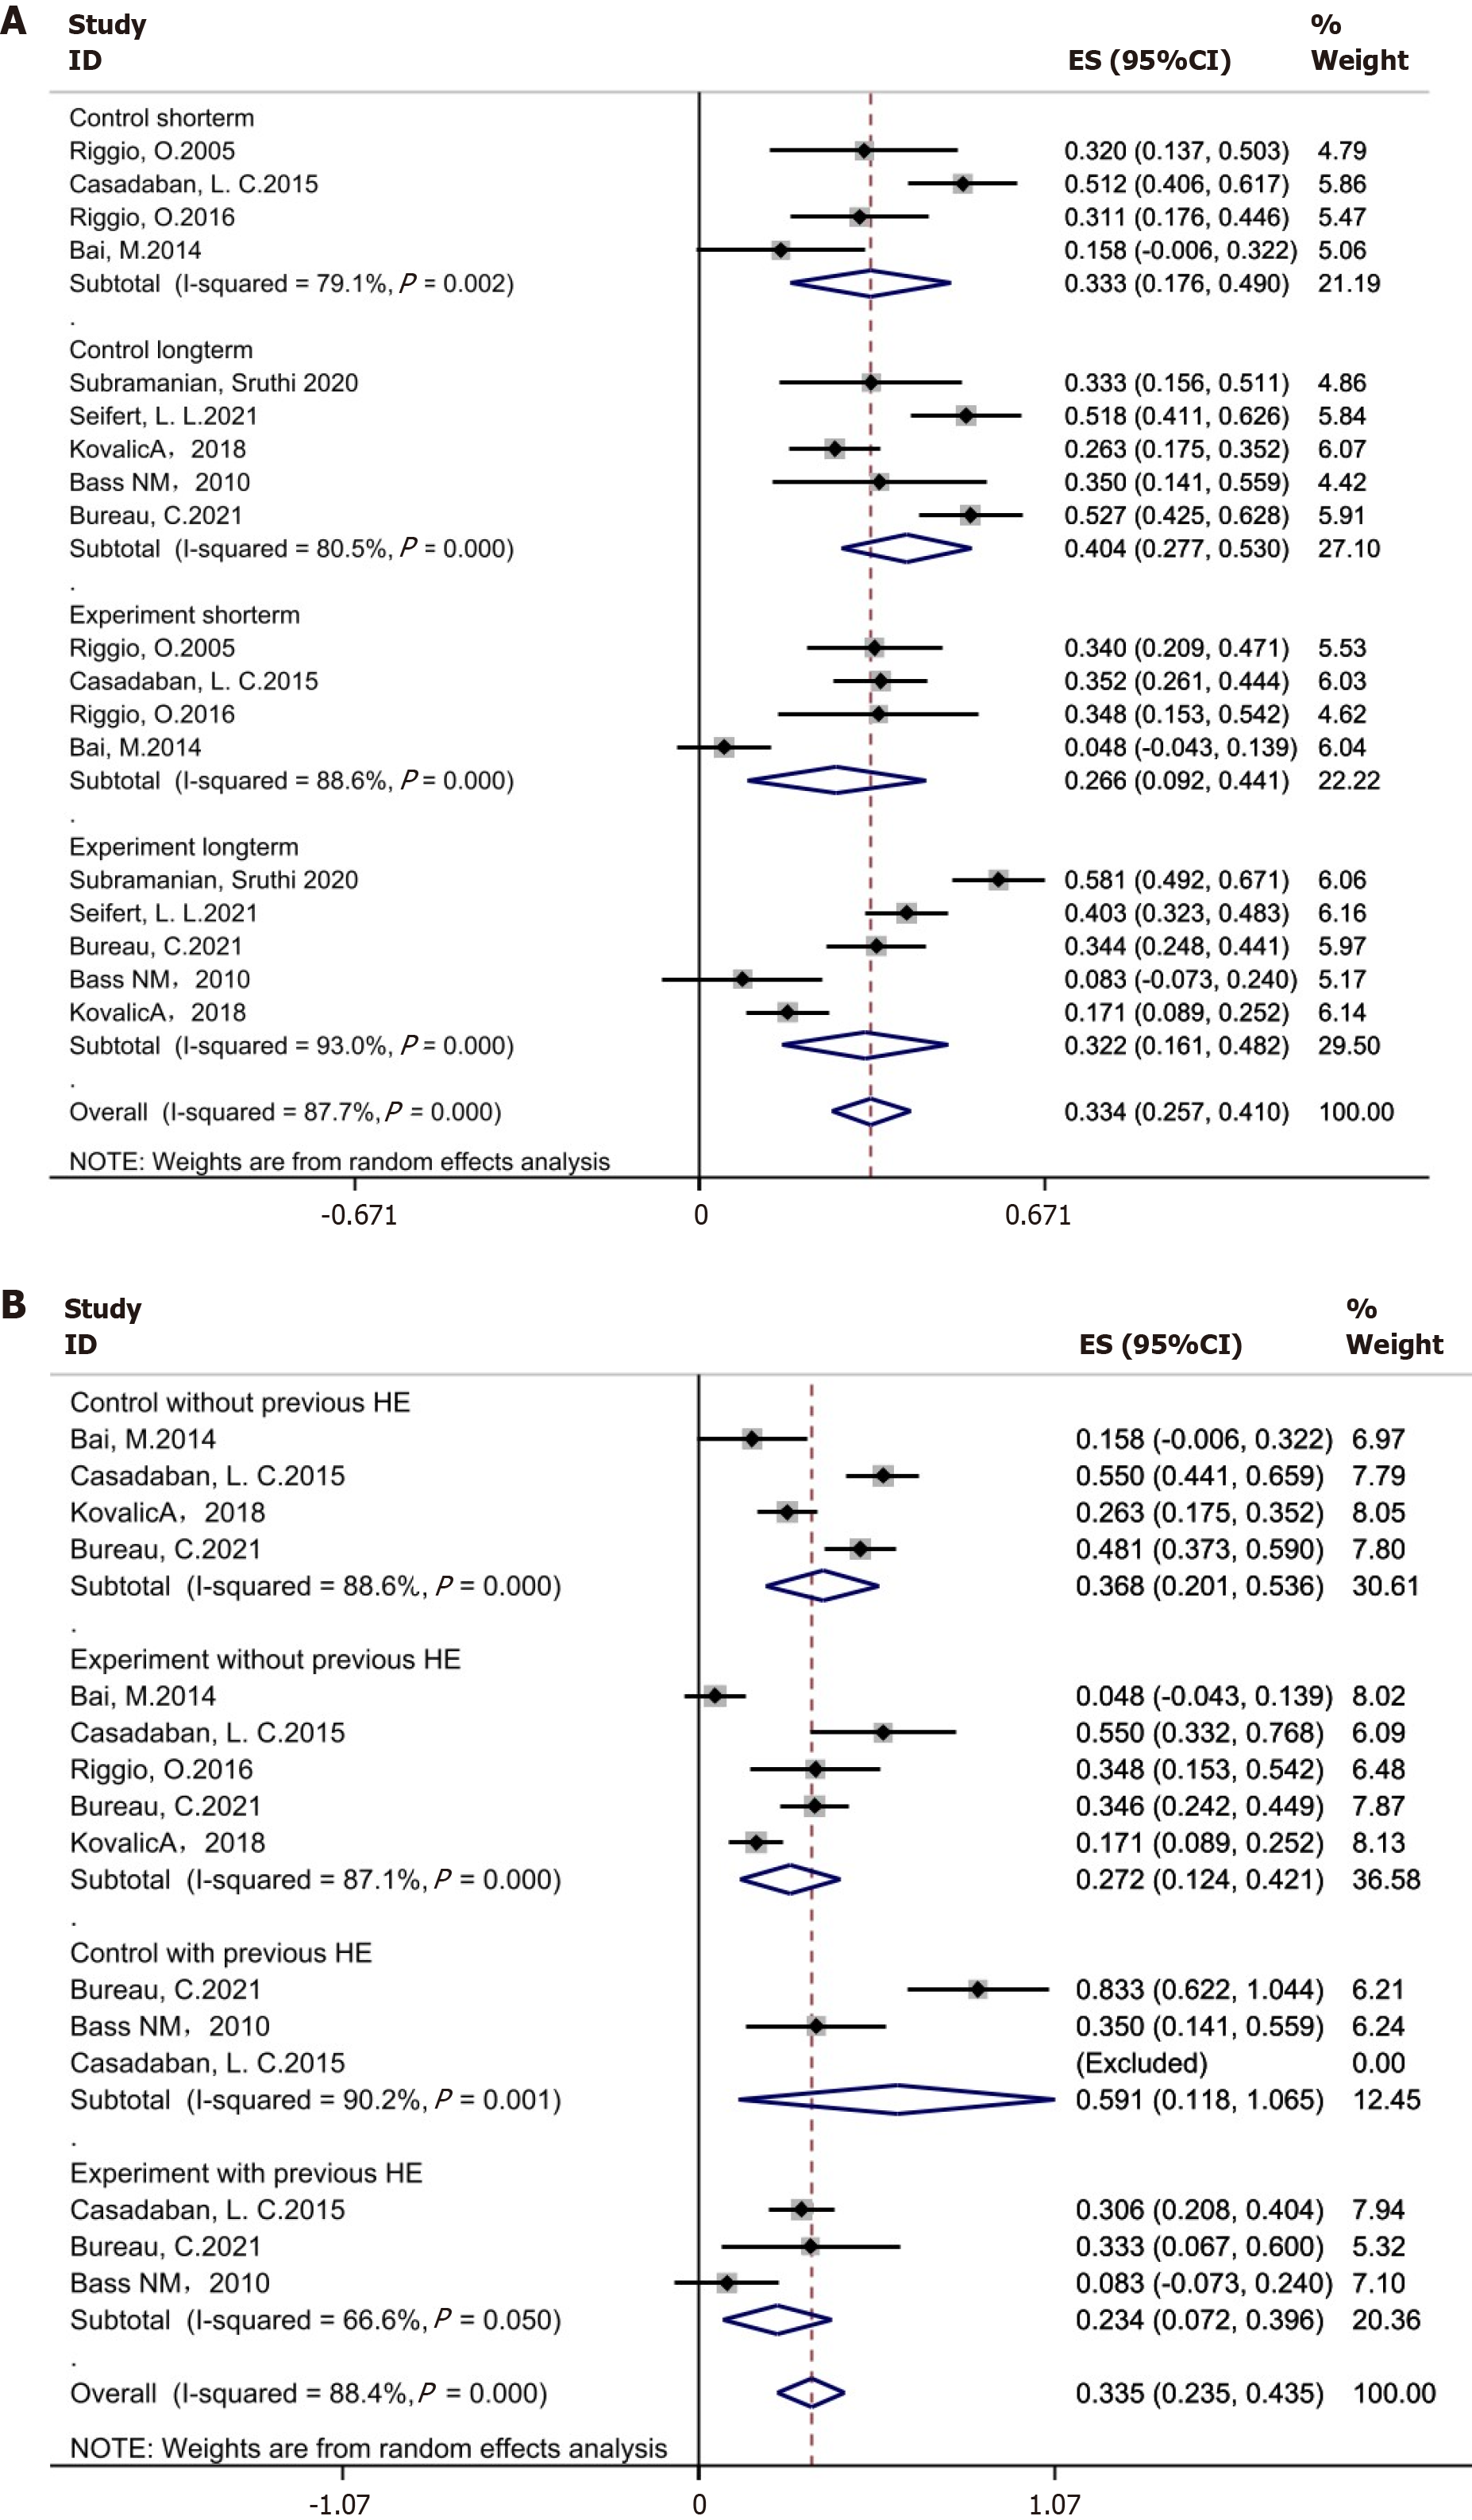
Figure 2 The incidence of hepatic encephalopathy after transjugular intrahepatic portosystemic shunt in the drug intervention group and the untreated group.
A: The incidence of hepatic encephalopathy (HE) at different times; B: The incidence of HE after transjugular intrahepatic portosystemic shunt in patients with or without a history of HE.
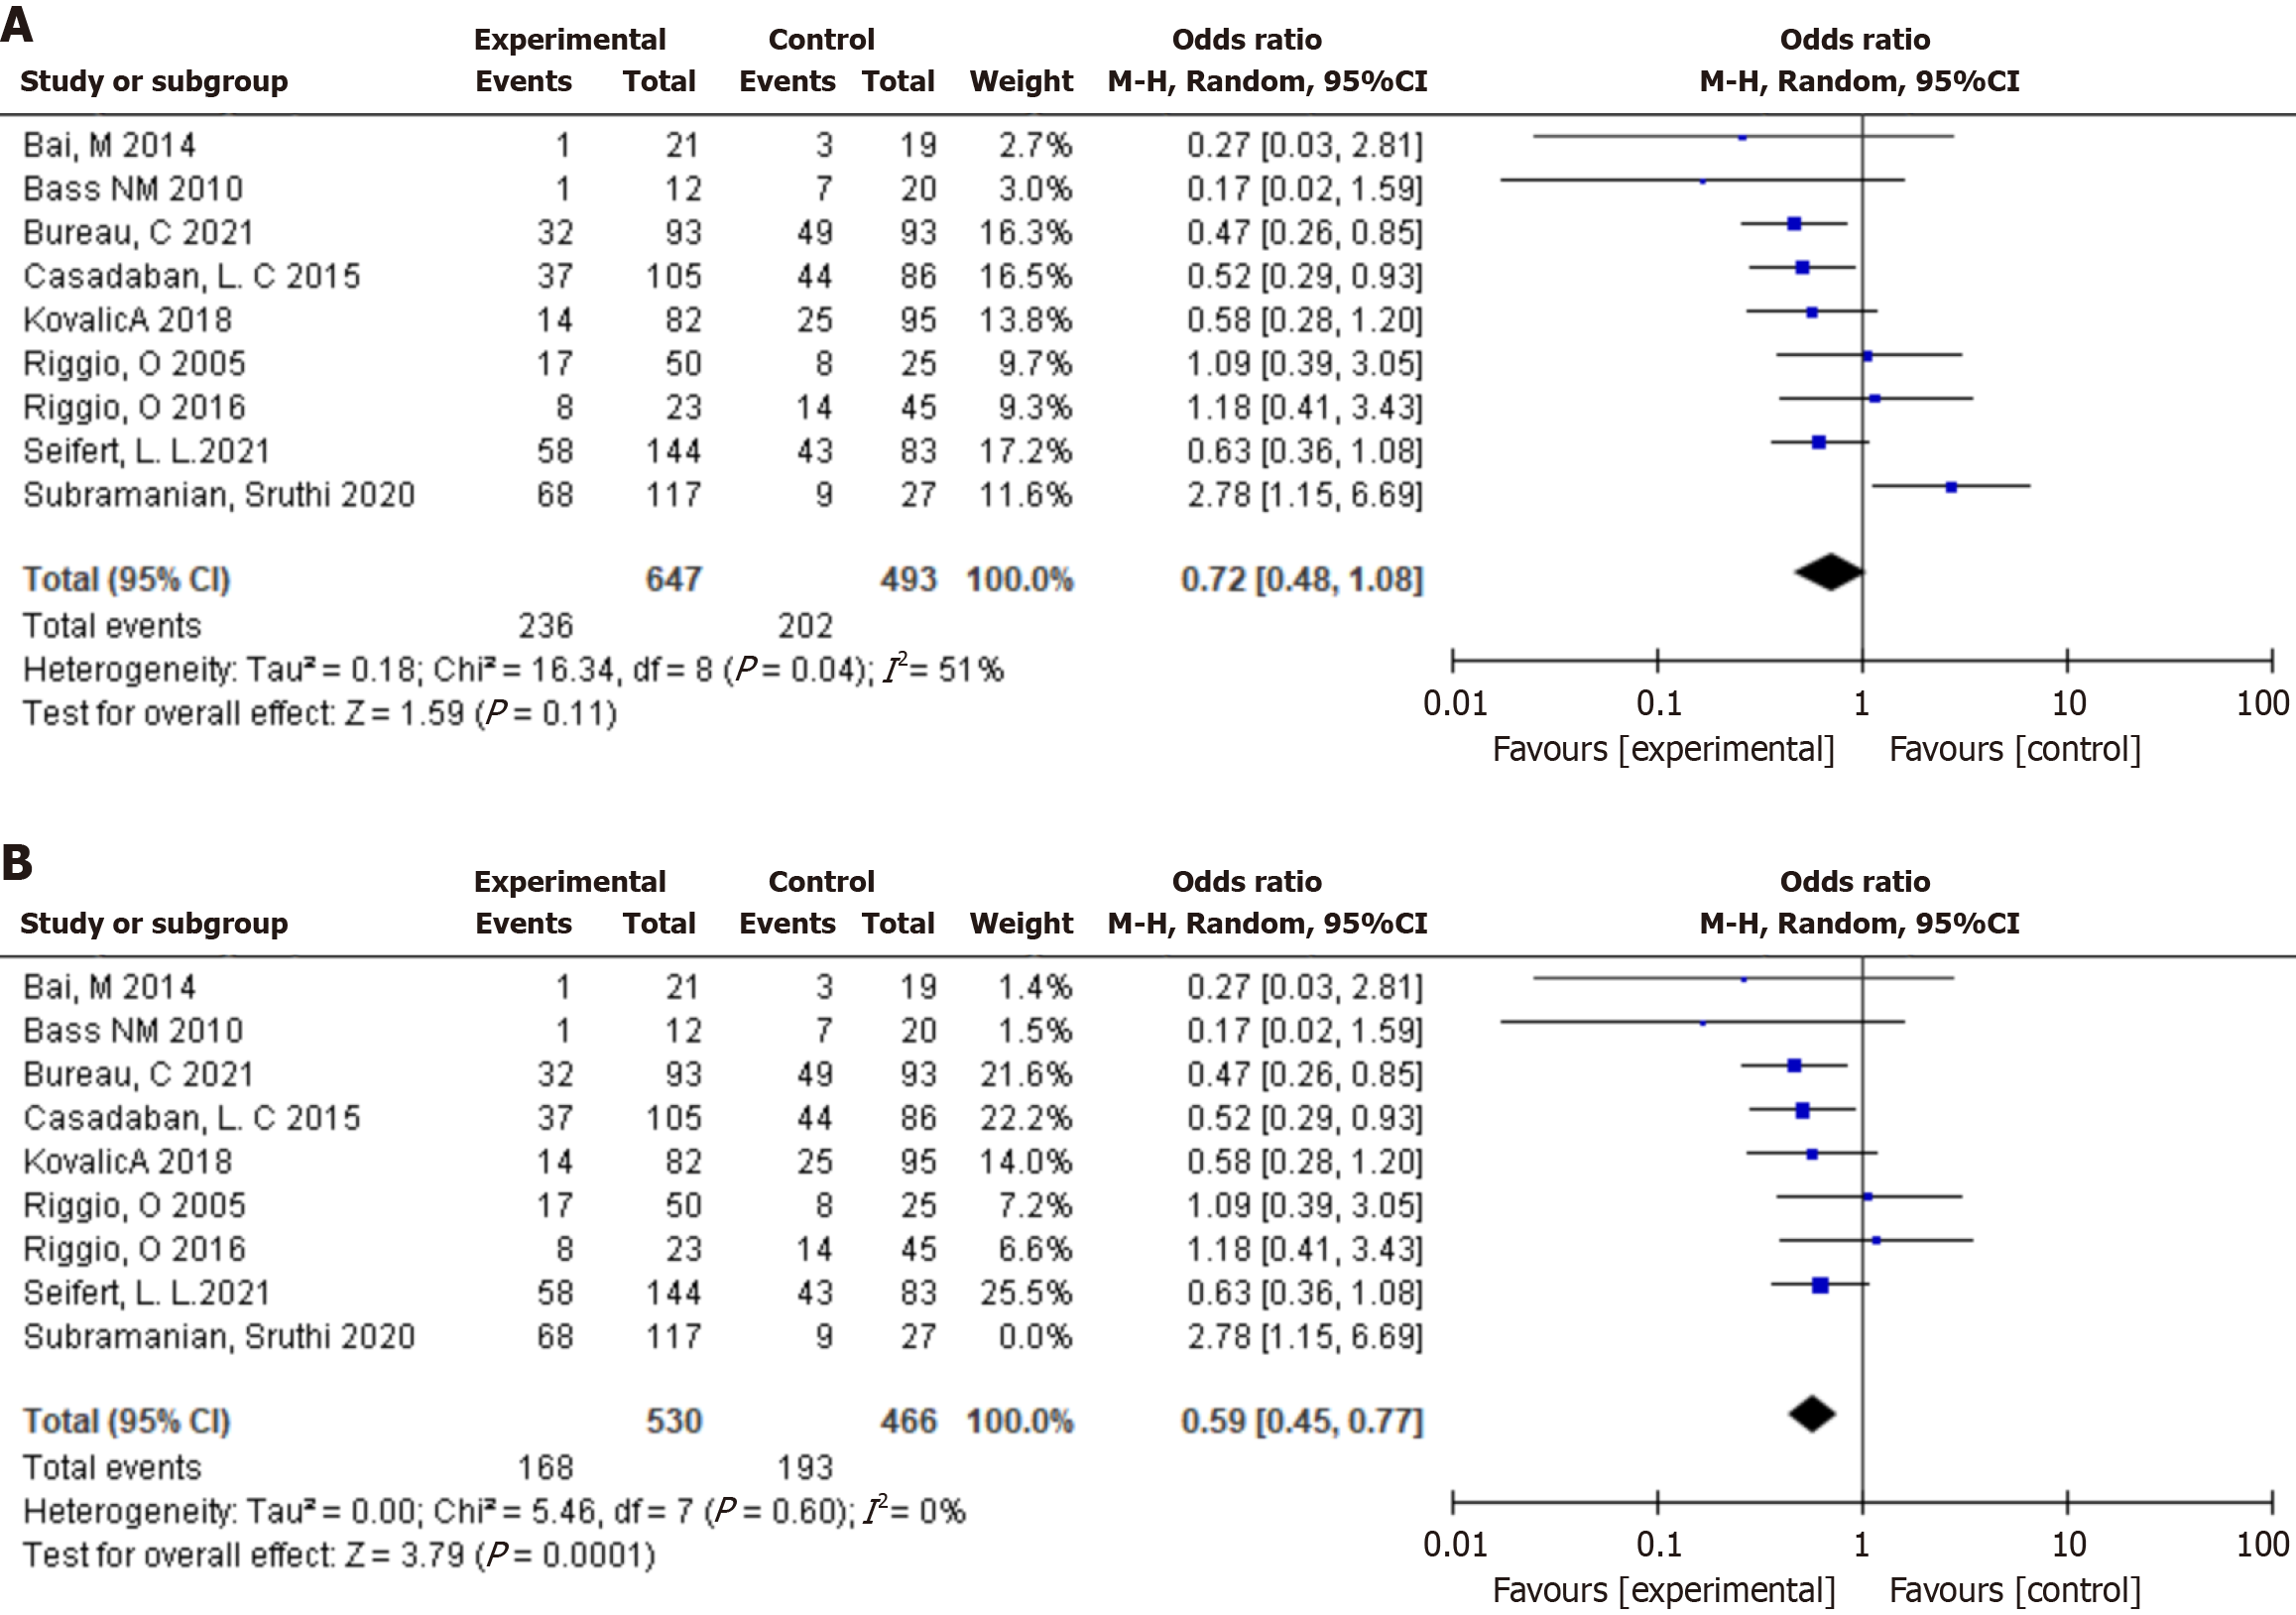
Figure 3 Efficacy of drug intervention in preventing hepatic encephalopathy after transjugular intrahepatic portosystemic shunt.
A: The analysis results of all literature; B: The analysis results after removing heterogeneous source literature.
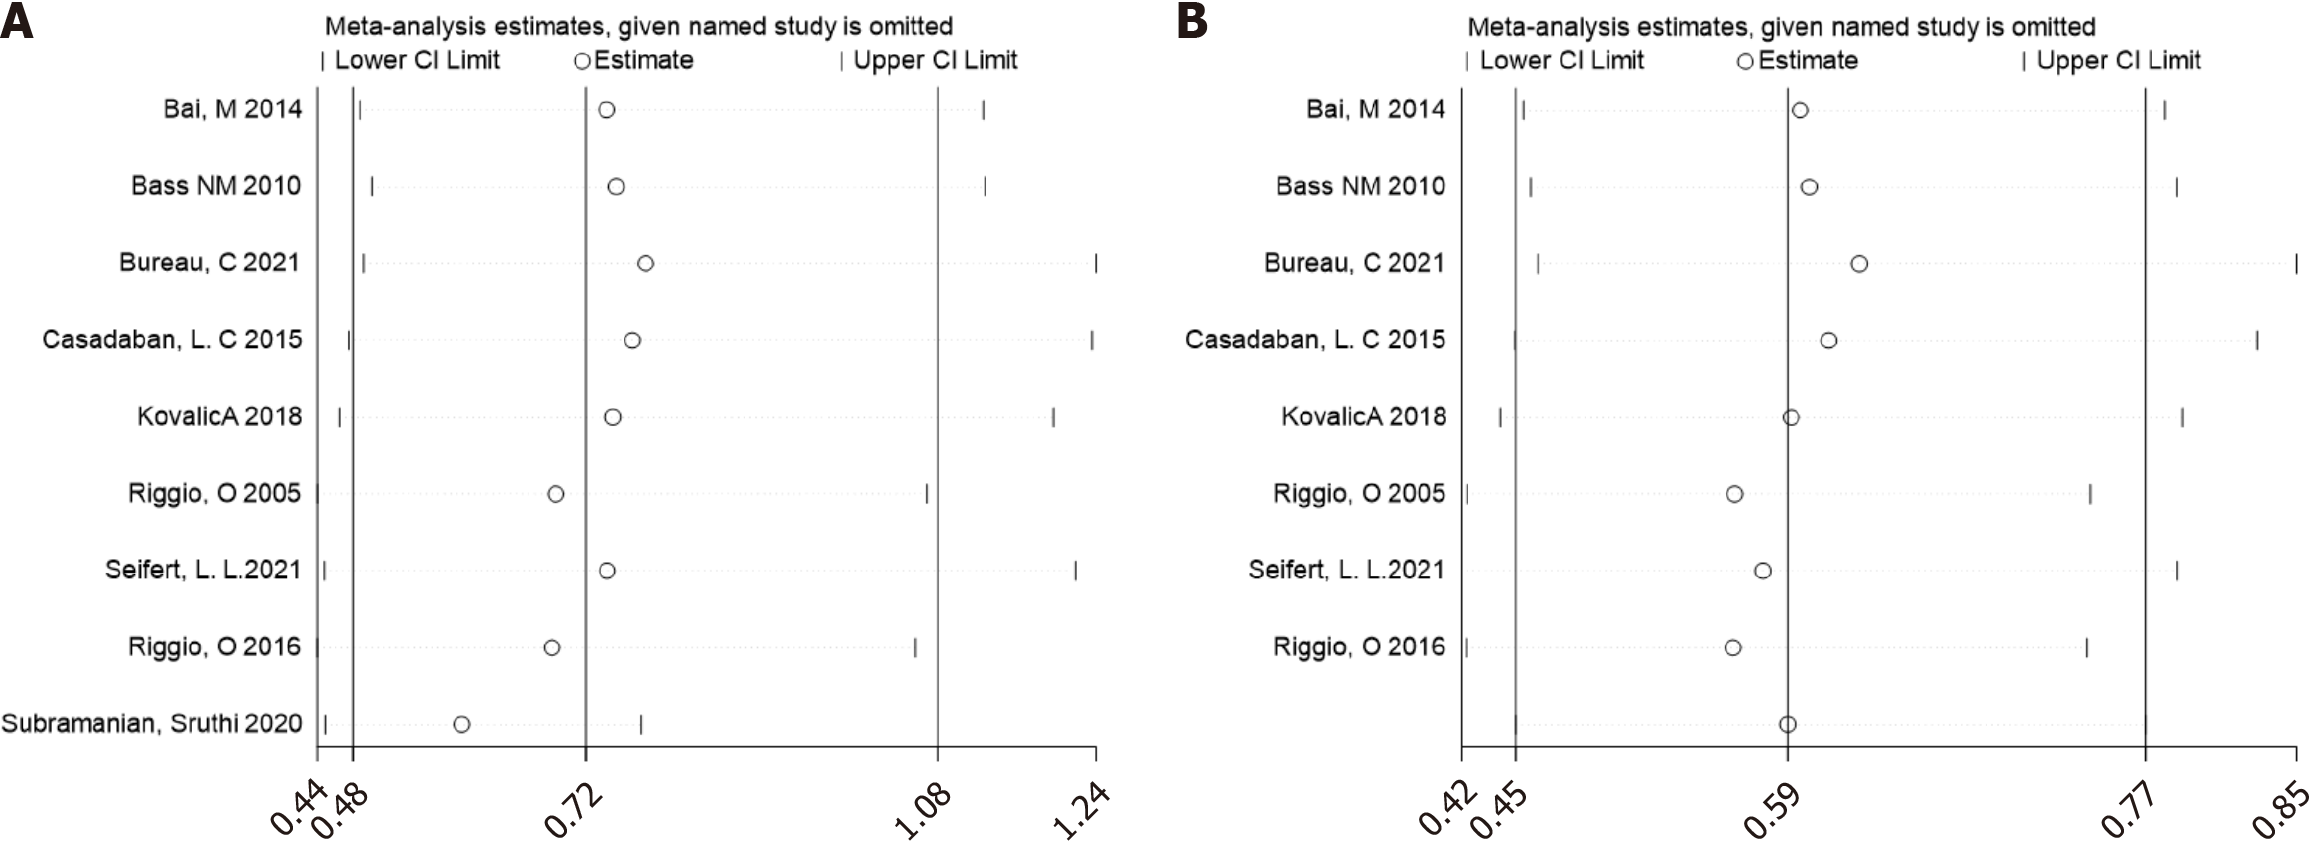
Figure 4 Sensitivity analysis of the efficacy of drug intervention in preventing hepatic encephalopathy after transjugular intrahepatic portosystemic shunt.
A: Sensitivity analysis of all included literature; B: Sensitivity analysis after removing heterogeneous source articles.
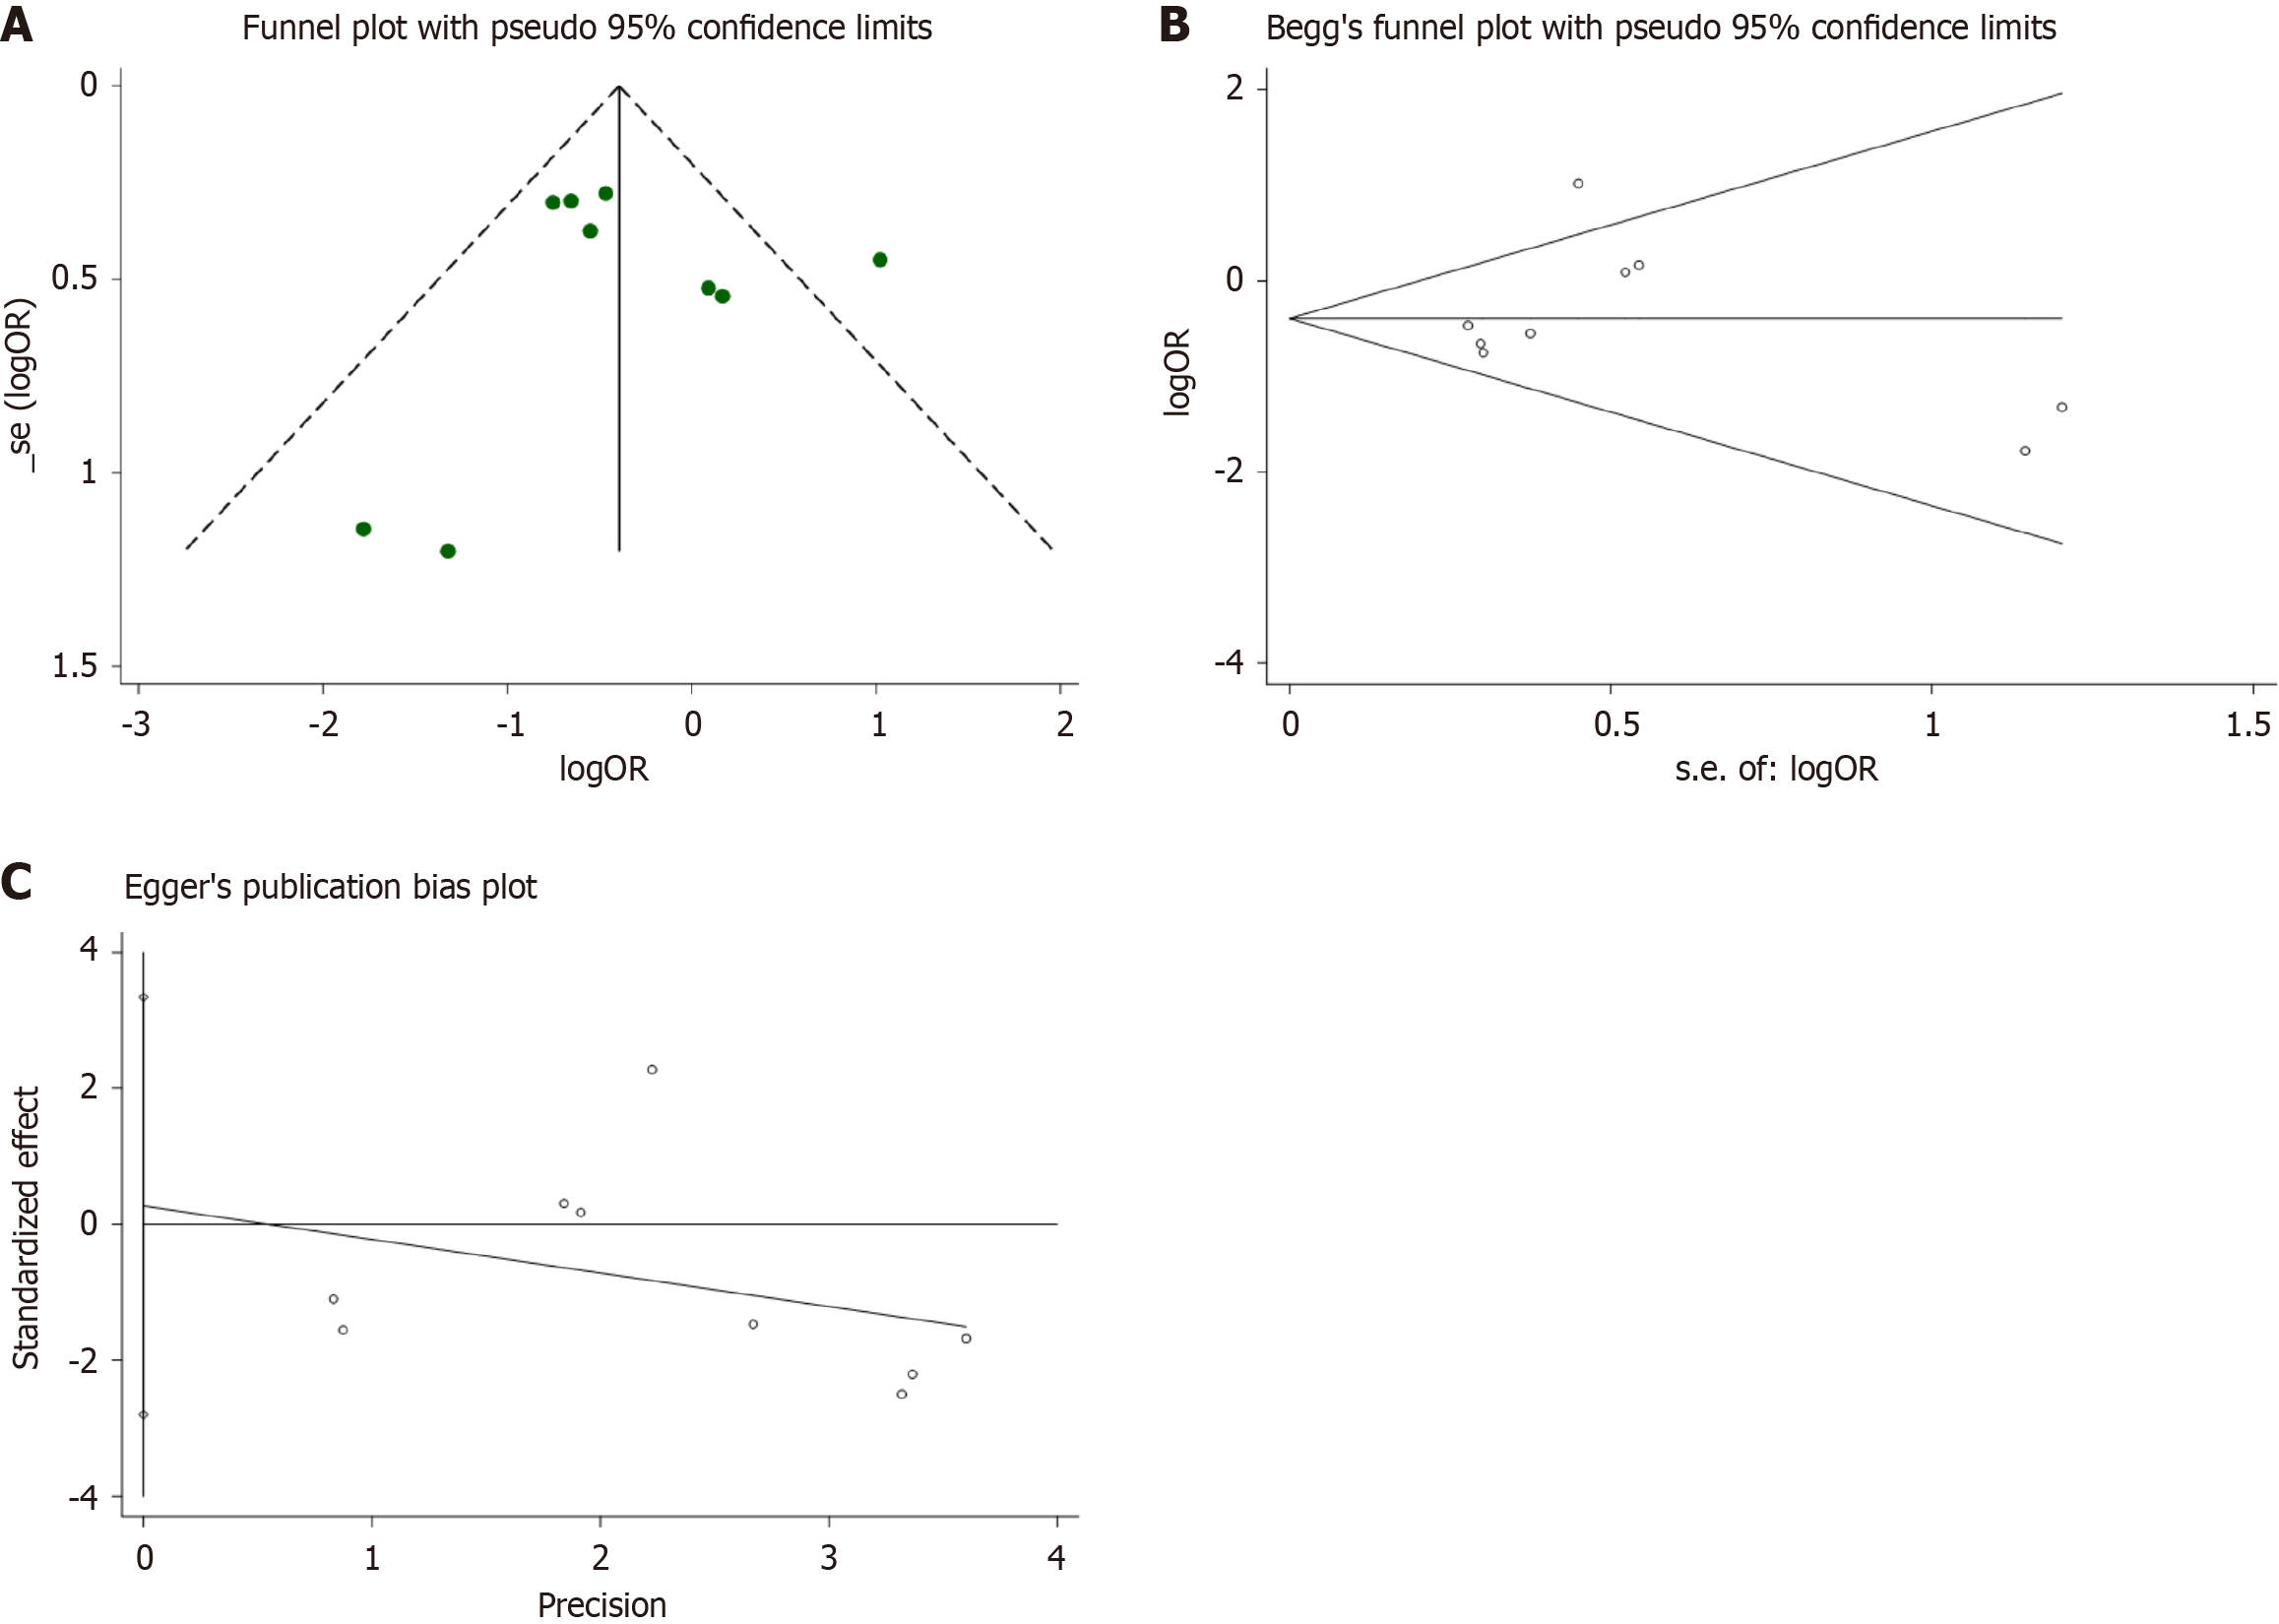
Figure 5 Publication bias of the efficacy of drug intervention in preventing hepatic encephalopathy after transjugular intrahepatic portosystemic shunt.
A: Funnel plot; B: Begg test; C: Egger test.
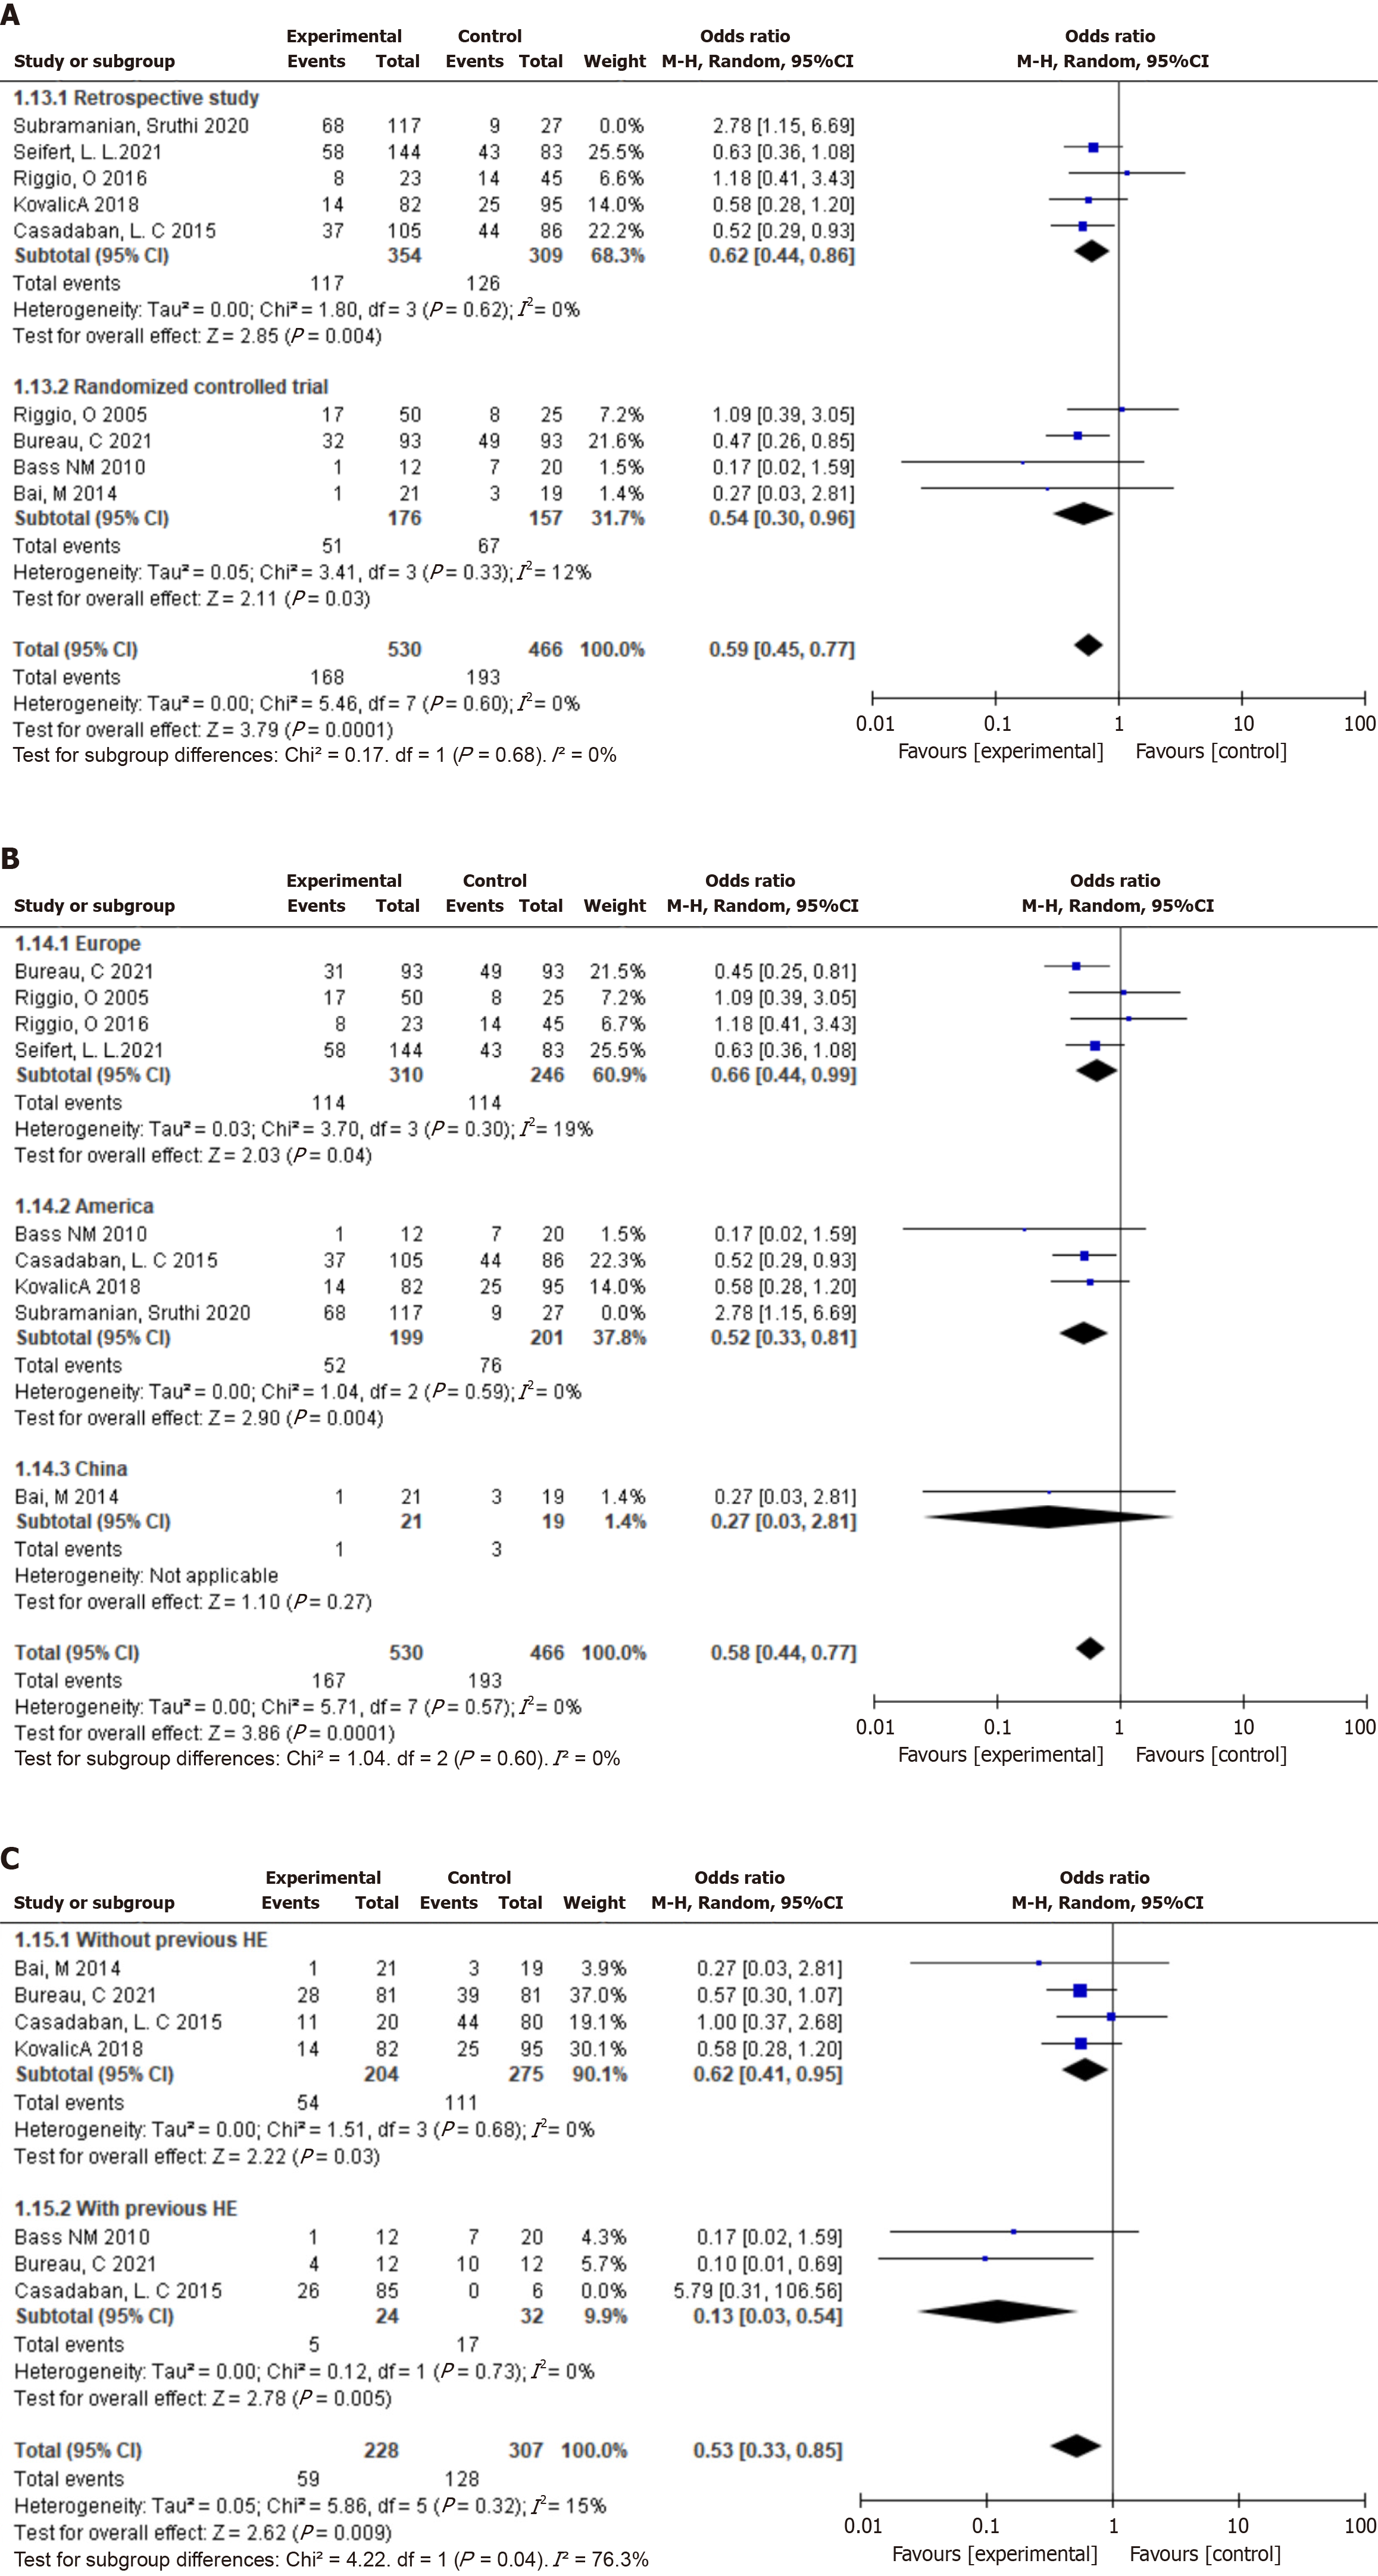
Figure 6 Subgroup analysis of the efficacy of drug intervention in preventing hepatic encephalopathy after transjugular intrahepatic portosystemic shunt.
A: Different study types; B: Different regions; C: The presence of hepatic encephalopathy.
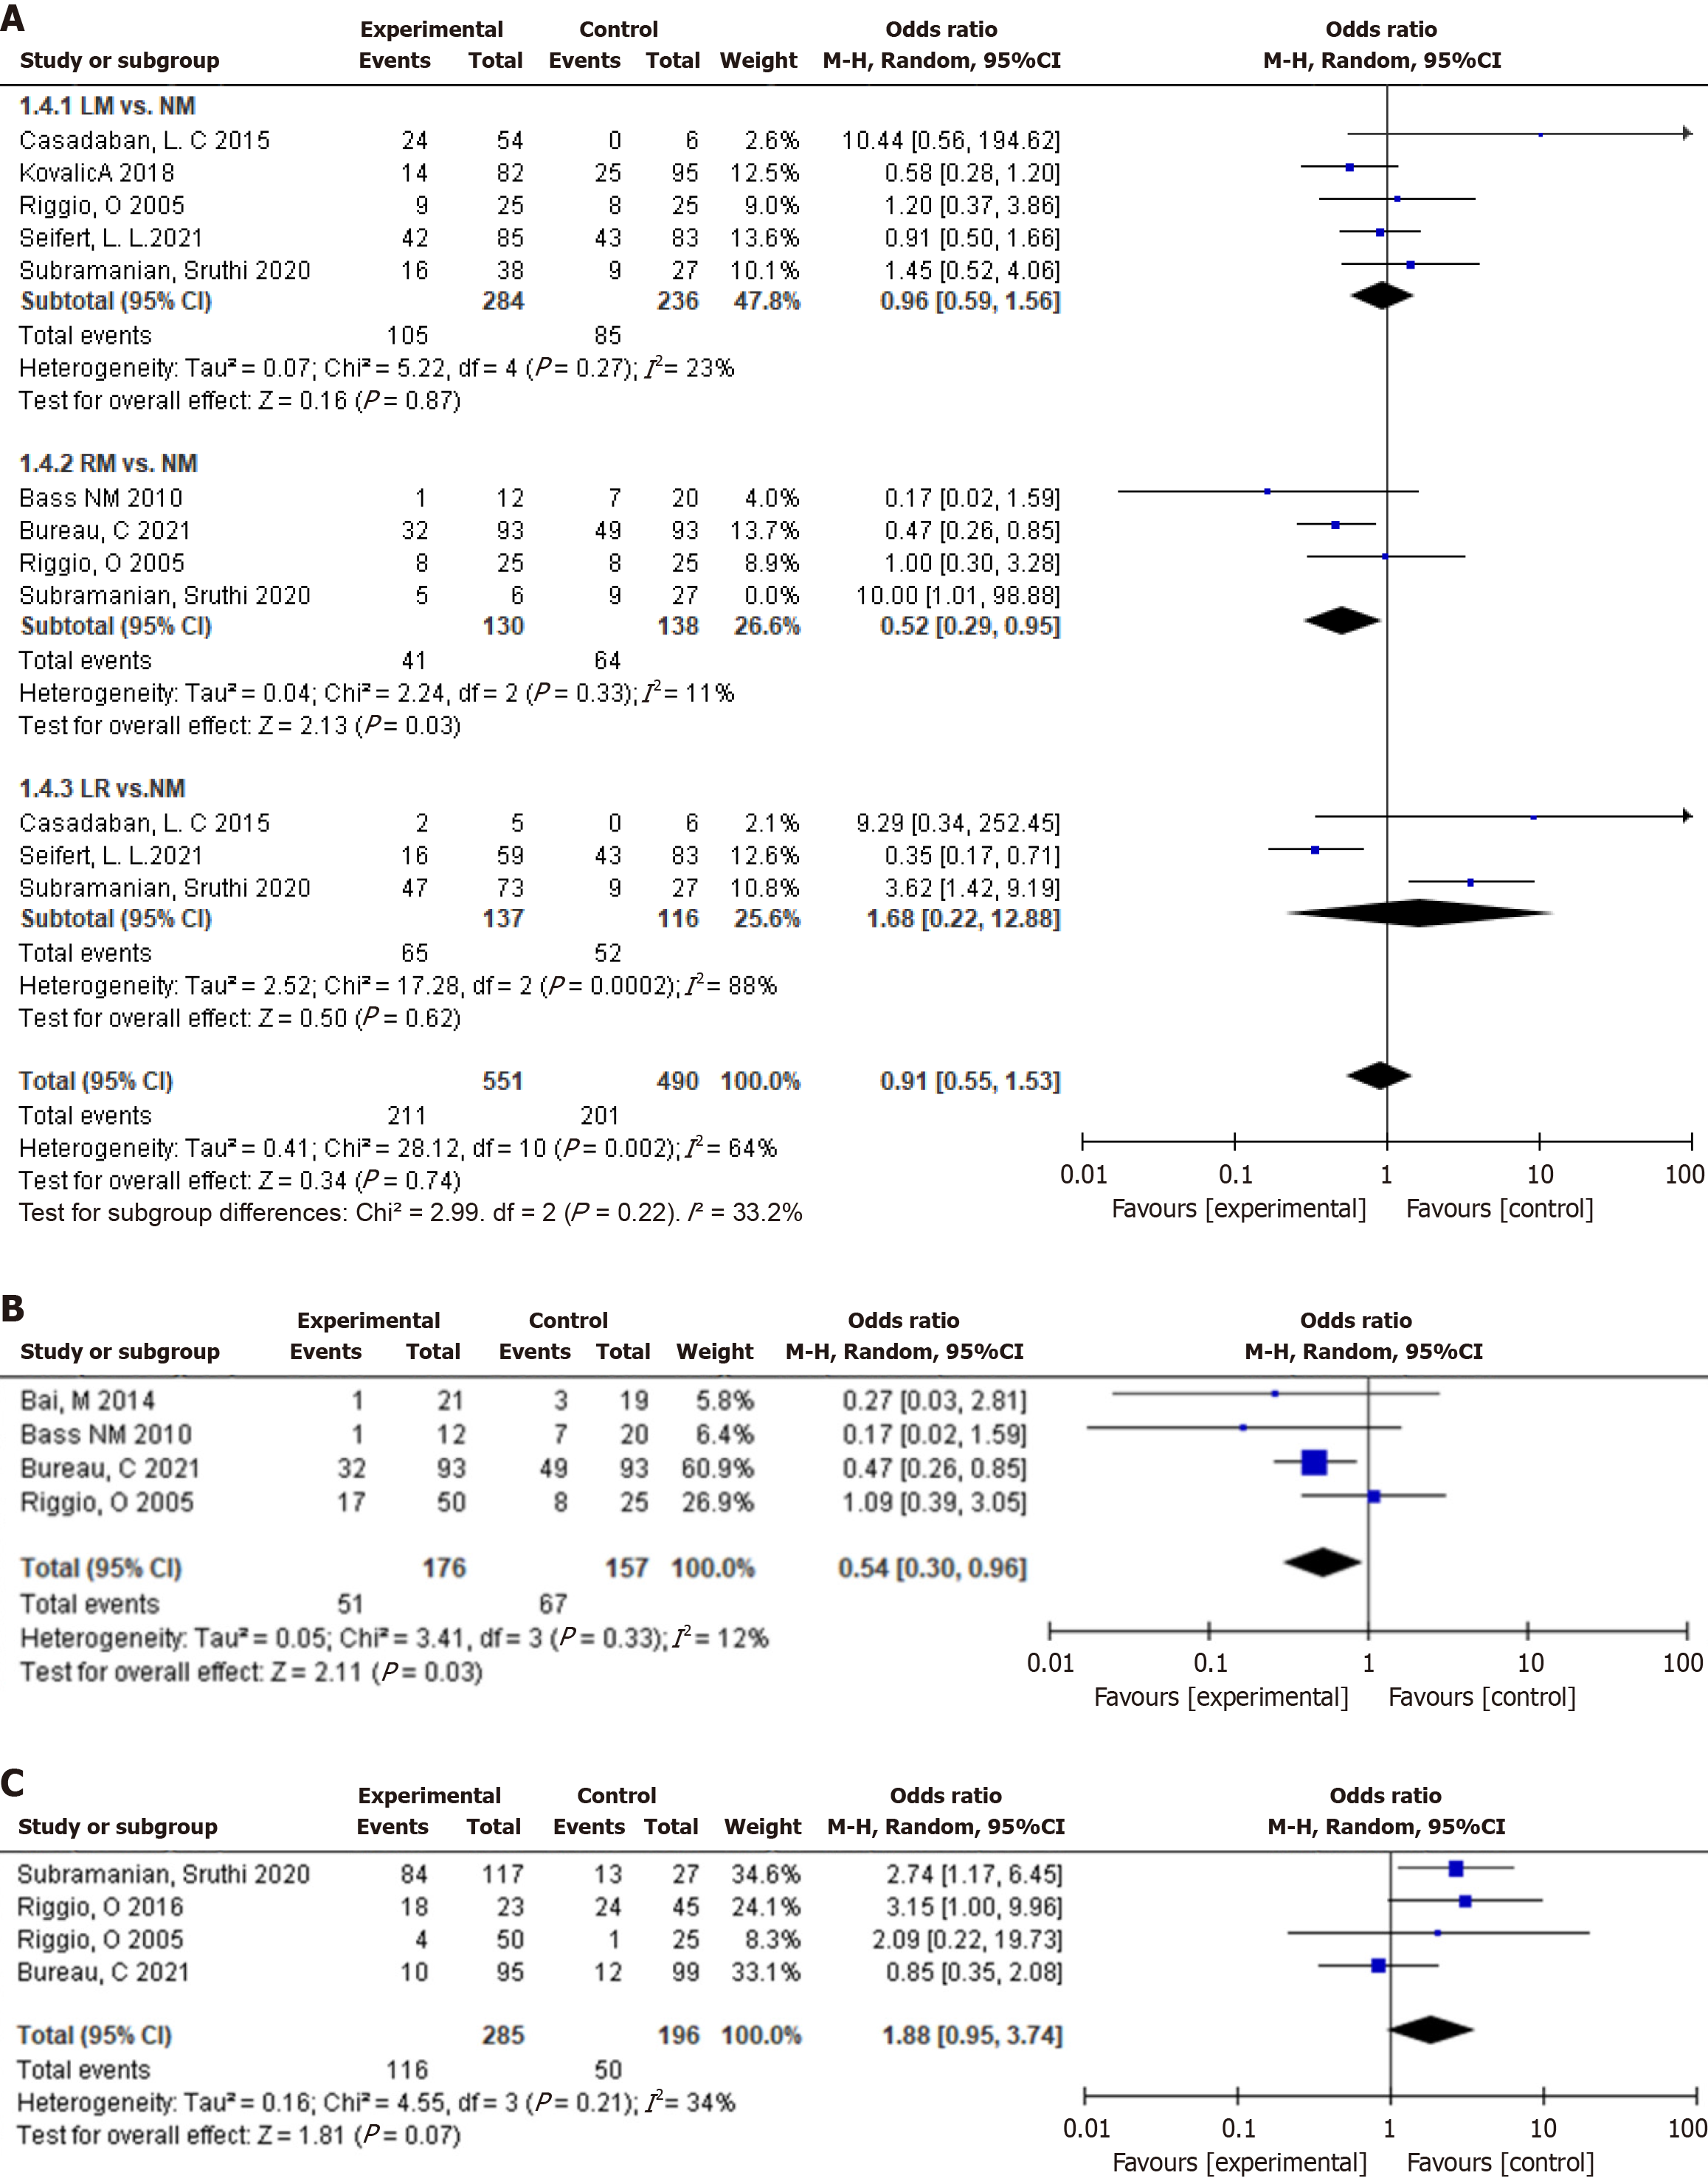
Figure 7 The effectiveness and survival of drug intervention on hepatic encephalopathy after transjugular intrahepatic portosystemic shunt.
A: The therapeutic effects of different drug interventions for preventing hepatic encephalopathy (HE) after transjugular intrahepatic portosystemic shunt; B: Drug prevention intervention for the treatment of overt HE; C: The impact of drug prevention interventions on survival. LM: Lactulose monoprophylaxis; RM: Rifaximin monoprophylaxis; LR: Lactulose and rifaximin; NM: No prophylactic medication.
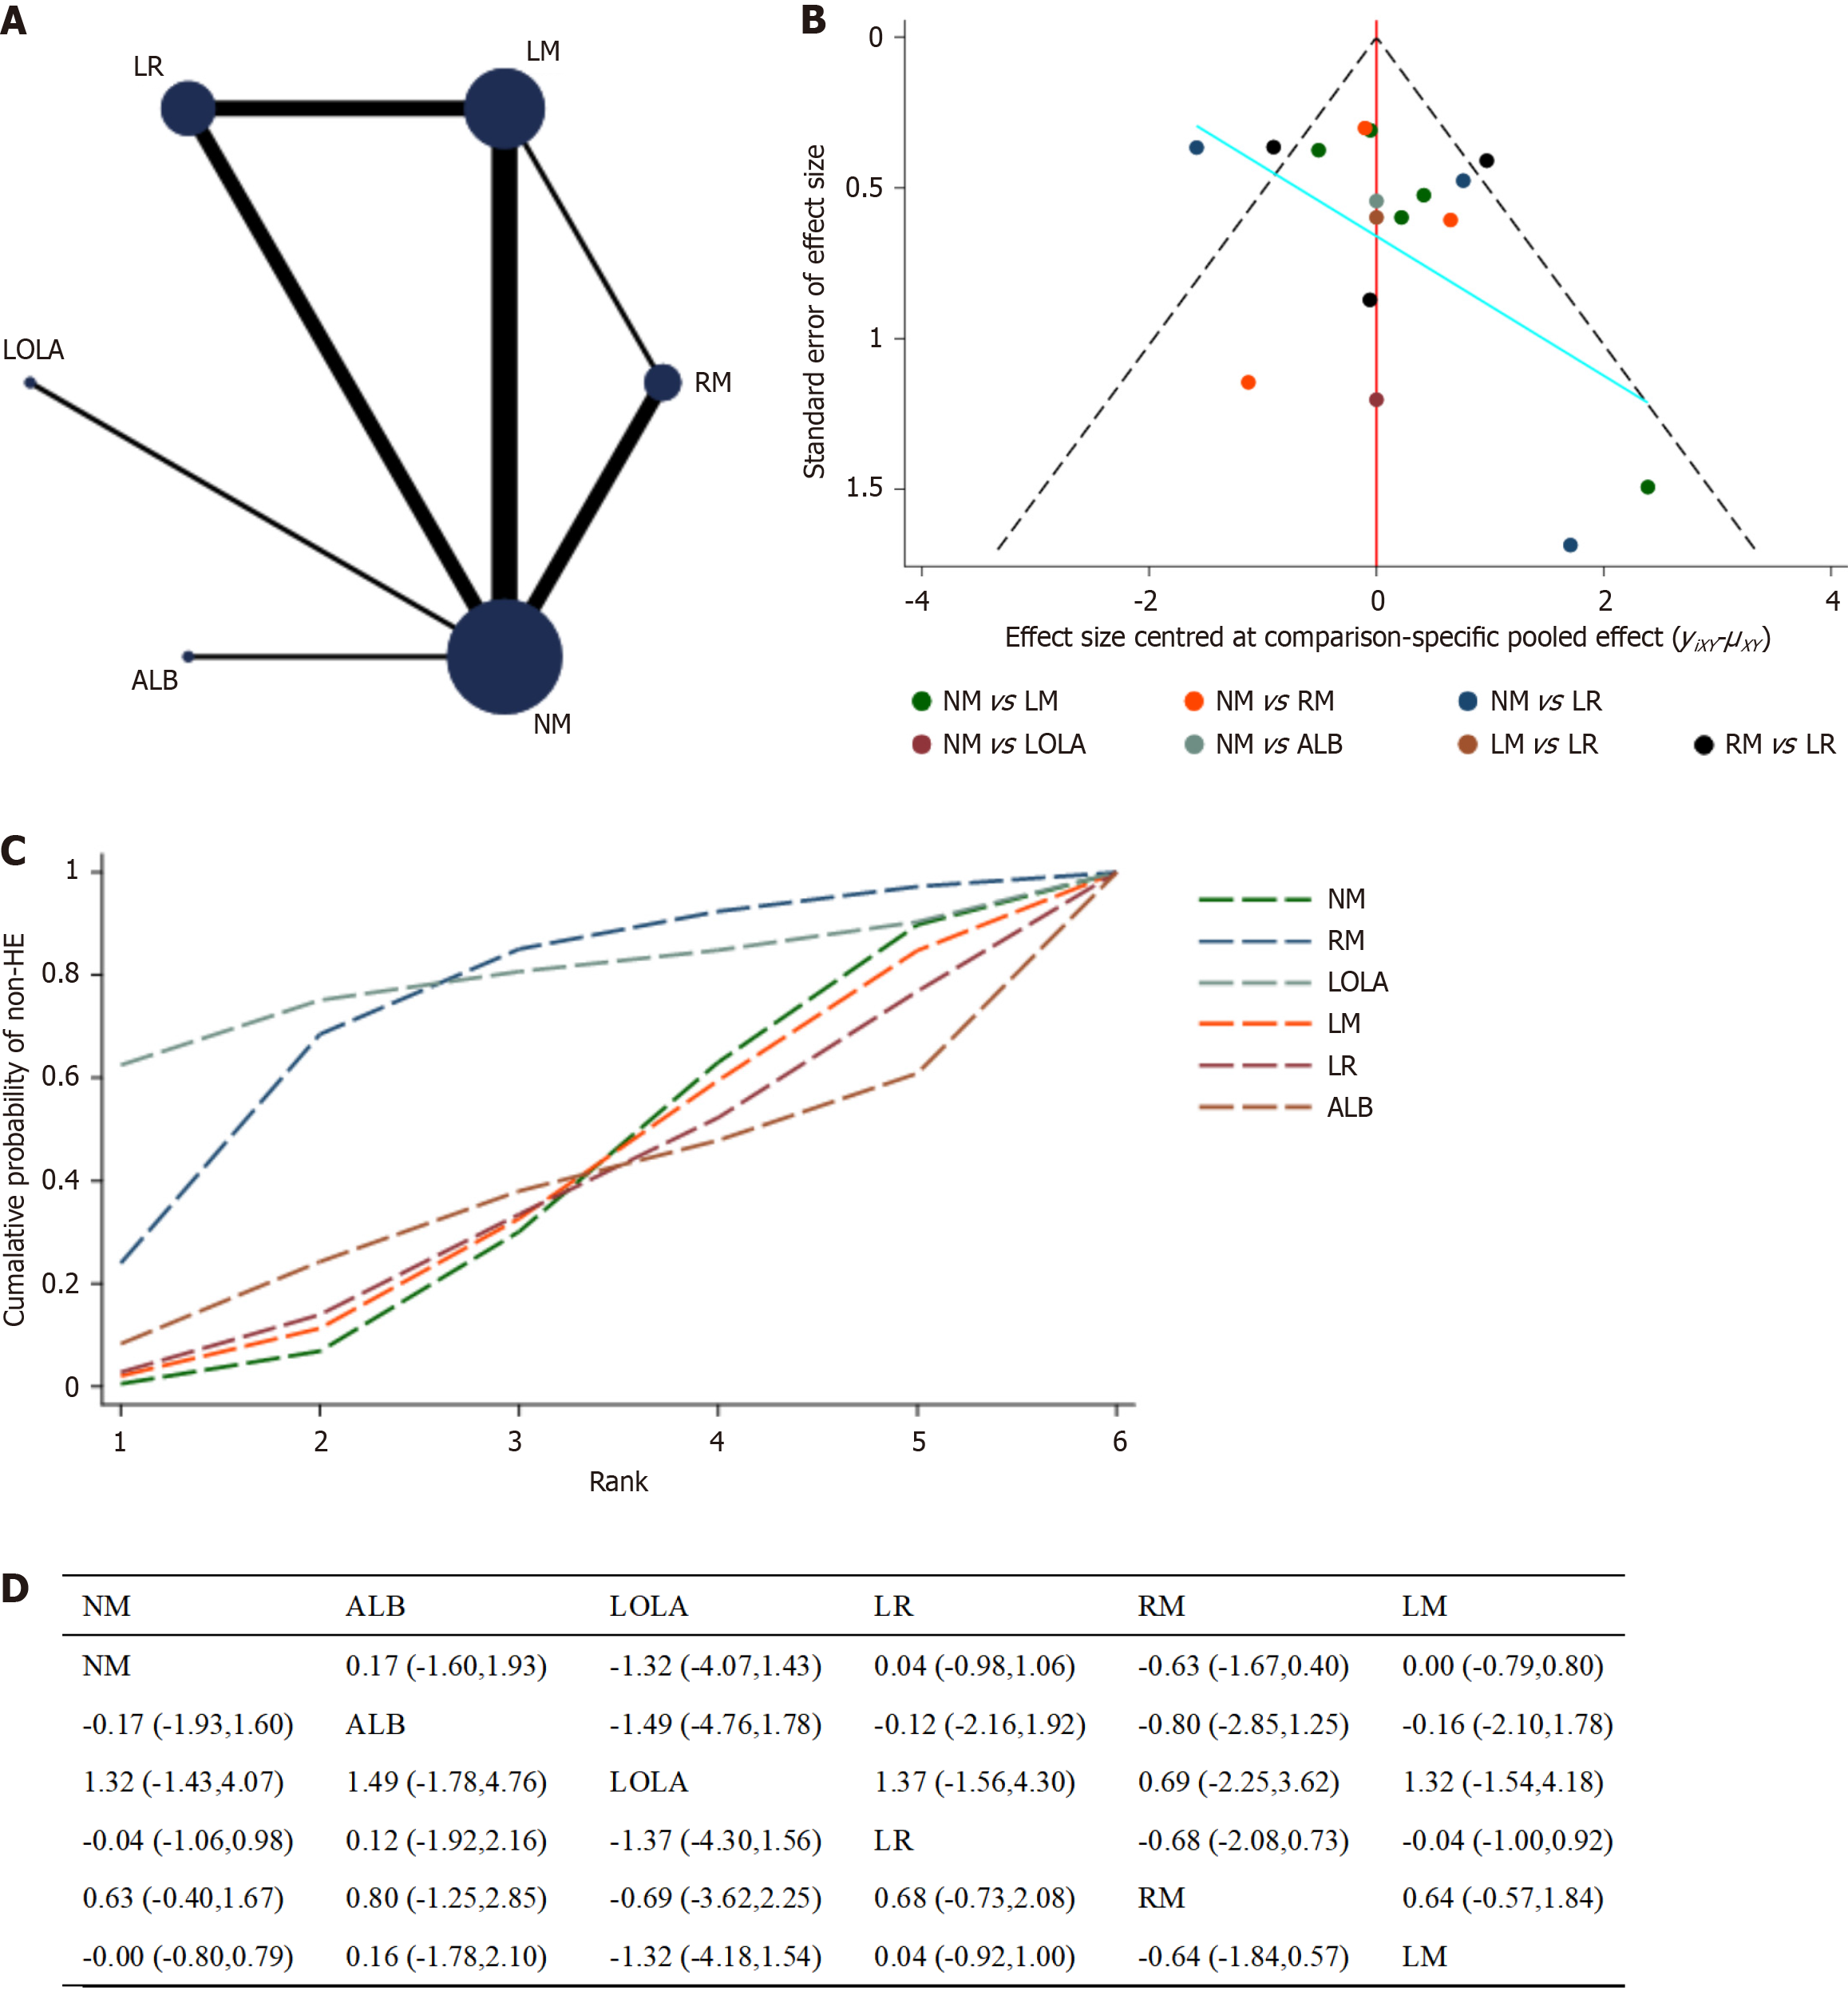
Figure 8 Network meta-analysis.
A: Network diagram; B: Funnel plot; C: Sucra cumulative probability plot. LM: Lactulose monoprophylaxis; RM: Rifaximin monoprophylaxis; LR: Lactulose and rifaximin; NM: No prophylactic medication; LOLA: L-ornithin-l-aspartate; ALB: Albumin. D: League chart. NM: No prophylactic medication; ALB: Albumin; LOLA: L-ornithin-l-aspartate; LR: Lactulose and rifaximin; RM: Rifaximin monoprophylaxis; LM: Lactulose monoprophylaxis.
- Citation: Xu XT, Jiang MJ, Fu YL, Xie F, Li JJ, Meng QH. Incidence and efficacy of strategies for preventing hepatic encephalopathy following transjugular intrahepatic portosystemic shunt: A meta-analysis. World J Hepatol 2025; 17(4): 104890
- URL: https://www.wjgnet.com/1948-5182/full/v17/i4/104890.htm
- DOI: https://dx.doi.org/10.4254/wjh.v17.i4.104890


