Copyright
©The Author(s) 2025.
World J Hepatol. Mar 27, 2025; 17(3): 103261
Published online Mar 27, 2025. doi: 10.4254/wjh.v17.i3.103261
Published online Mar 27, 2025. doi: 10.4254/wjh.v17.i3.103261
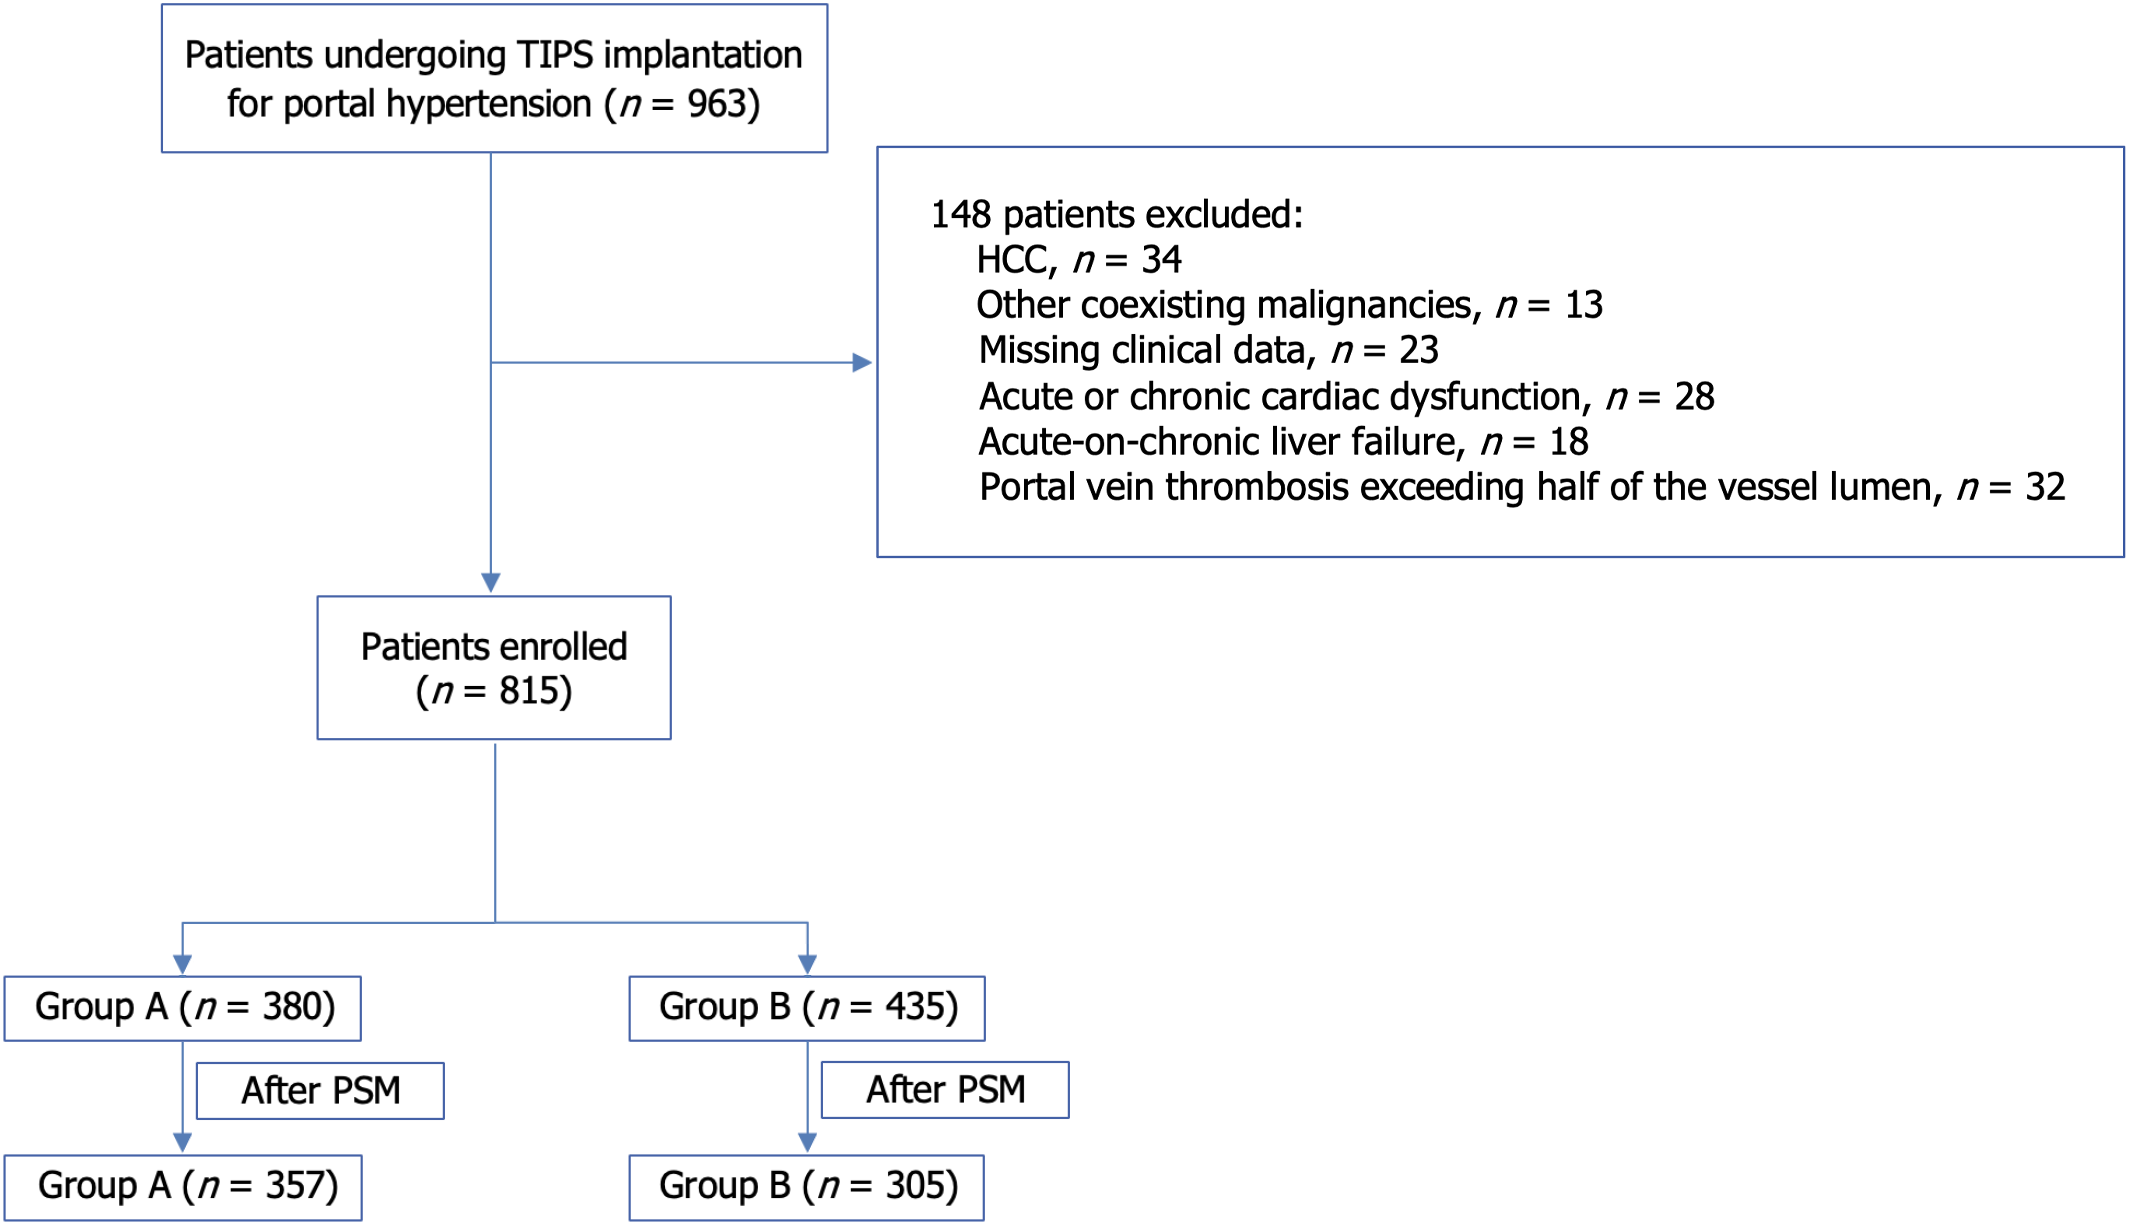
Figure 1 Study flowchart.
The flowchart illustrating the screening and grouping of 963 transjugular intrahepatic portosystemic shunt-treated portal hypertension patients. A total of 148 patients were excluded whereas 815 were included. Patients were divided based on portal pressure gradient reduction into group A and group B, with 357 and 305 patients, respectively, after propensity score matching. TIPS: Transjugular intrahepatic portosystemic shunt; HCC: Hepatocellular carcinoma; PSM: Propensity score matching.
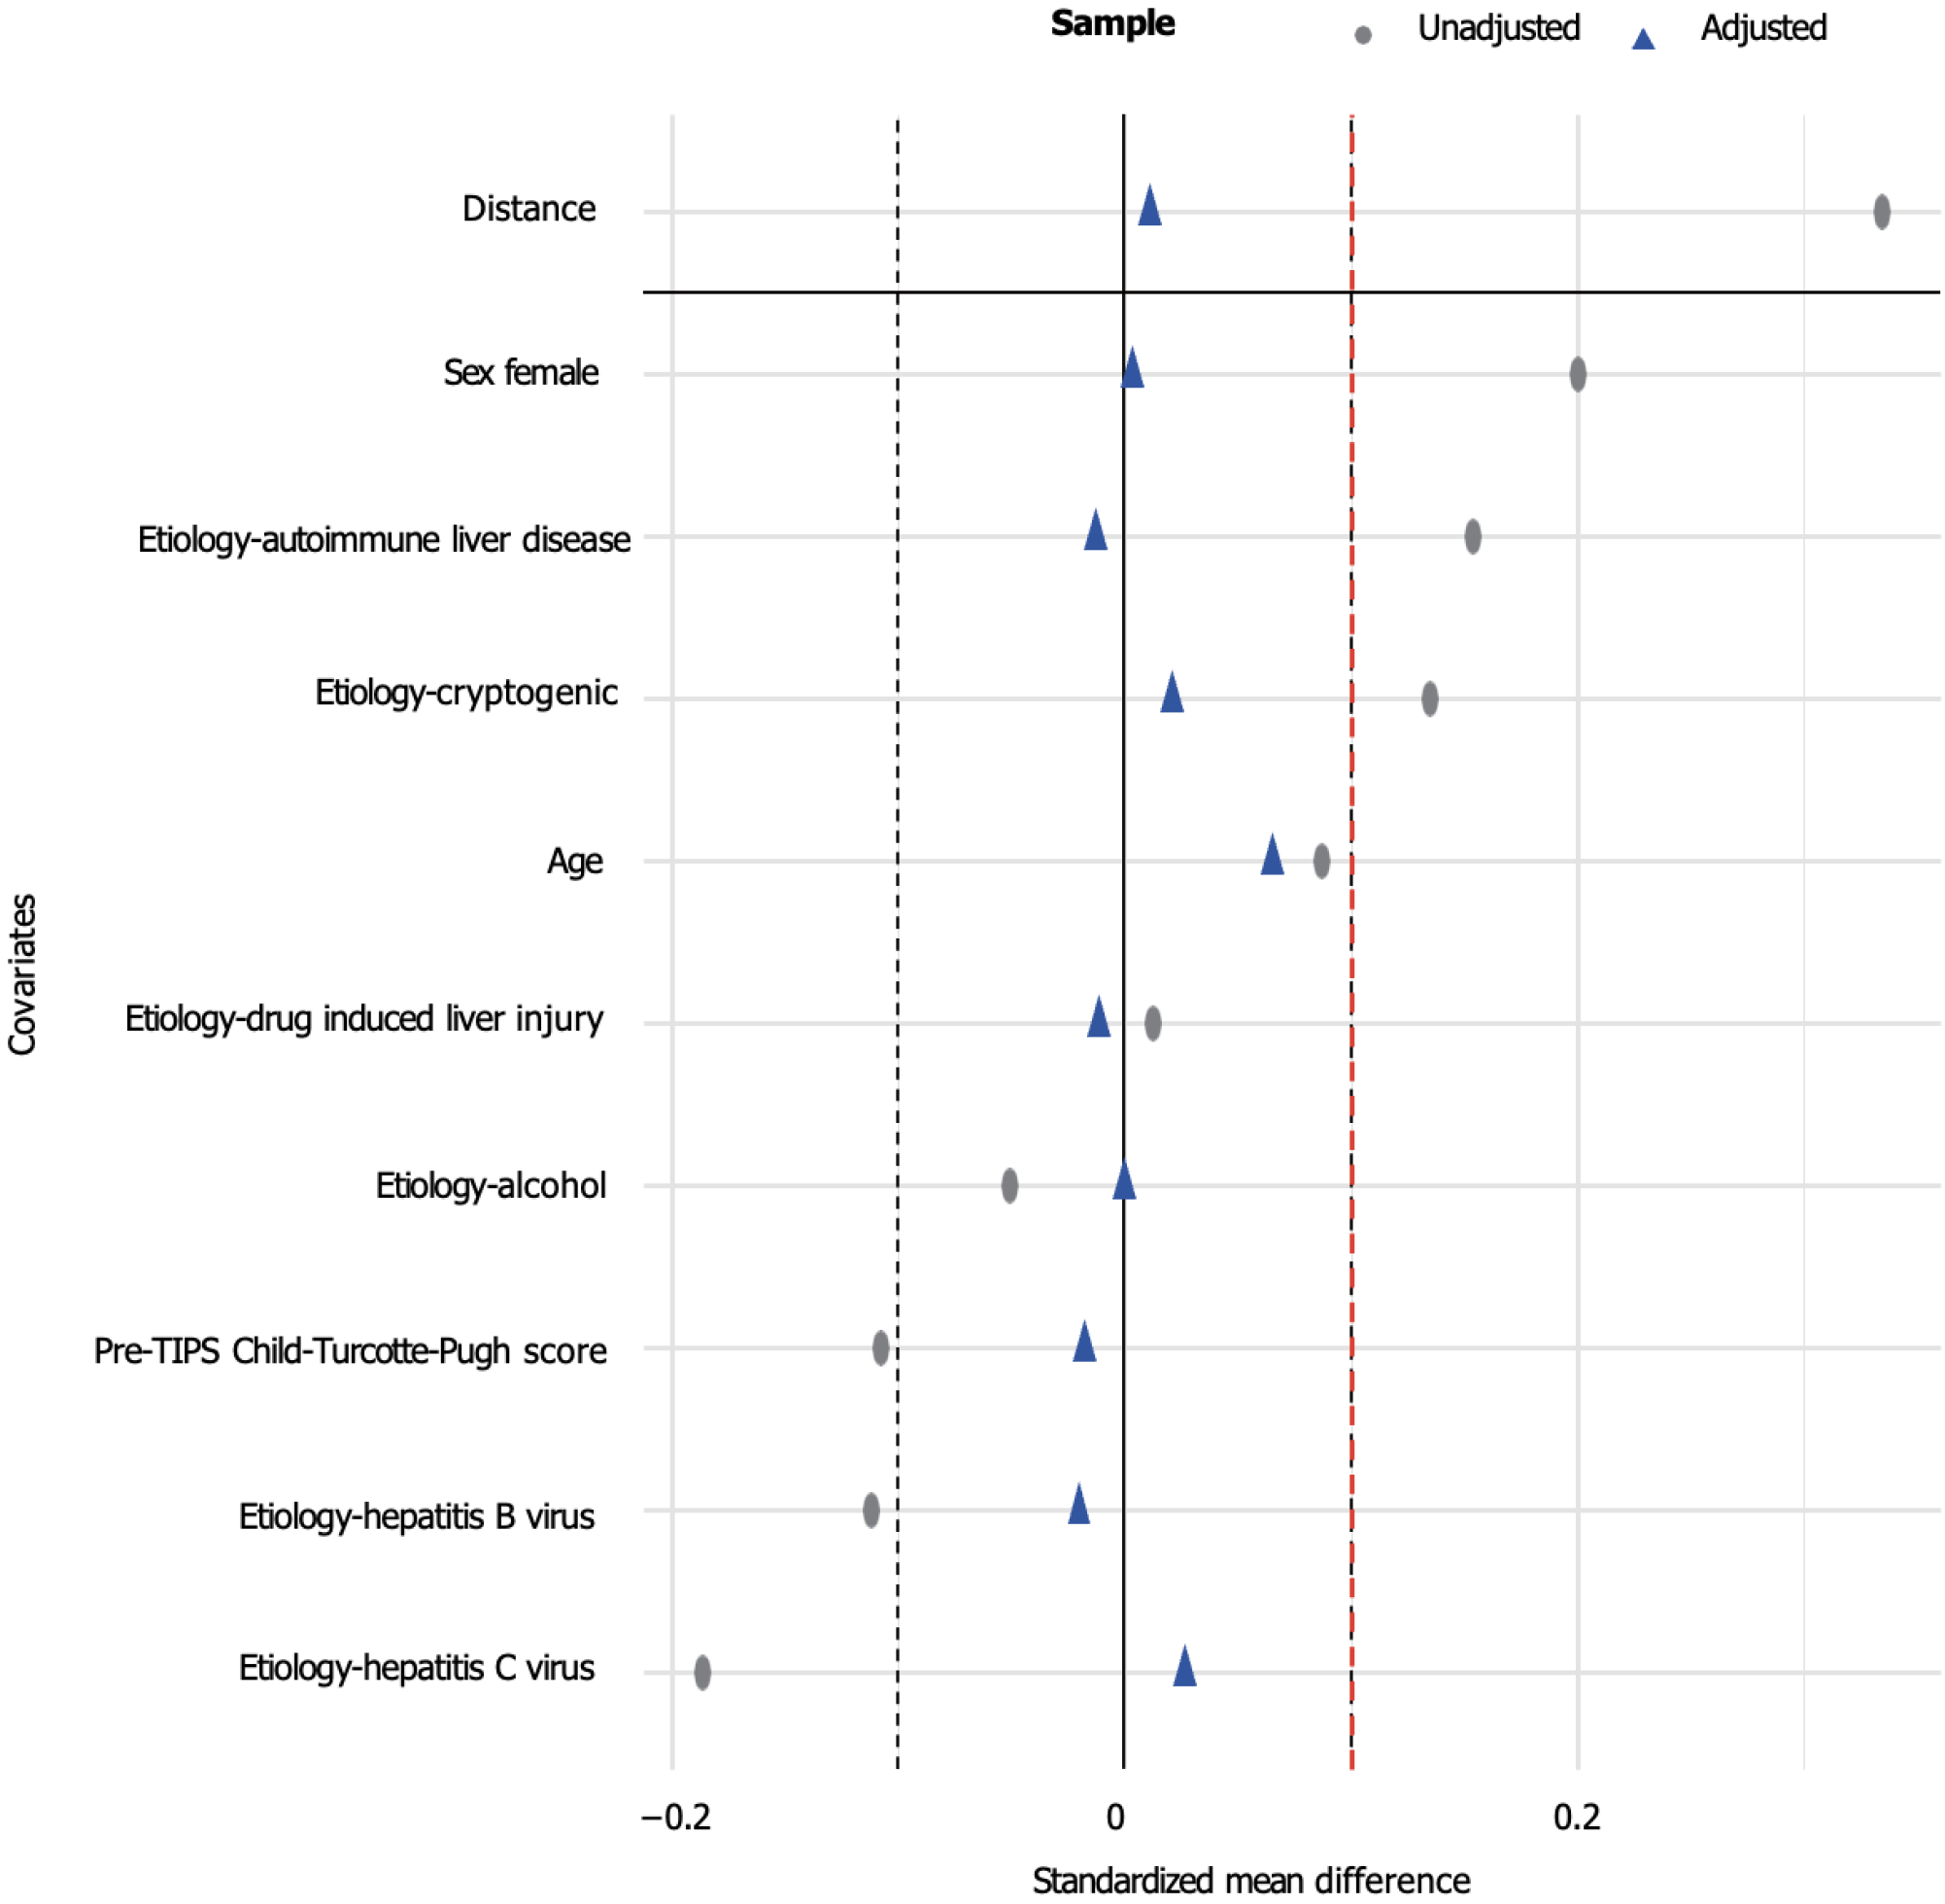
Figure 2 Comparison of standardized mean differences pre- and post-propensity score matching.
Gray circles indicate standardized mean differences before matching, and blue triangles represent standardized mean differences after matching.
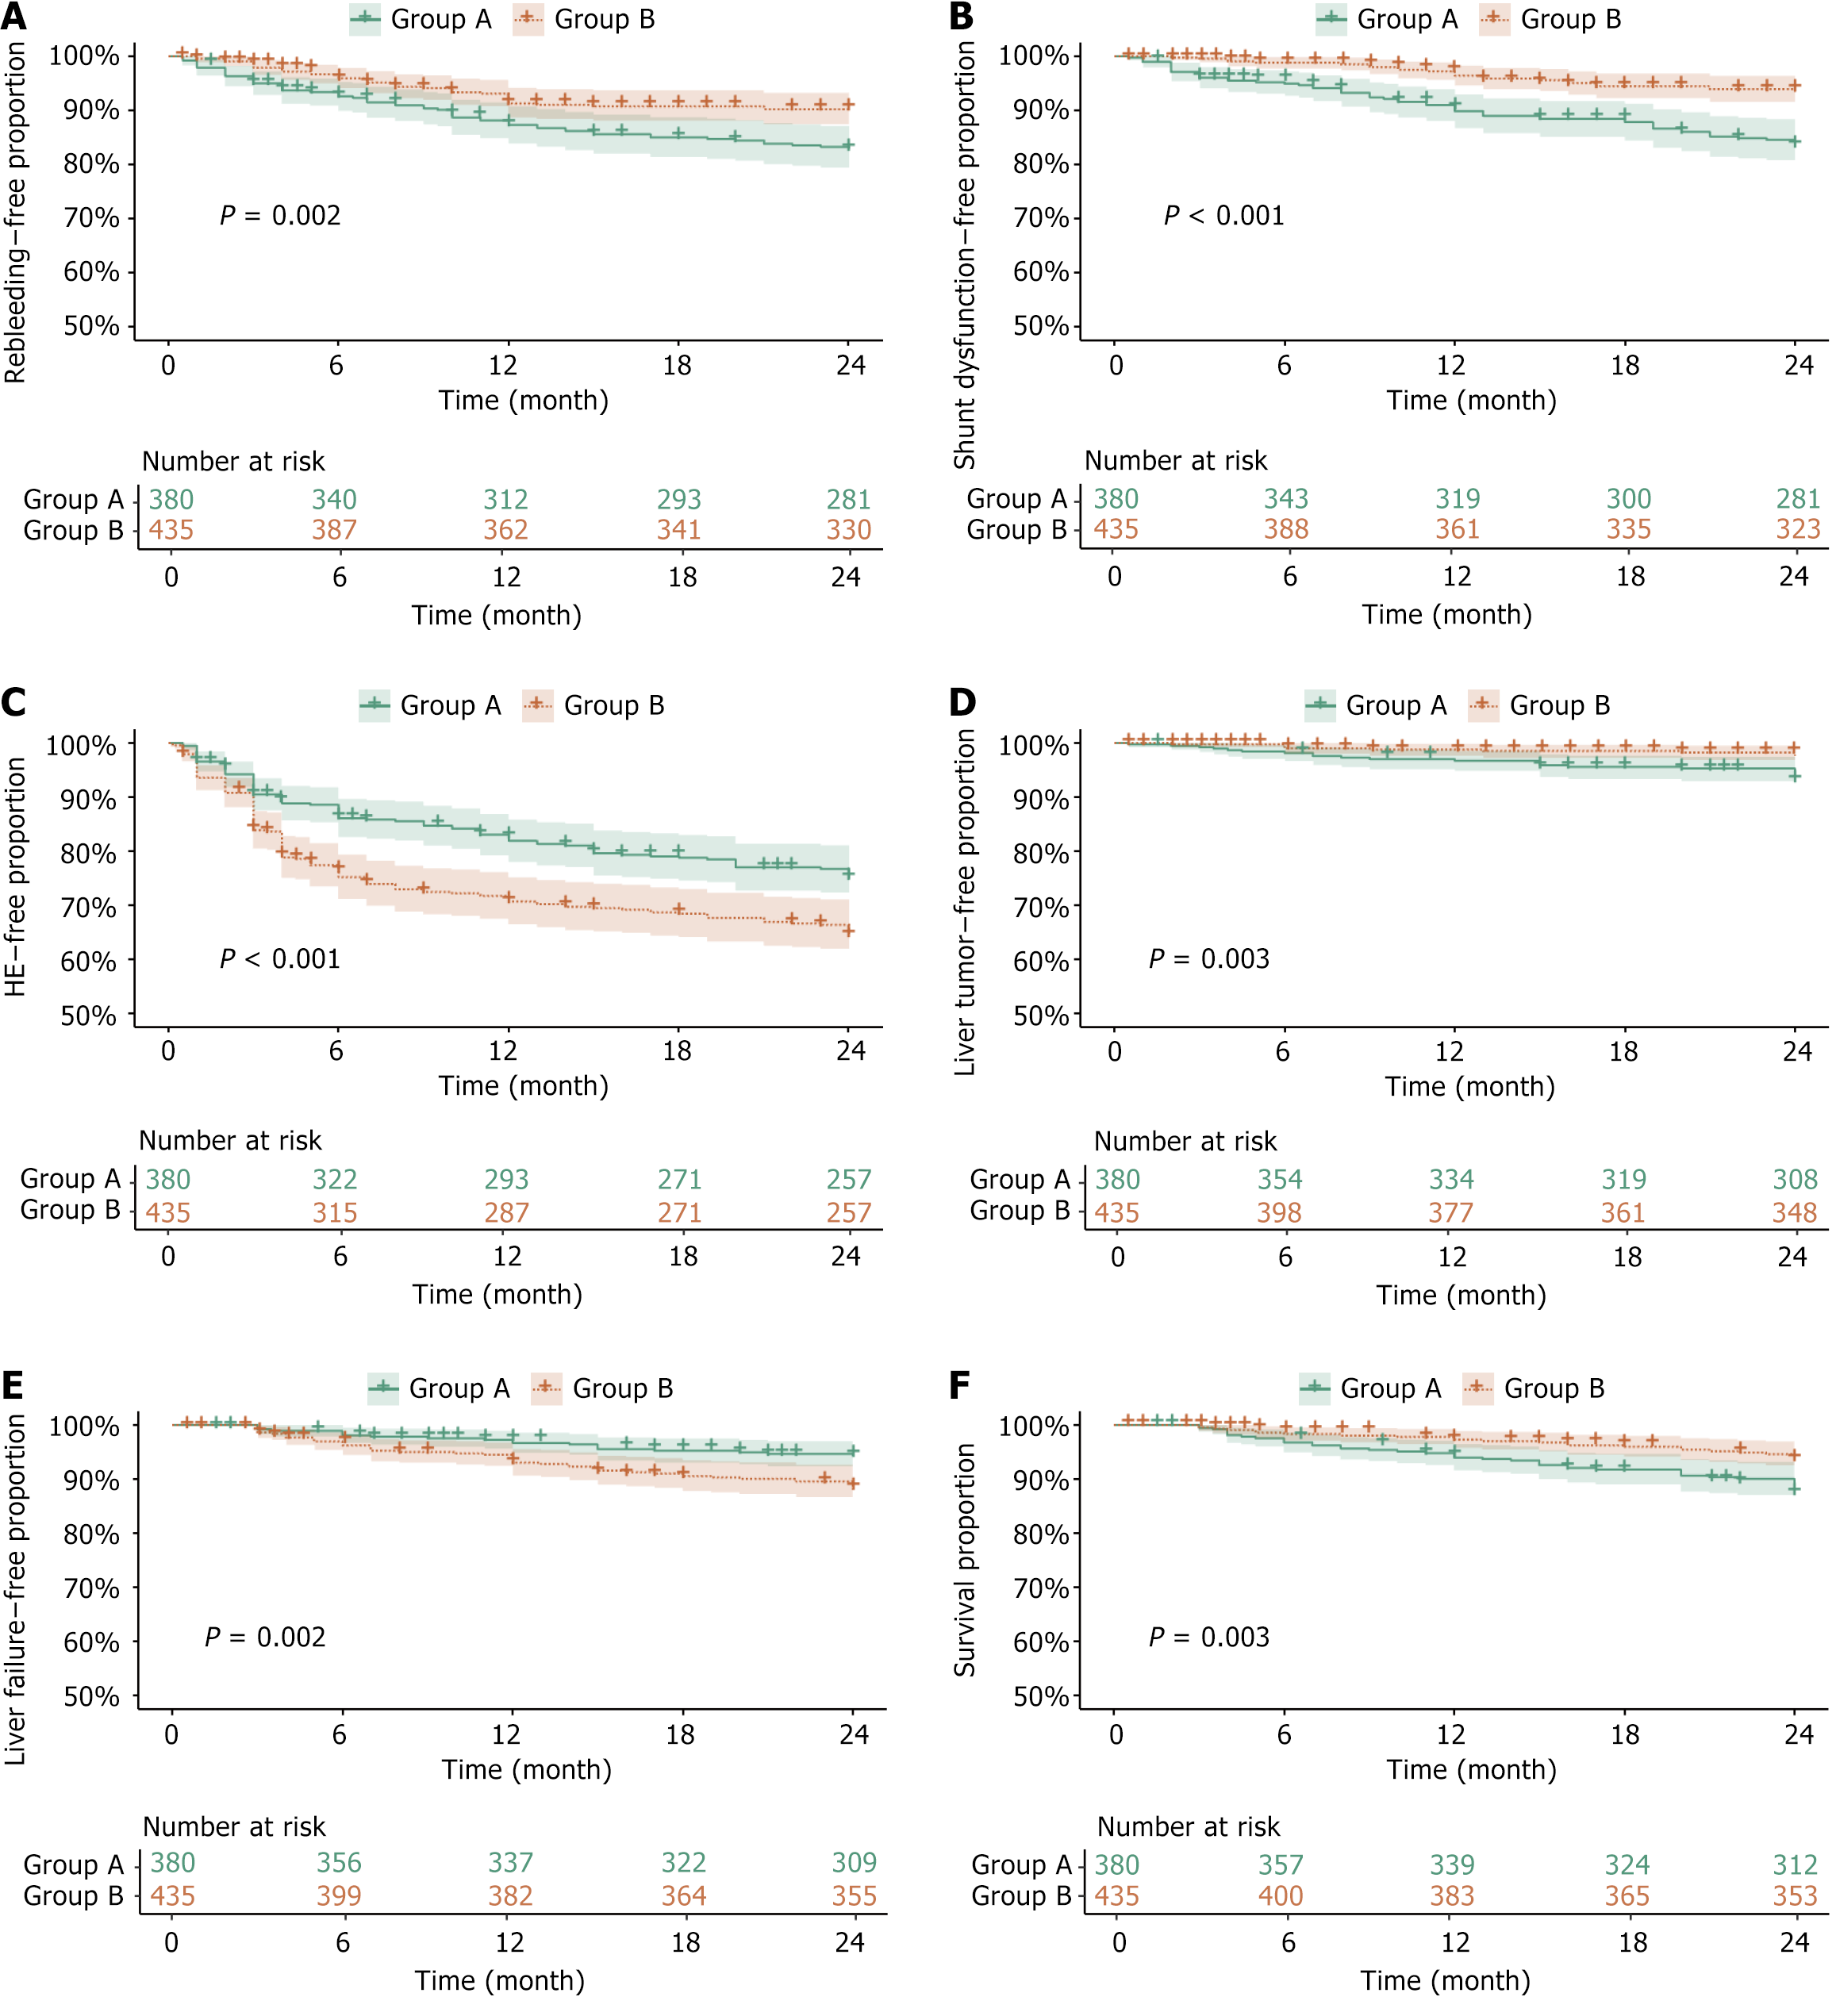
Figure 3 Kaplan-Meier survival for six outcomes between group A (portal pressure gradient reduction ≤ 50%) and group B (portal pressure gradient reduction > 50%) before propensity score matching.
A: Rebleeding-free survival (P = 0.002); B: Shunt dysfunction-free survival (P < 0.001); C: Hepatic encephalopathy-free survival (P < 0.001); D: Hepatocellular carcinoma-free survival (P = 0.003); E: Liver failure-free survival (P = 0.002); F: Overall survival (P = 0.003). HE: Hepatic encephalopathy.
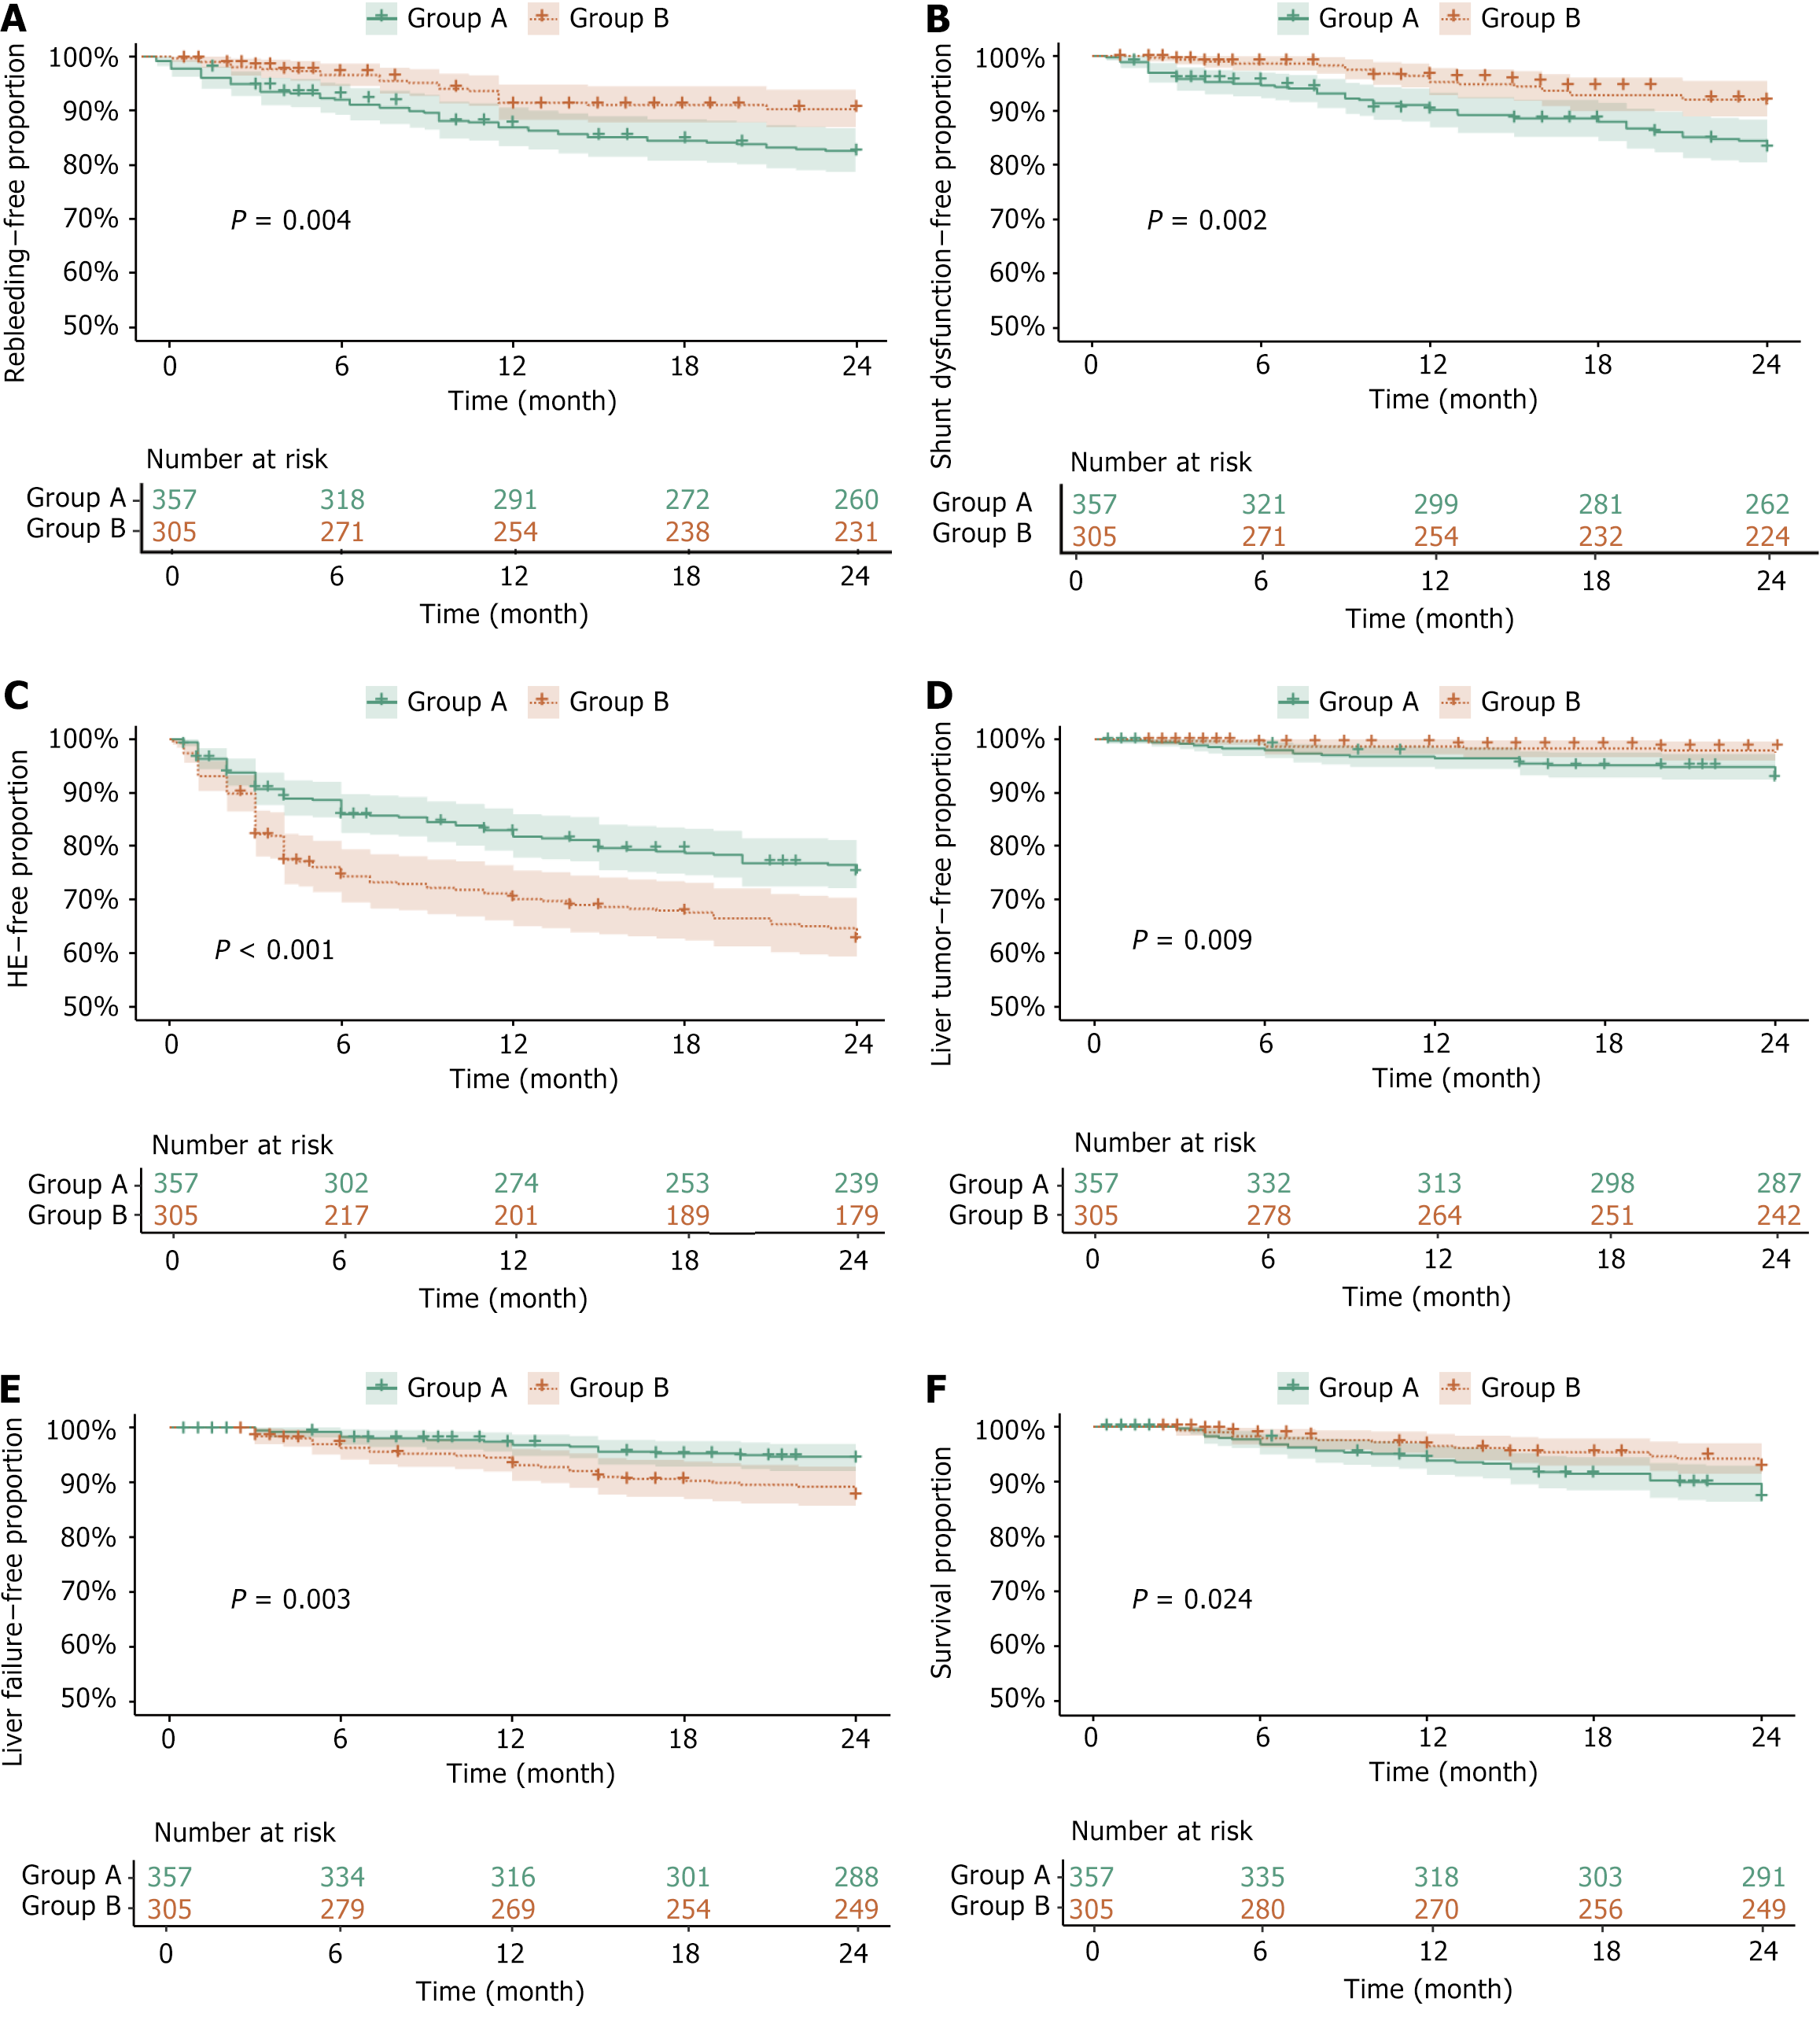
Figure 4 Kaplan-Meier survival analysis for six outcomes between group A (portal pressure gradient reduction ≤ 50%) and group B (portal pressure gradient reduction > 50%) after propensity score matching.
A: Rebleeding-free survival (P = 0.004); B: Shunt dysfunction-free survival (P = 0.002); C: Hepatic encephalopathy-free survival (P < 0.001); D: Hepatocellular carcinoma-free survival (P = 0.009); E: Liver failure-free survival (P = 0.003); F: Overall survival (P = 0.024). HE: Hepatic encephalopathy.
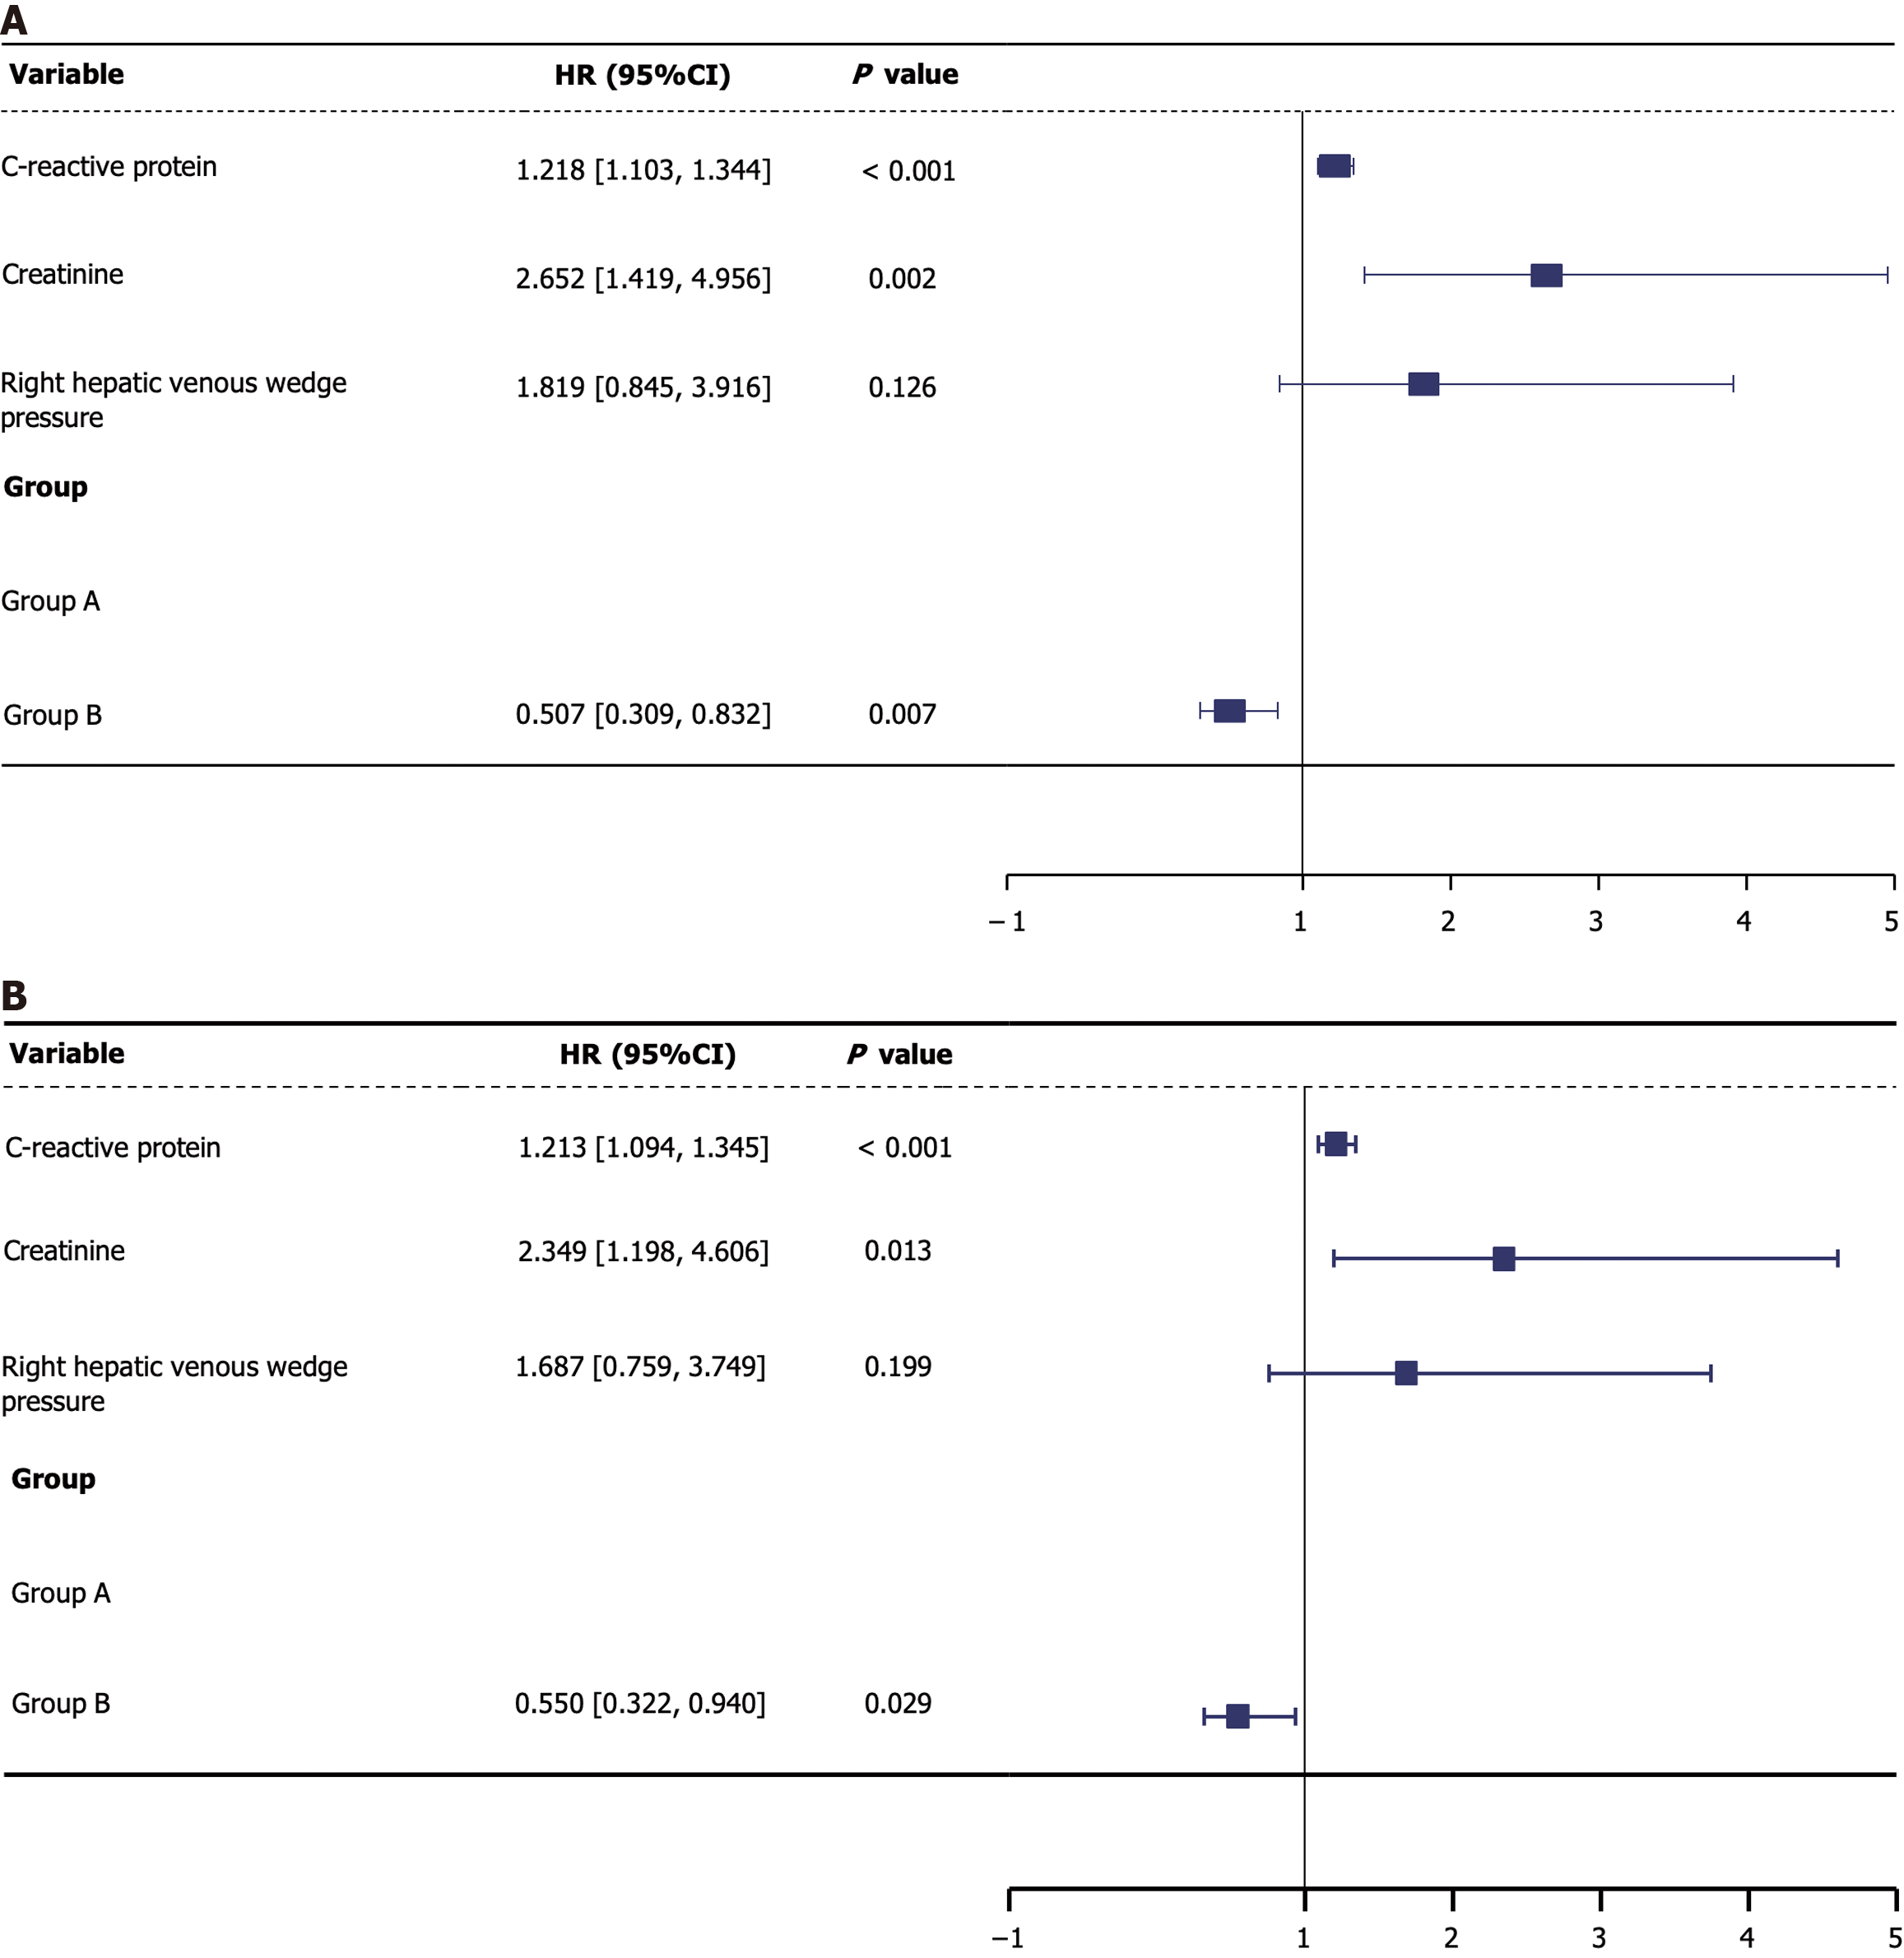
Figure 5 Forest plots for the multivariate Cox regression analyses for mortality.
A: Before propensity score matching; B: After propensity score matching. HR: Hazard ratio; CI: Confidence interval.
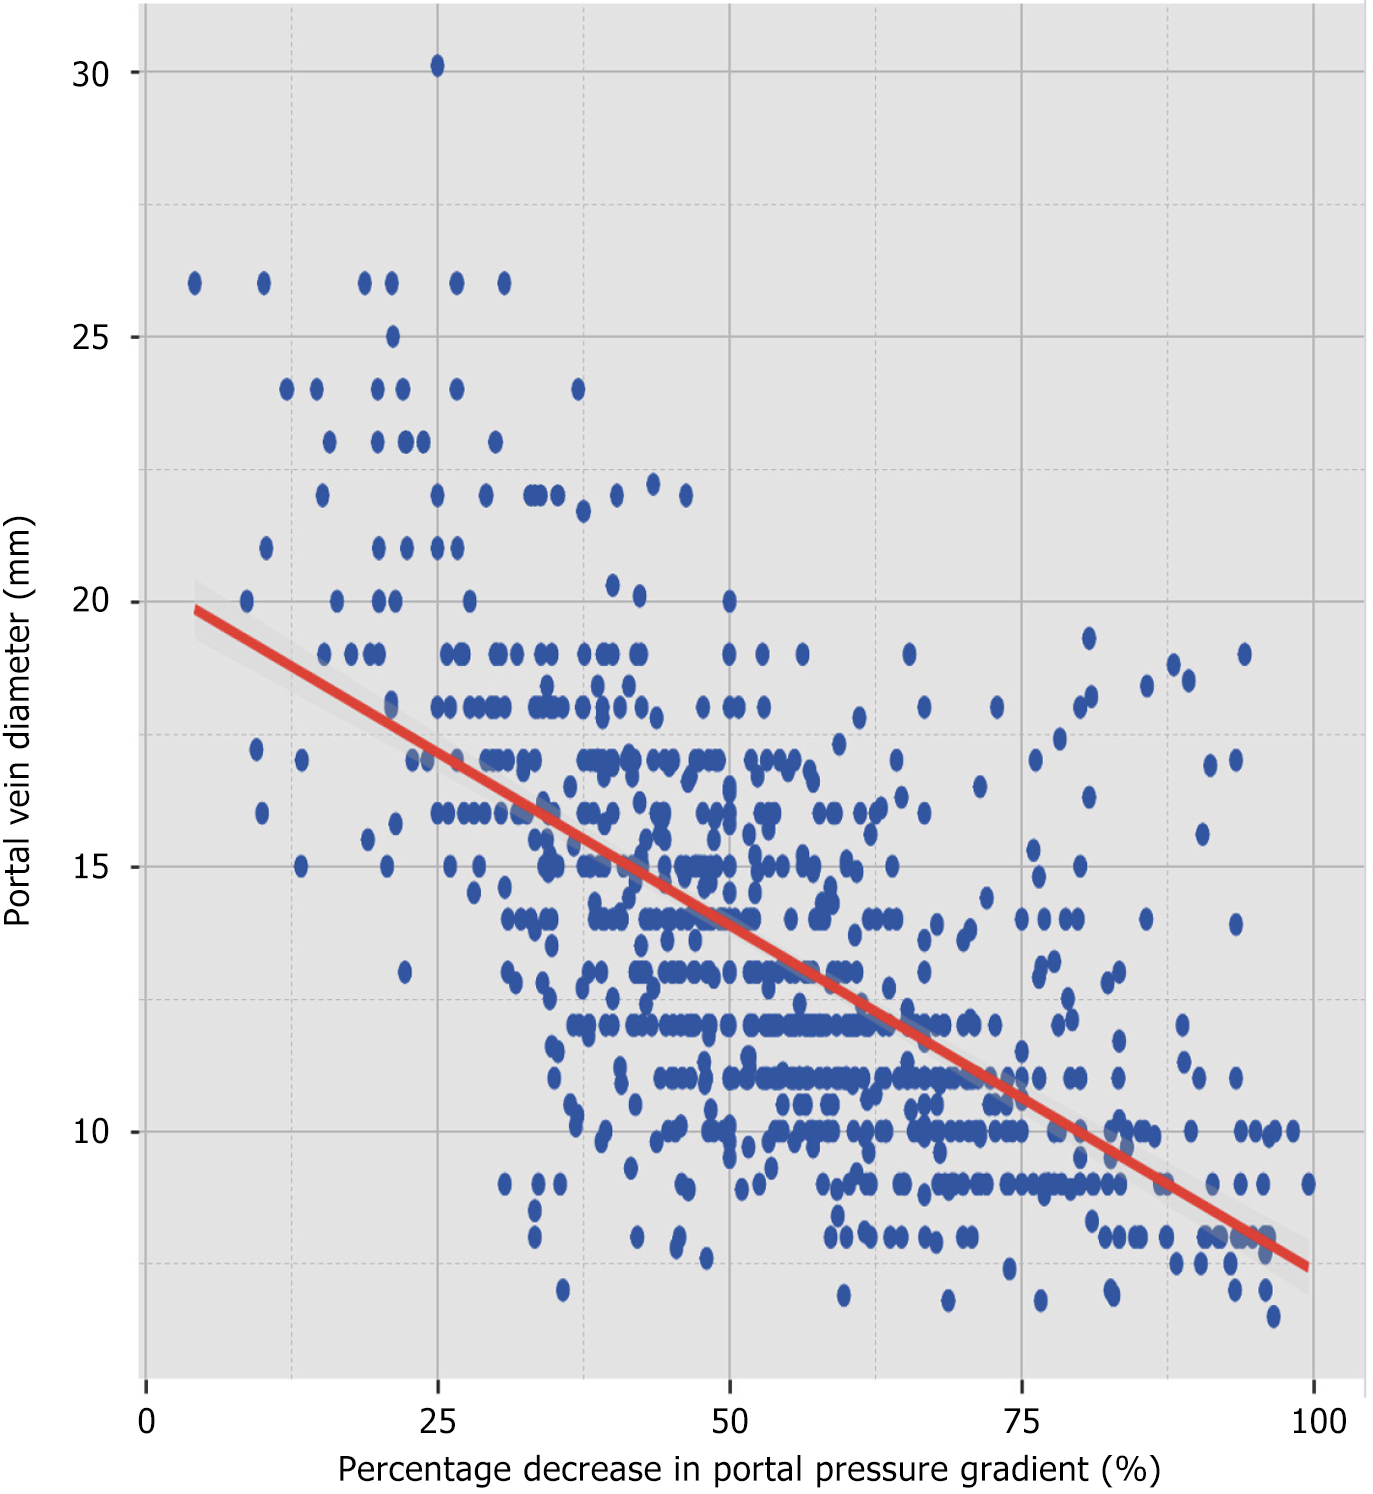
Figure 6 Scatter plot illustrating the negative correlation between portal vein diameter and percentage decrease in portal pressure gradient.
The red line represents the linear regression trend.
- Citation: Wang ZB, Zhu B, Meng MM, Wu YF, Zhang Y, Li DZ, Tian H, Wang FC, Lv YF, Ye QX, Liu FQ. Effect of portal pressure gradient reduction on outcomes after transjugular intrahepatic portosystemic shunt in portal hypertension patients. World J Hepatol 2025; 17(3): 103261
- URL: https://www.wjgnet.com/1948-5182/full/v17/i3/103261.htm
- DOI: https://dx.doi.org/10.4254/wjh.v17.i3.103261


