Copyright
©The Author(s) 2025.
World J Hepatol. Mar 27, 2025; 17(3): 101340
Published online Mar 27, 2025. doi: 10.4254/wjh.v17.i3.101340
Published online Mar 27, 2025. doi: 10.4254/wjh.v17.i3.101340
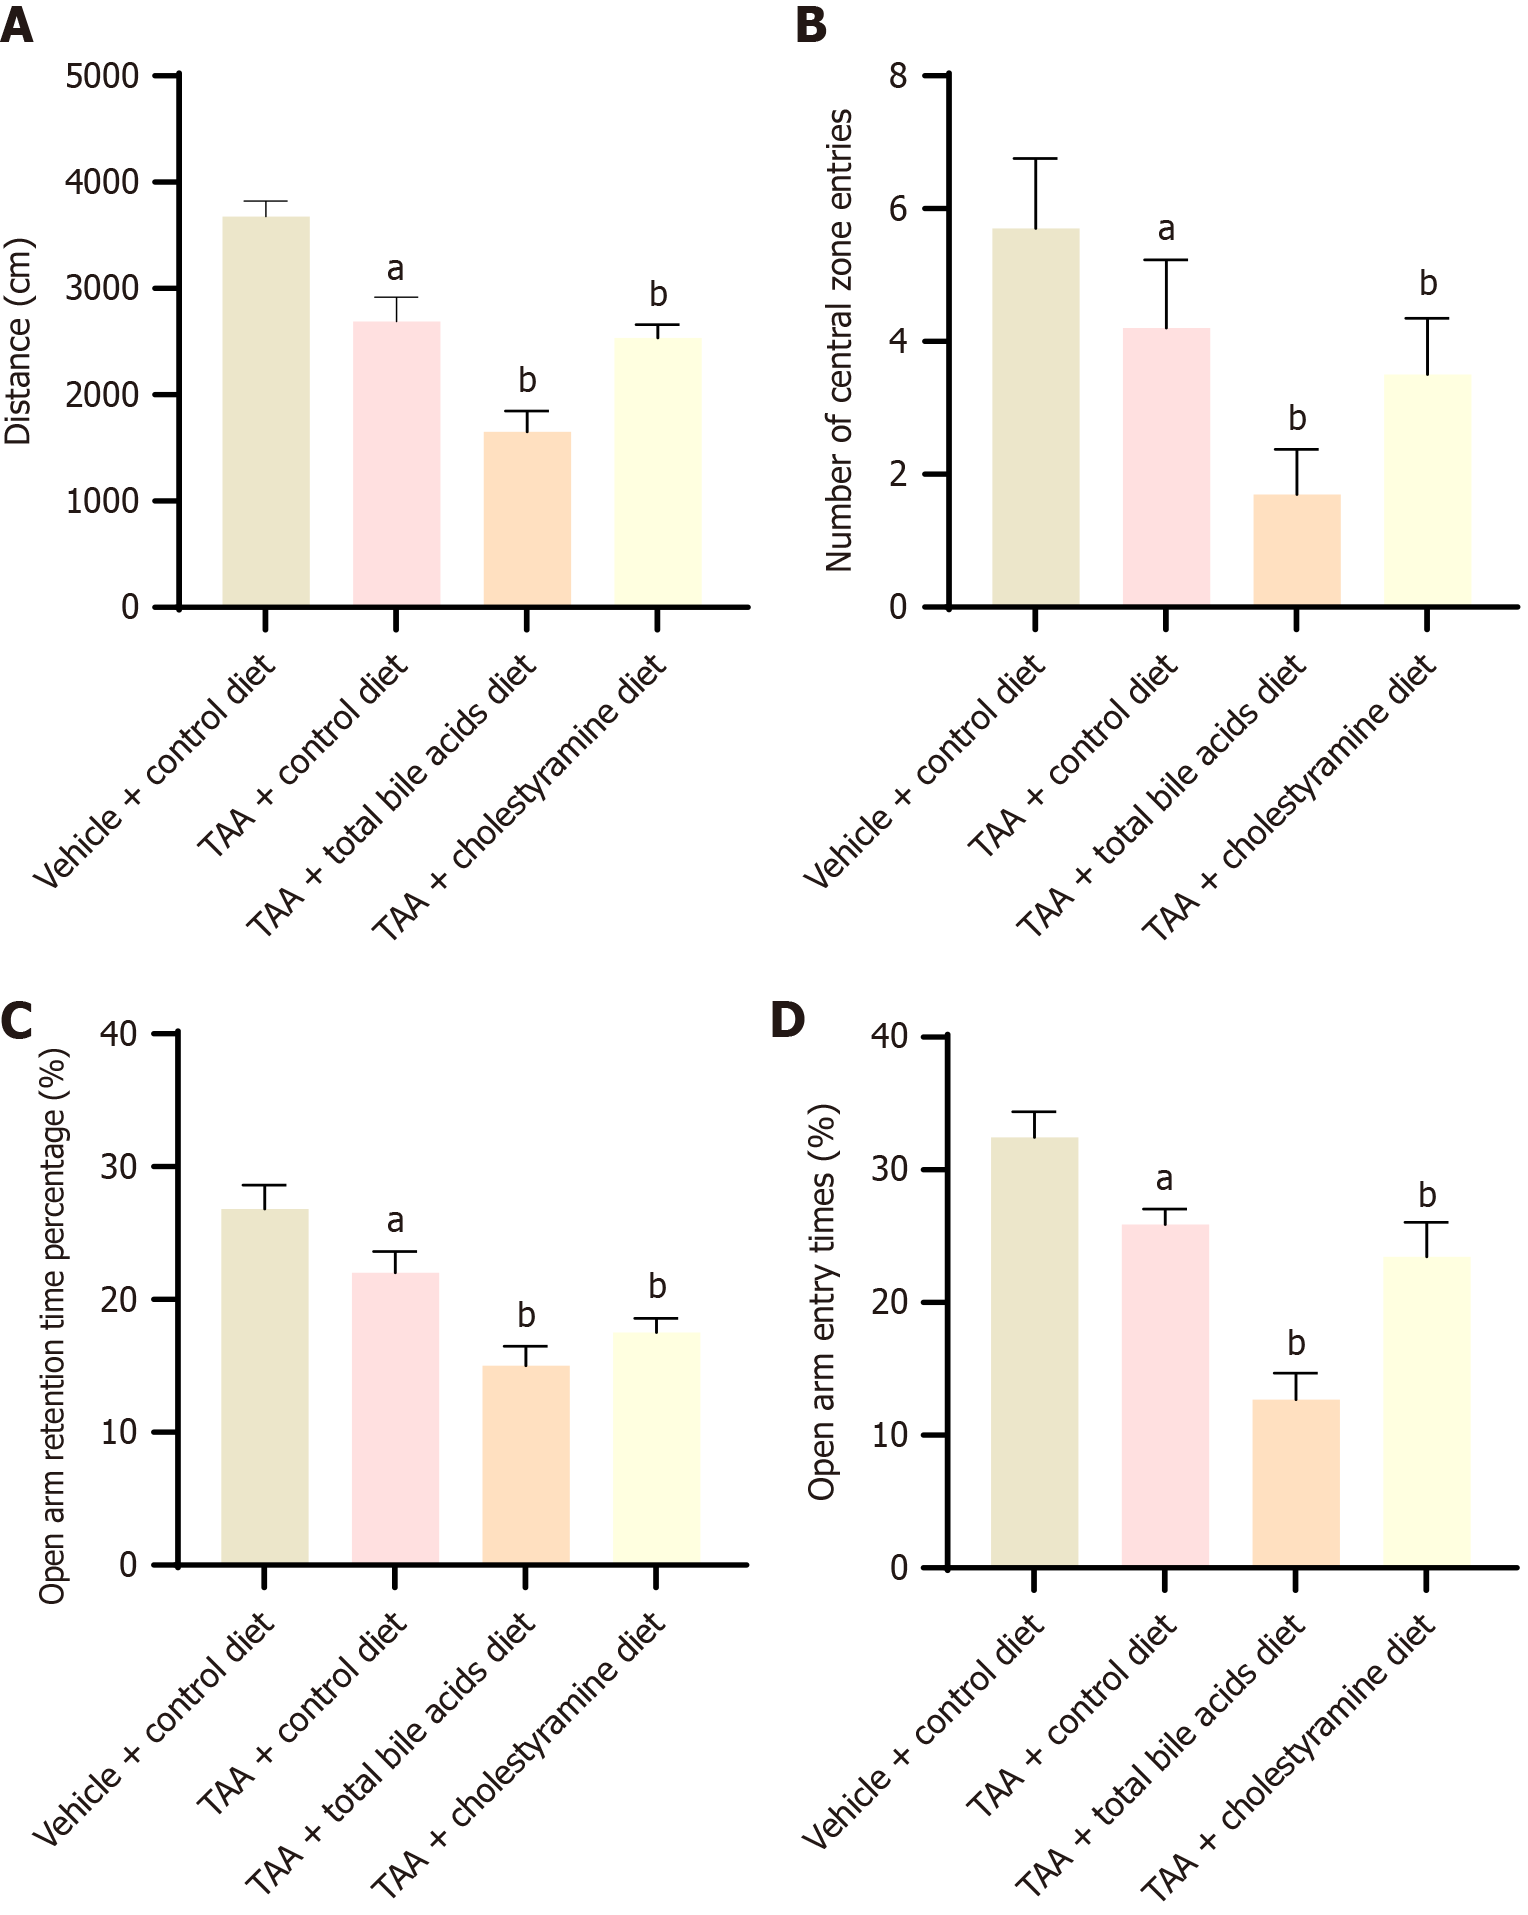
Figure 1 Thioacetamide-induced bile acid feeding in cirrhotic rats led to increased anxiety-like behavior (mean ± SD, n = 10).
A-D: The total distance of the open-field experiment, the number of central areas of the open open-field experiment, and the open arm of the elevated cross-experiment, percentage of entry times and percentage of residence time of open arm in elevated cross test. aP < 0.05 compared with vehicle + control diet group; bP < 0.05 compared with thioacetamide group. TAA: Thioacetamide.
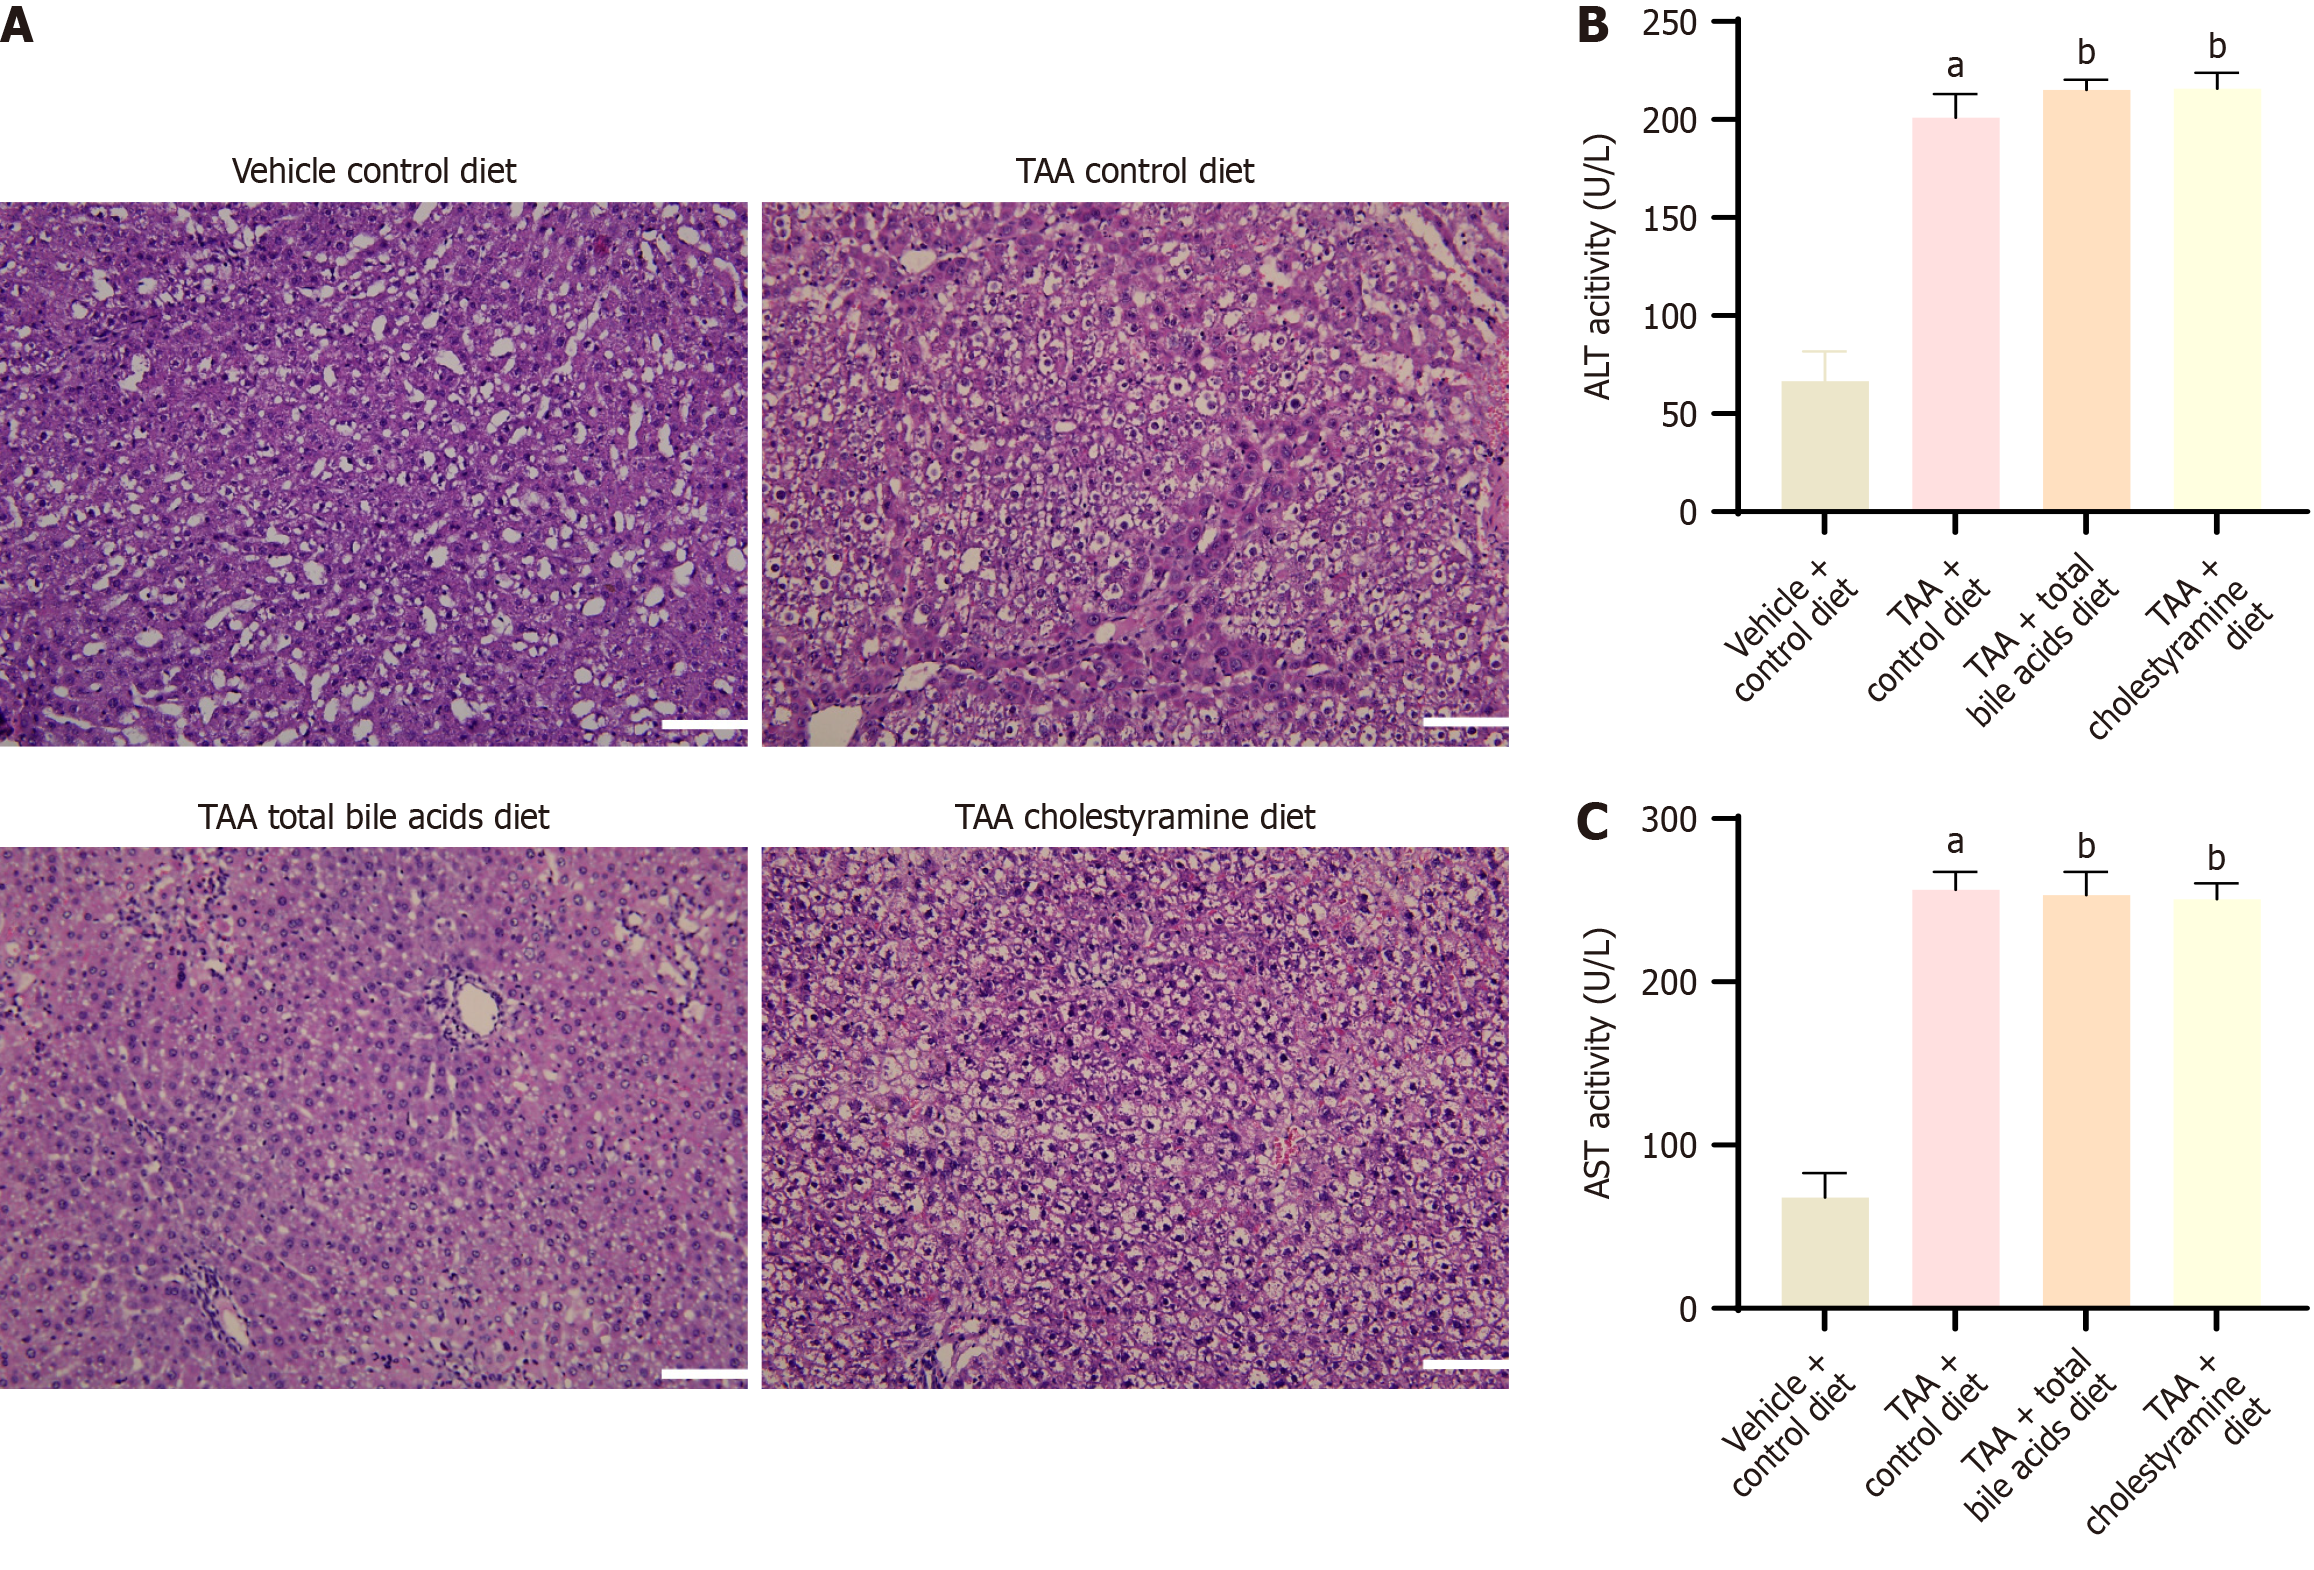
Figure 2 Liver hepatic encephalopathy and liver biochemical indices (mean ± SD, n = 10).
A: Hematoxylin and eosin staining of liver tissue of rats in each group (× 200); B and C: Serum aspartate aminotransferase and alanine aminotransferase indexes. Scale bar = 500 μm. aP < 0.05 compared with vehicle + control diet group; bP < 0.05 compared with thioacetamide group. TAA: Thioacetamide.
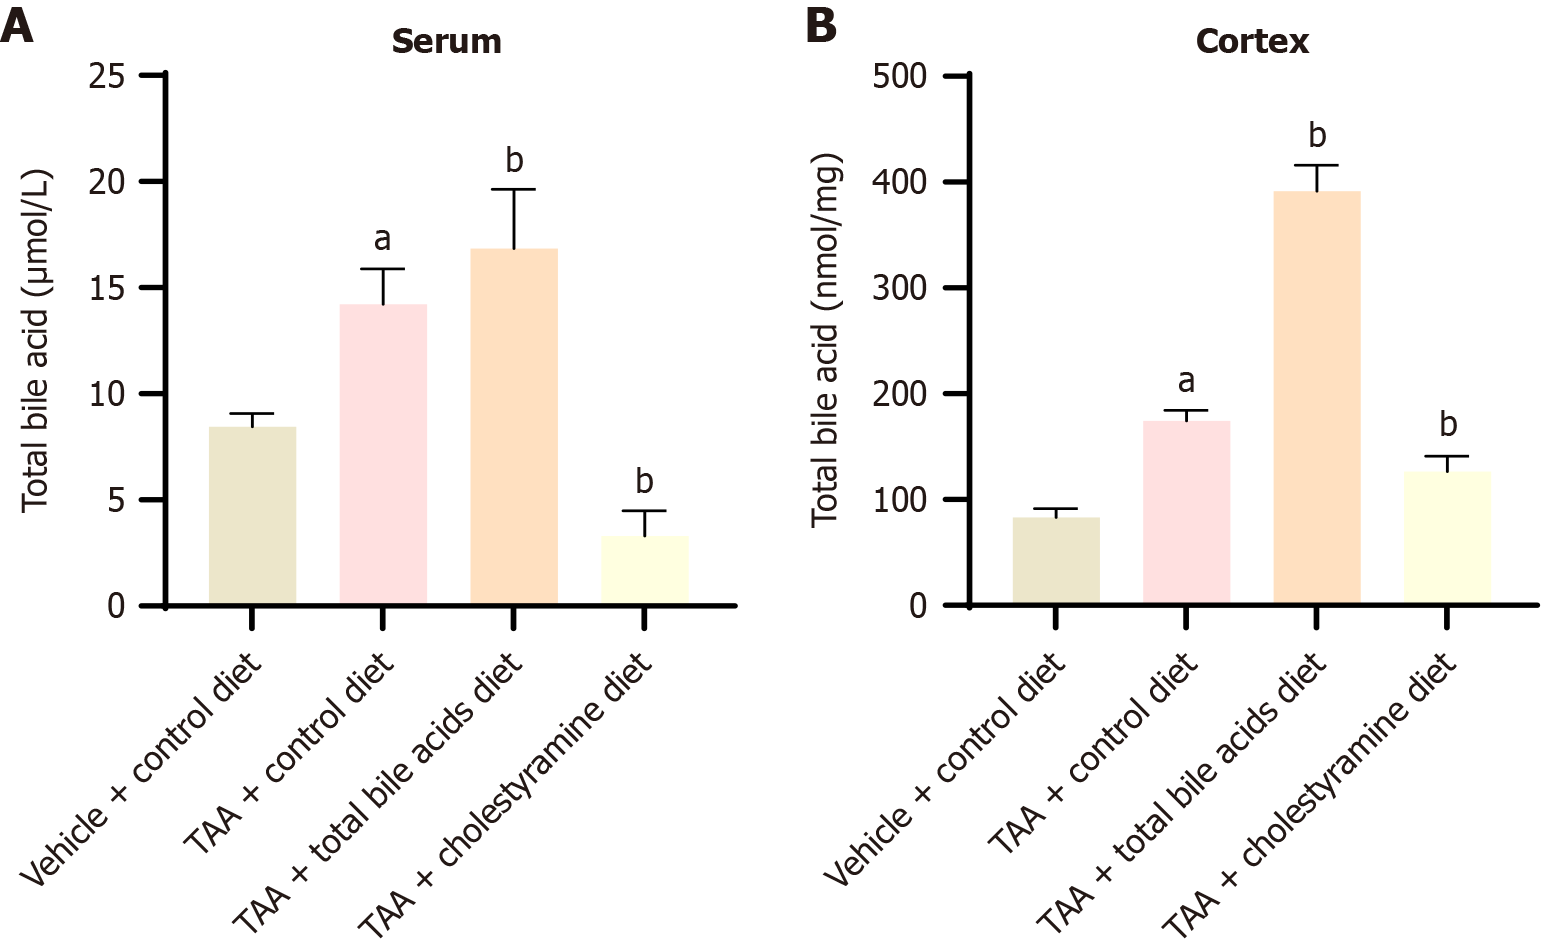
Figure 3 Serum and cerebral cortex total bile acid content (mean ± SD, n = 10).
A: The content of total bile acid in serum; B: The total bile acid content in the cerebral cortex. aP < 0.05 compared with vehicle + control diet group; bP < 0.05 compared with thioacetamide group. TAA: Thioacetamide.
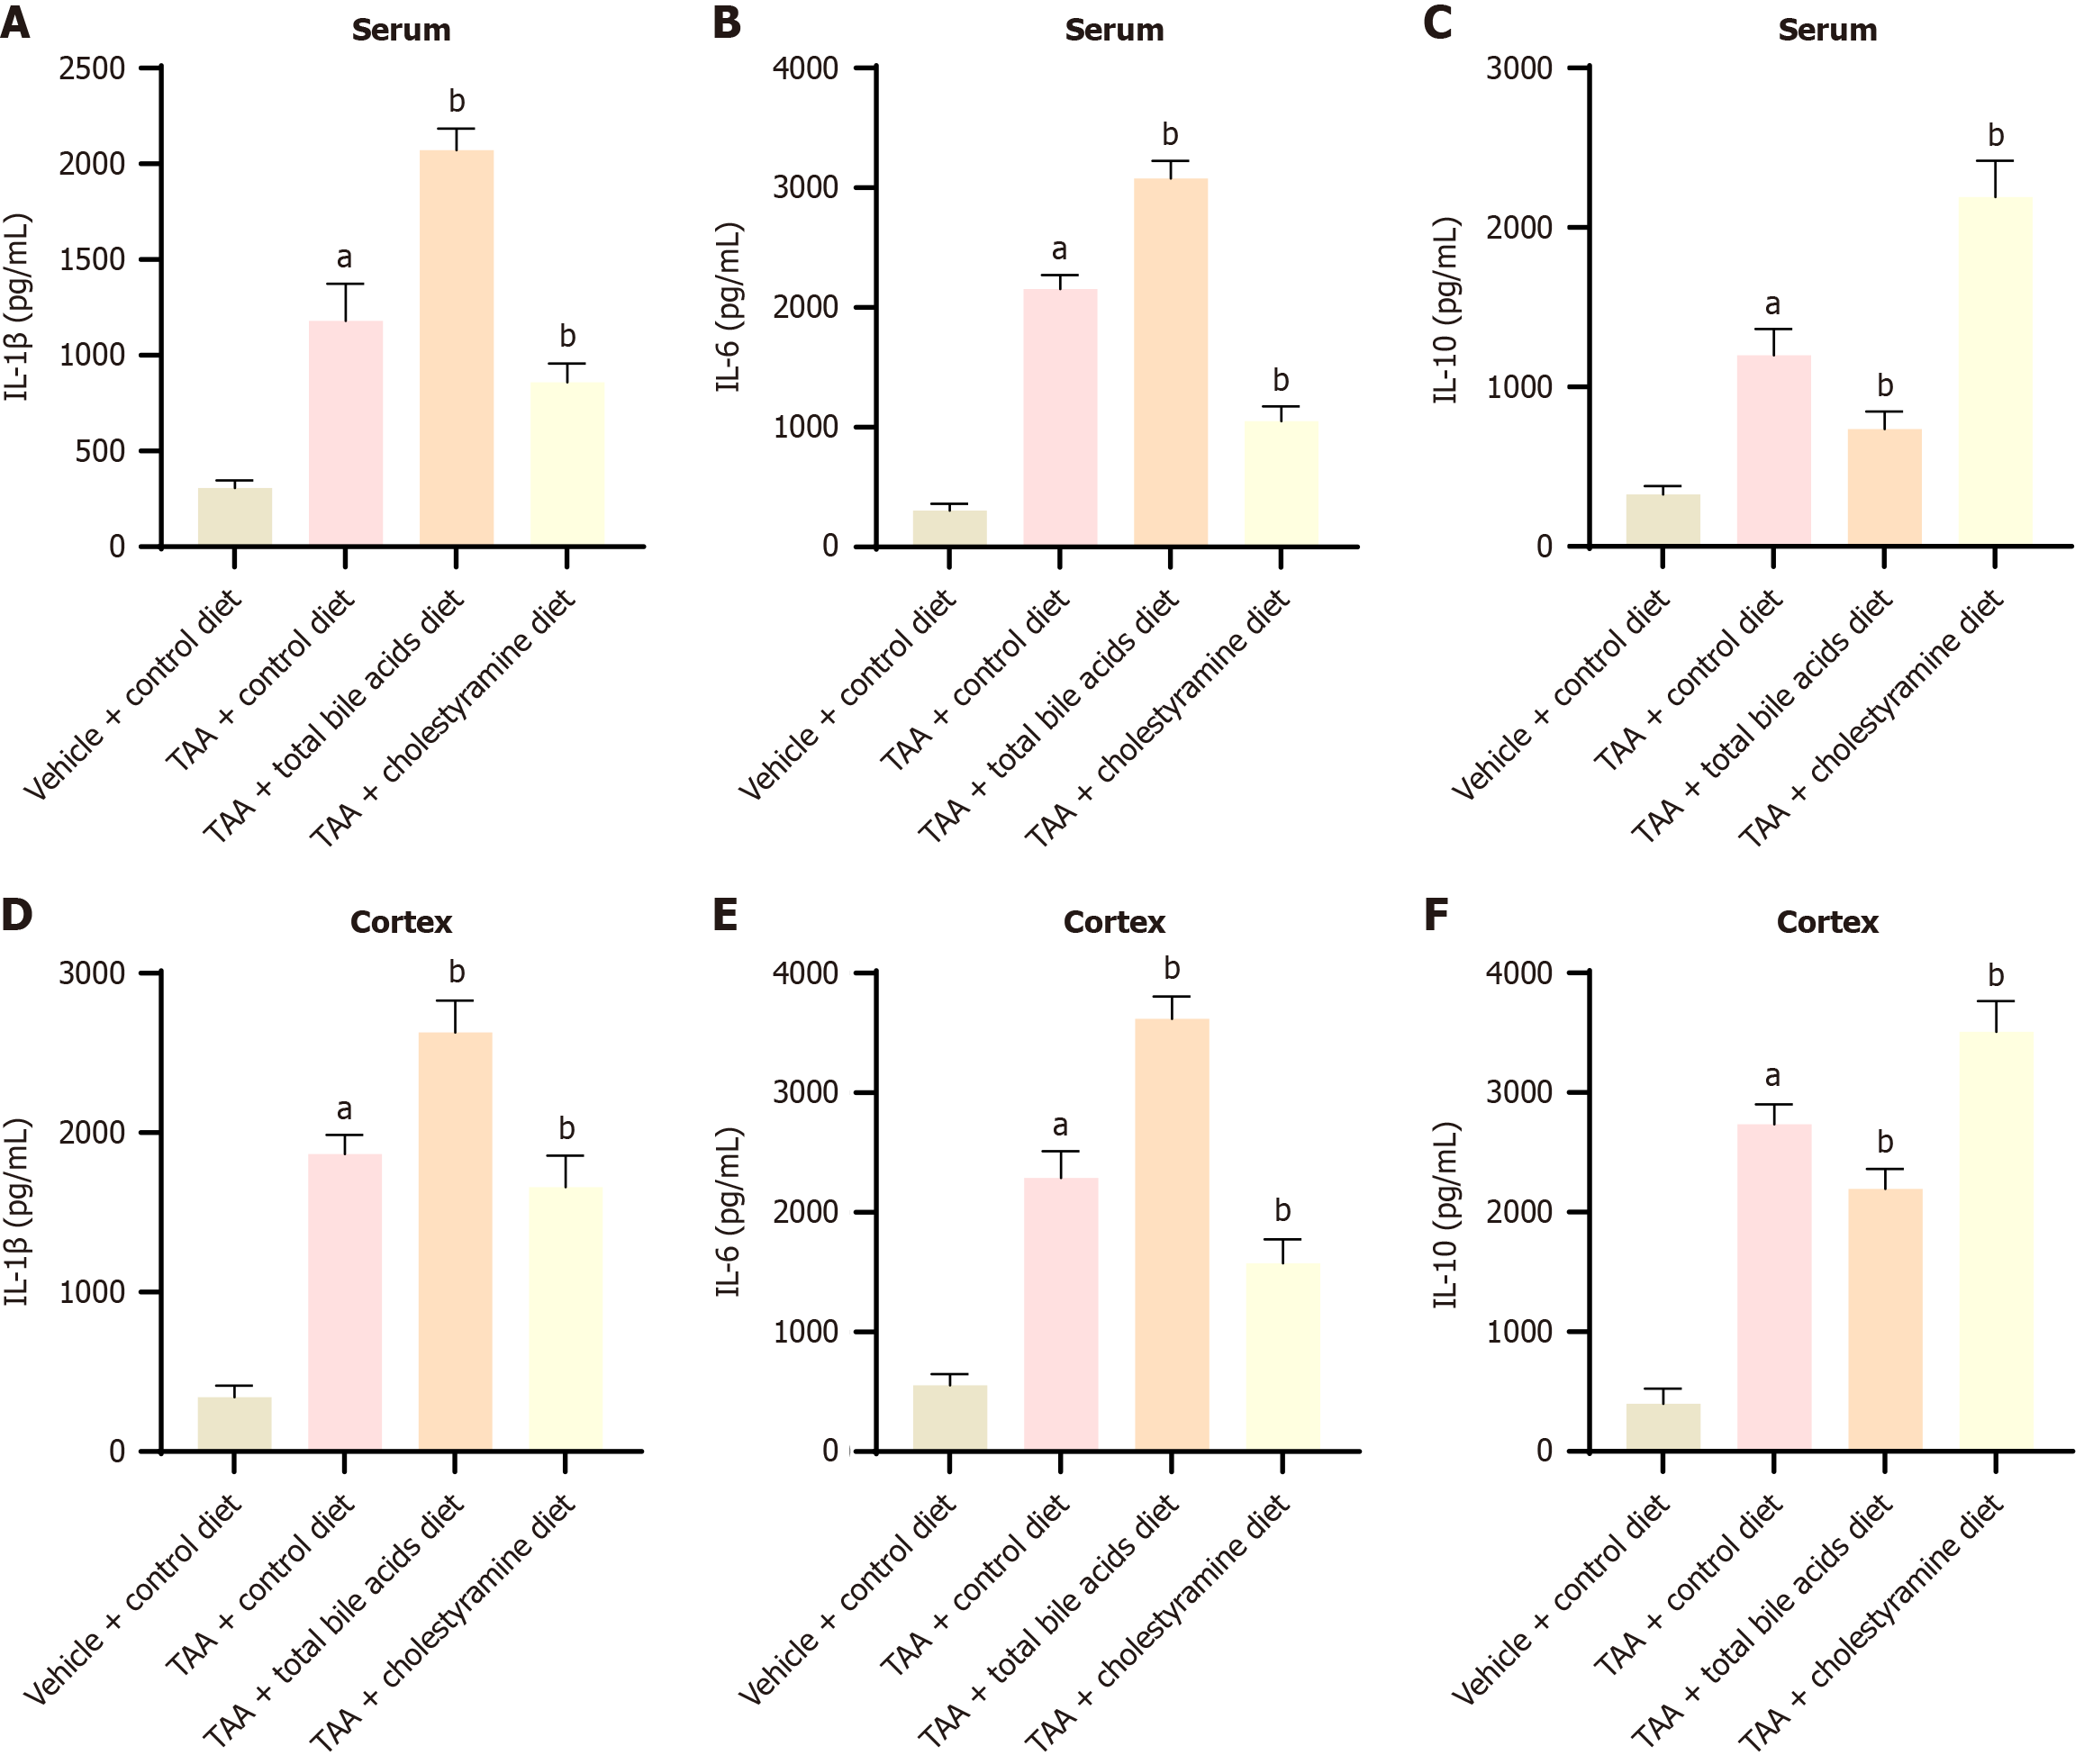
Figure 4 Comparison of serum and cerebral cortex neuroinflammatory factors in each group (mean ± SD, n = 10).
A-C: The content comparison of interleukin-1β (IL-1β), IL-6, and IL-10 in serum of each group; D-F: Compares IL-1β, IL-6, and IL-10 in the cerebral cortex. aP < 0.05 compared with vehicle + control diet group; bP < 0.05 compared with thioacetamide group. IL: Interleukin; TAA: Thioacetamide.
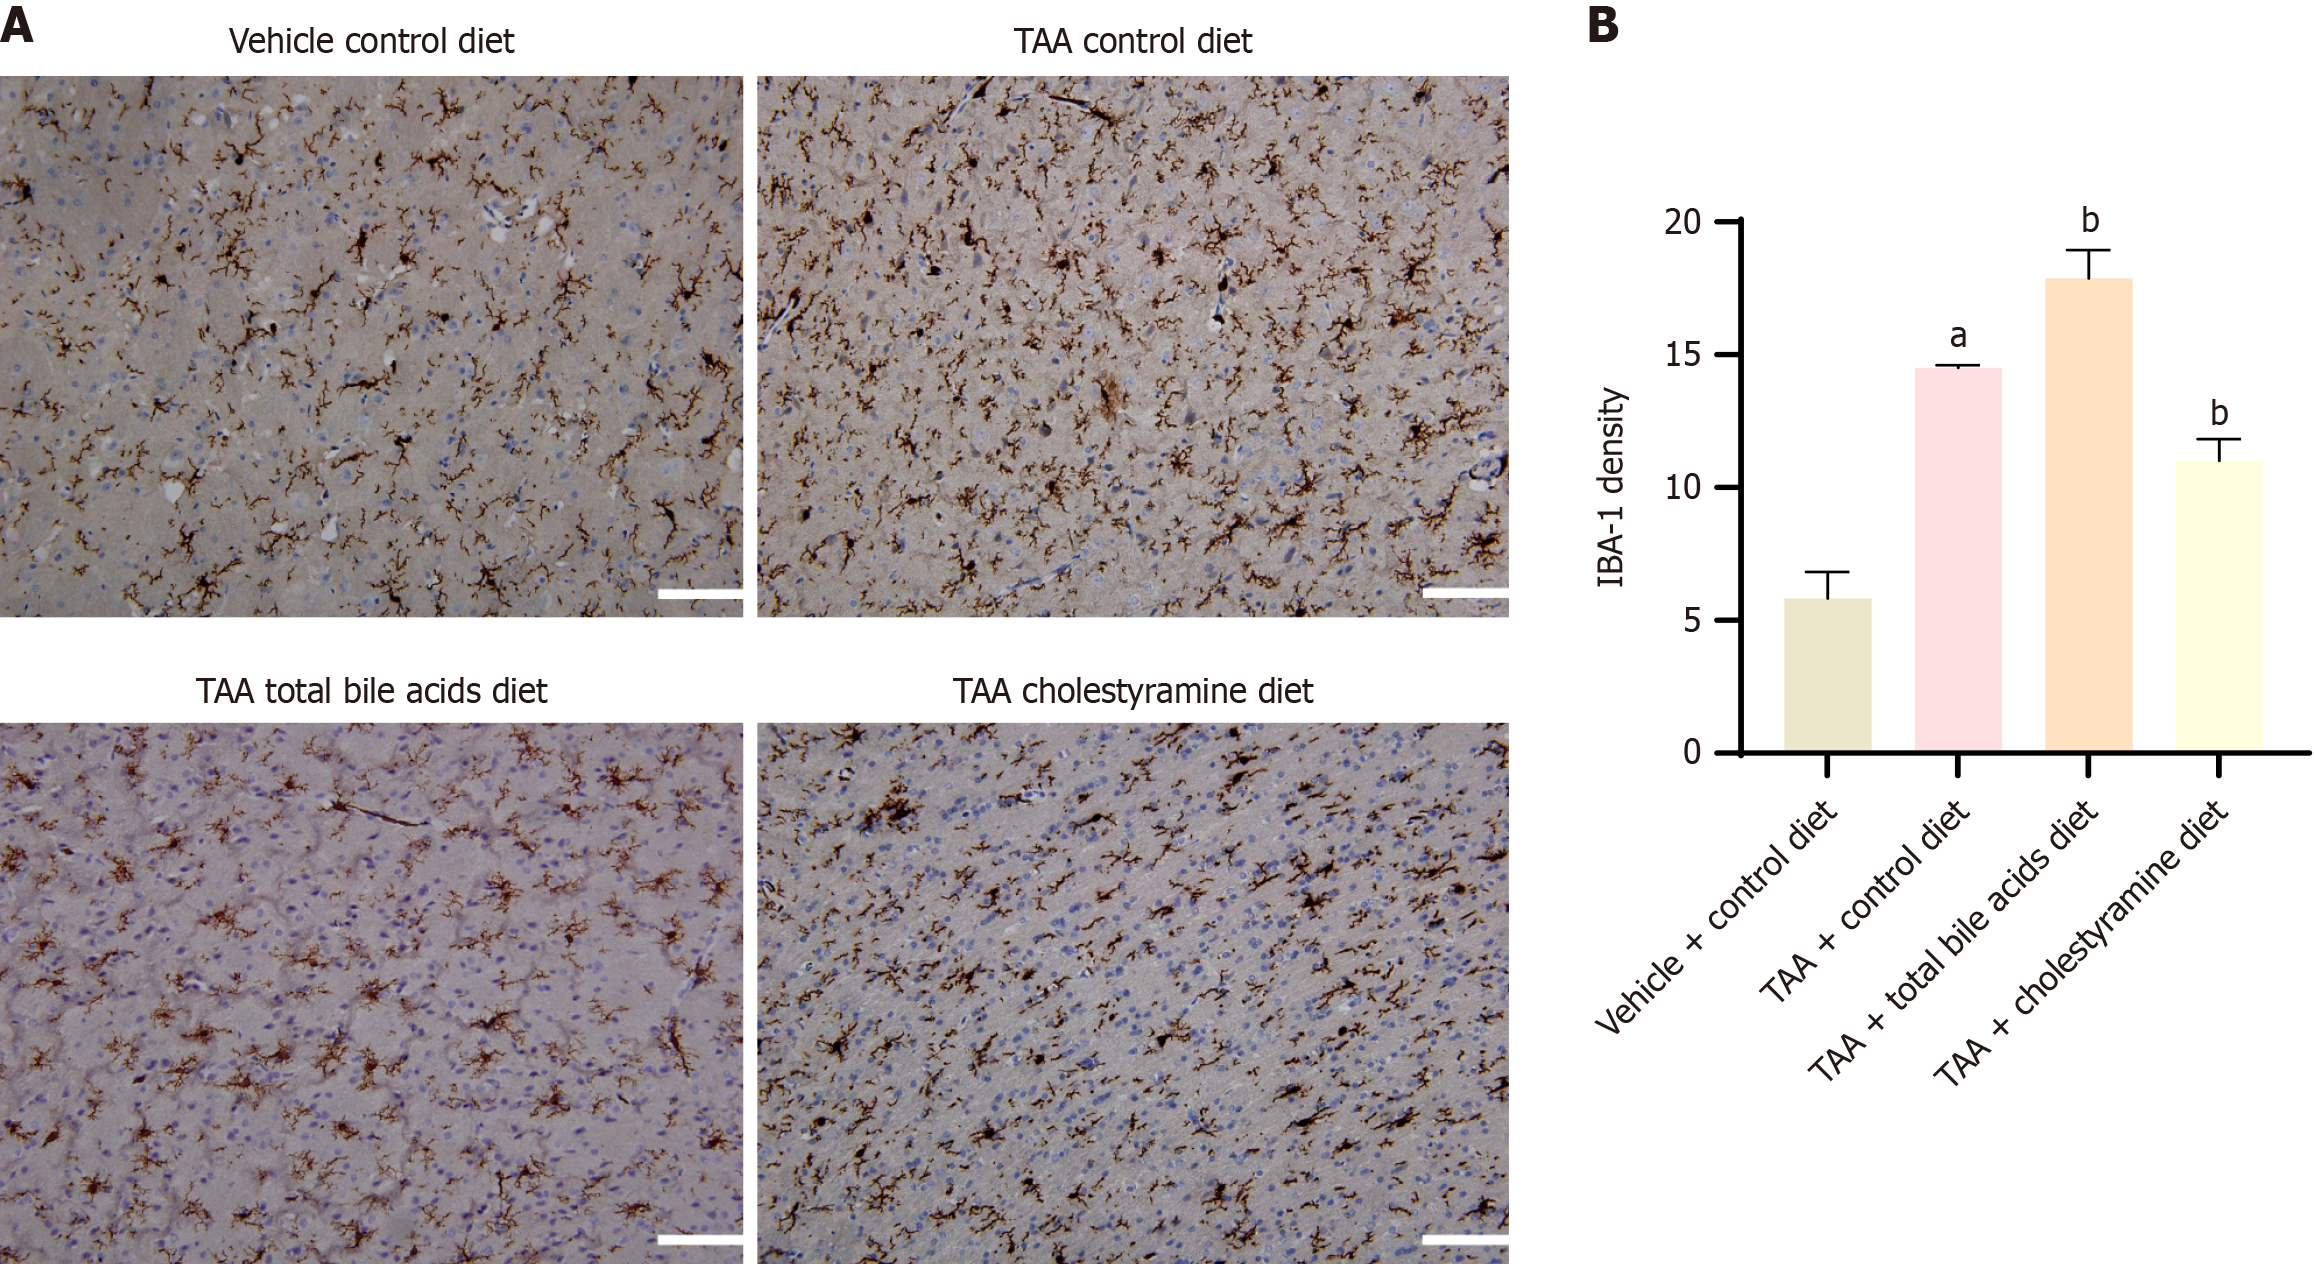
Figure 5 Immunohistochemical results of expression of microglia activation marker ionized calcium-binding adaptor molecule-1 in cerebral cortex (mean ± SD, n = 10).
A: Results of immunochemical staining of the cerebral cortex (× 200); B: Comparison of the expression level of ionized calcium-binding adaptor molecule-1 protein in the cerebral cortex of rats in the four groups. aP < 0.05 compared with vehicle + control diet group; bP < 0.05 compared with thioacetamide group. TAA: Thioacetamide; IBA-1: Ionized calcium-binding adaptor molecule-1.
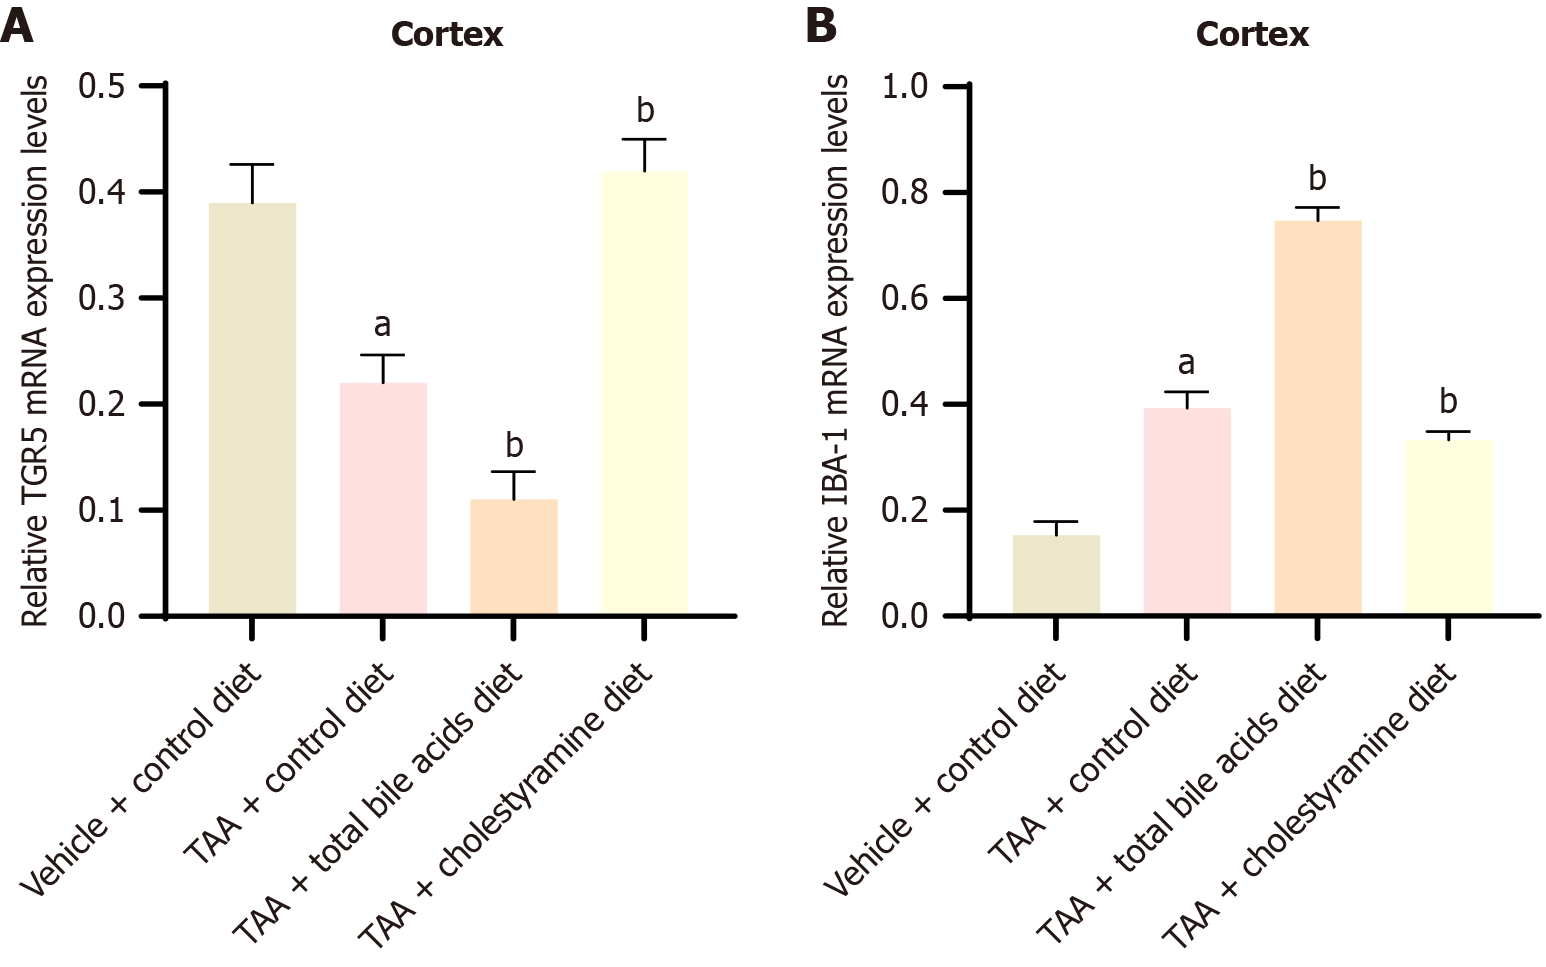
Figure 6 Takeda G protein-coupled receptor 5 and ionized calcium-binding adaptor molecule-1 were measured by reverse transcription polymerase chain reaction (mean ± SD, n = 10).
A and B: The expression of Takeda G protein-coupled receptor 5 and ionized calcium-binding adaptor molecule-1 in the cerebral cortex, respectively. aP < 0.05 compared with vehicle + control diet group; bP < 0.05 compared with thioacetamide group. TAA: Thioacetamide; TGR5: Takeda G protein-coupled receptor 5; IBA-1: Ionized calcium-binding adaptor molecule-1.
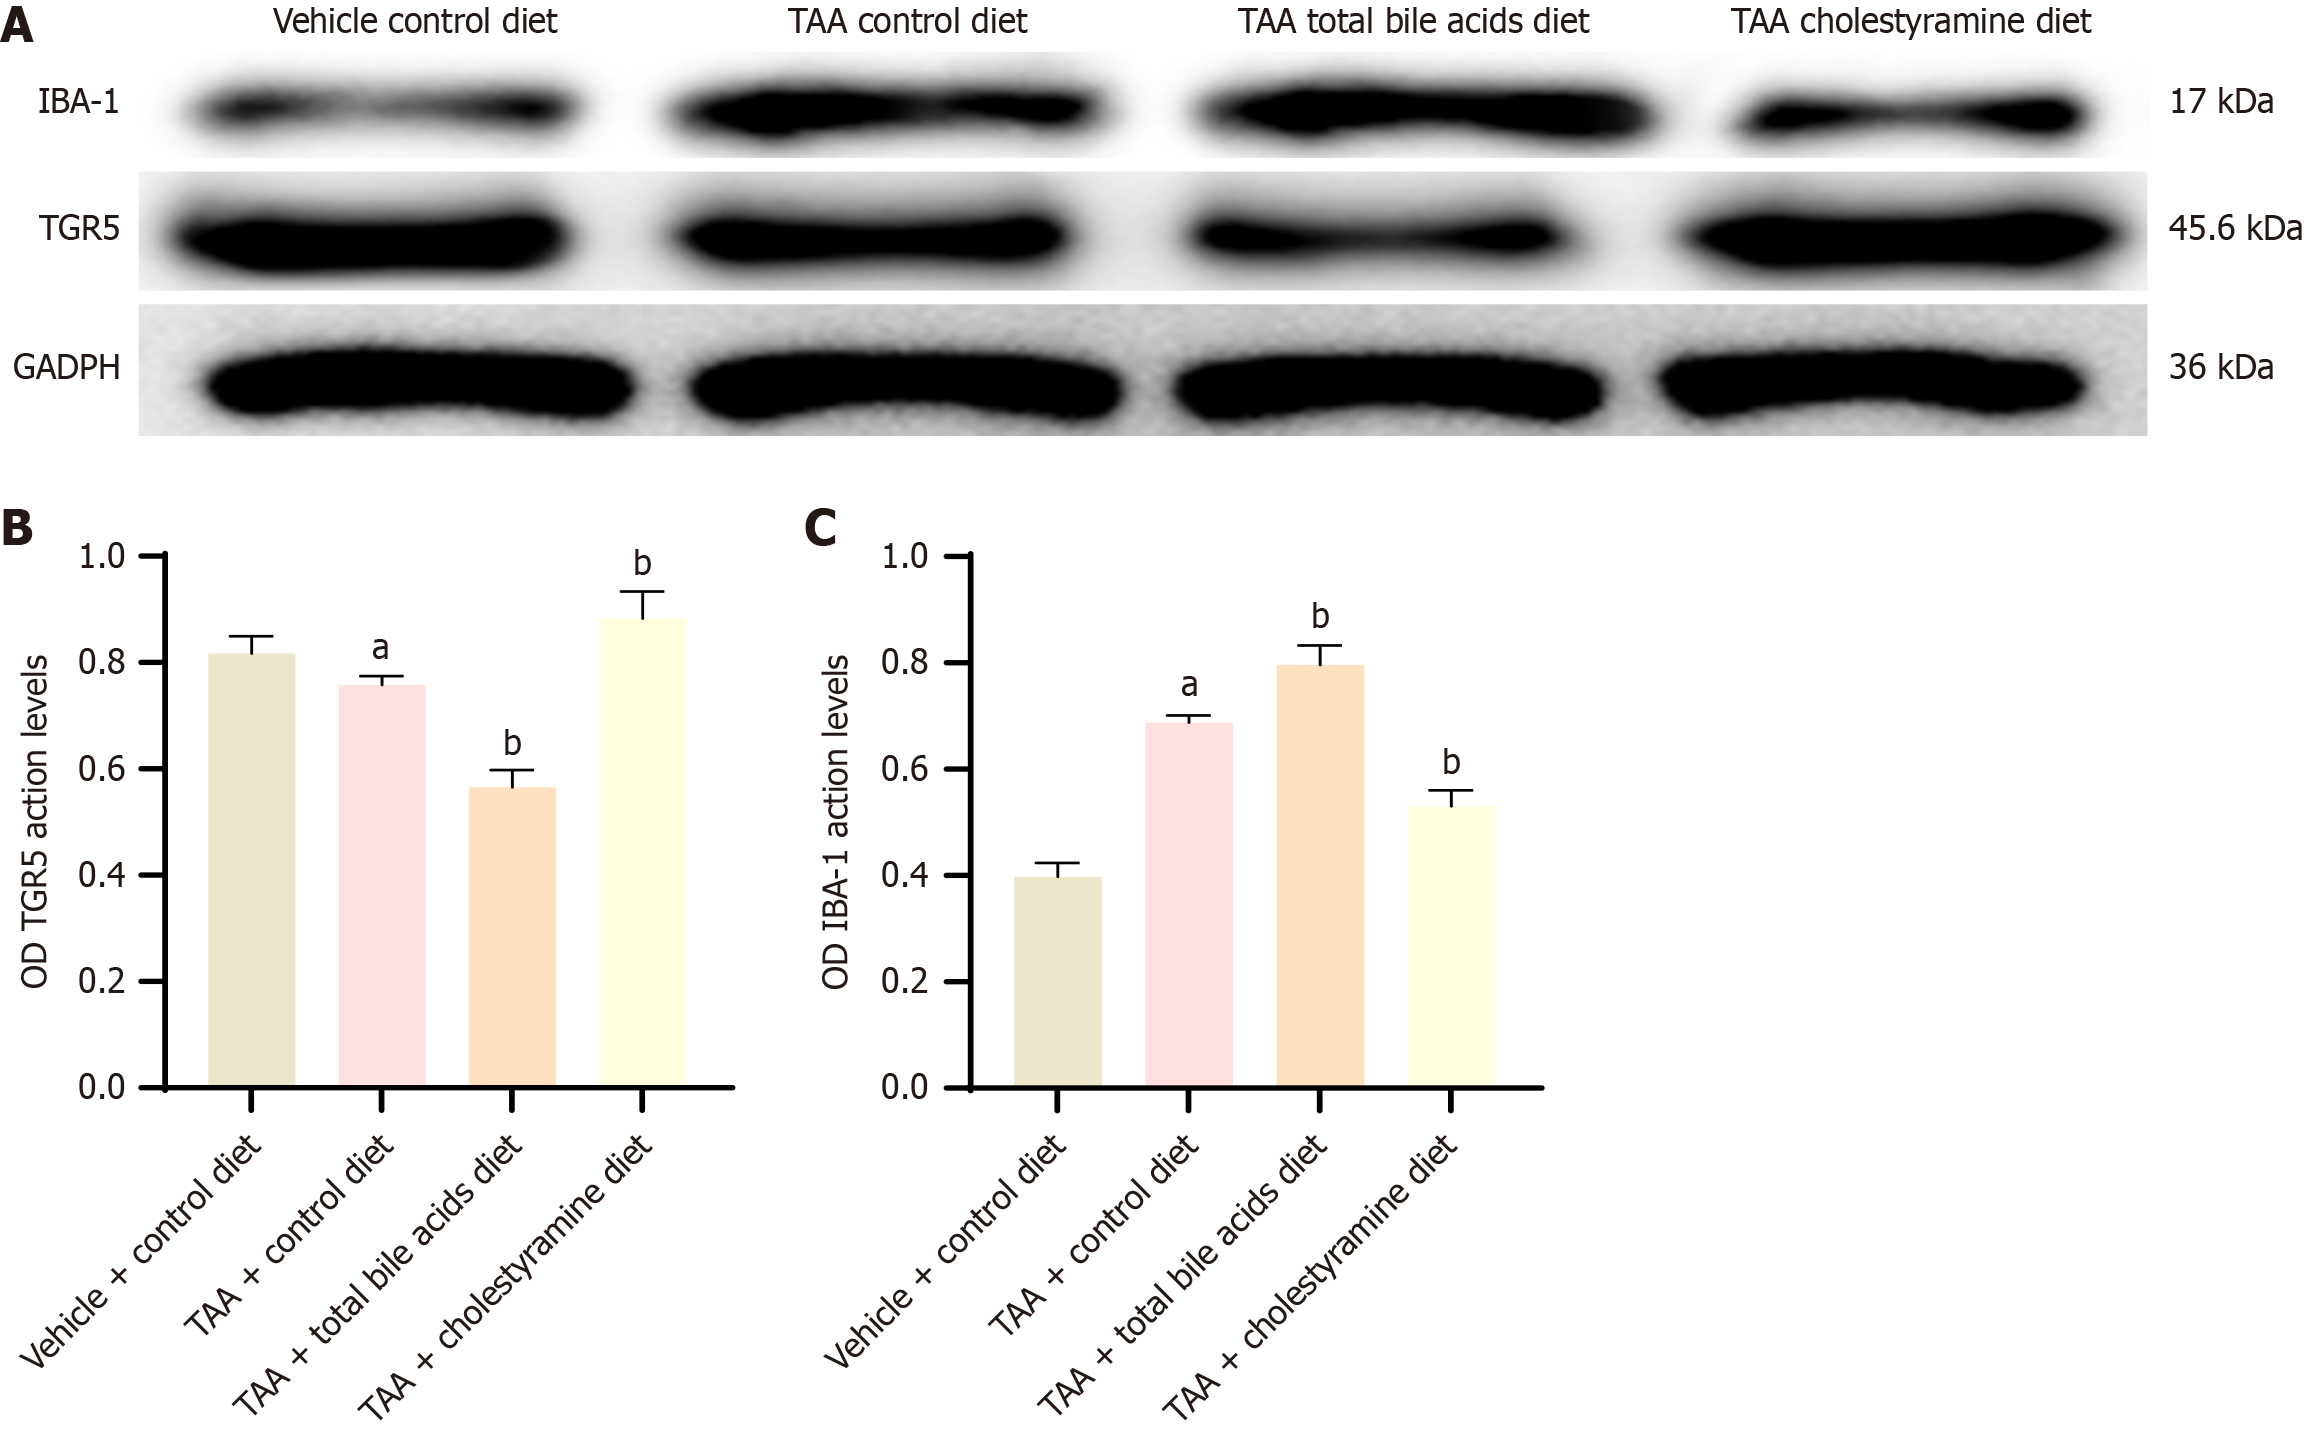
Figure 7 Western blot results of ionized calcium-binding adaptor molecule-1 and Takeda G protein-coupled receptor 5 protein expression in cerebral cortex of rats in each group (mean ± SD, n = 10).
A: Protein expression bands of ionized calcium-binding adaptor molecule-1 and Takeda G protein-coupled receptor 5 in the cerebral cortex of thioacetamide-induced liver cirrhosis model with GADPH as the upper sample control; B and C: The expression of ionized calcium-binding adaptor molecule-1 and Takeda G protein-coupled receptor 5 protein in each group, respectively. aP < 0.05 compared with vehicle + control diet group; bP < 0.05 compared with thioacetamide group. TAA: Thioacetamide; TGR5: Takeda G protein-coupled receptor 5; IBA-1: Ionized calcium-binding adaptor molecule-1.
- Citation: Ren C, Cha L, Huang SY, Bai GH, Li JH, Xiong X, Feng YX, Feng DP, Gao L, Li JY. Dysregulation of bile acid signal transduction causes neurological dysfunction in cirrhosis rats. World J Hepatol 2025; 17(3): 101340
- URL: https://www.wjgnet.com/1948-5182/full/v17/i3/101340.htm
- DOI: https://dx.doi.org/10.4254/wjh.v17.i3.101340


