Copyright
©The Author(s) 2025.
World J Hepatol. Oct 27, 2025; 17(10): 110856
Published online Oct 27, 2025. doi: 10.4254/wjh.v17.i10.110856
Published online Oct 27, 2025. doi: 10.4254/wjh.v17.i10.110856
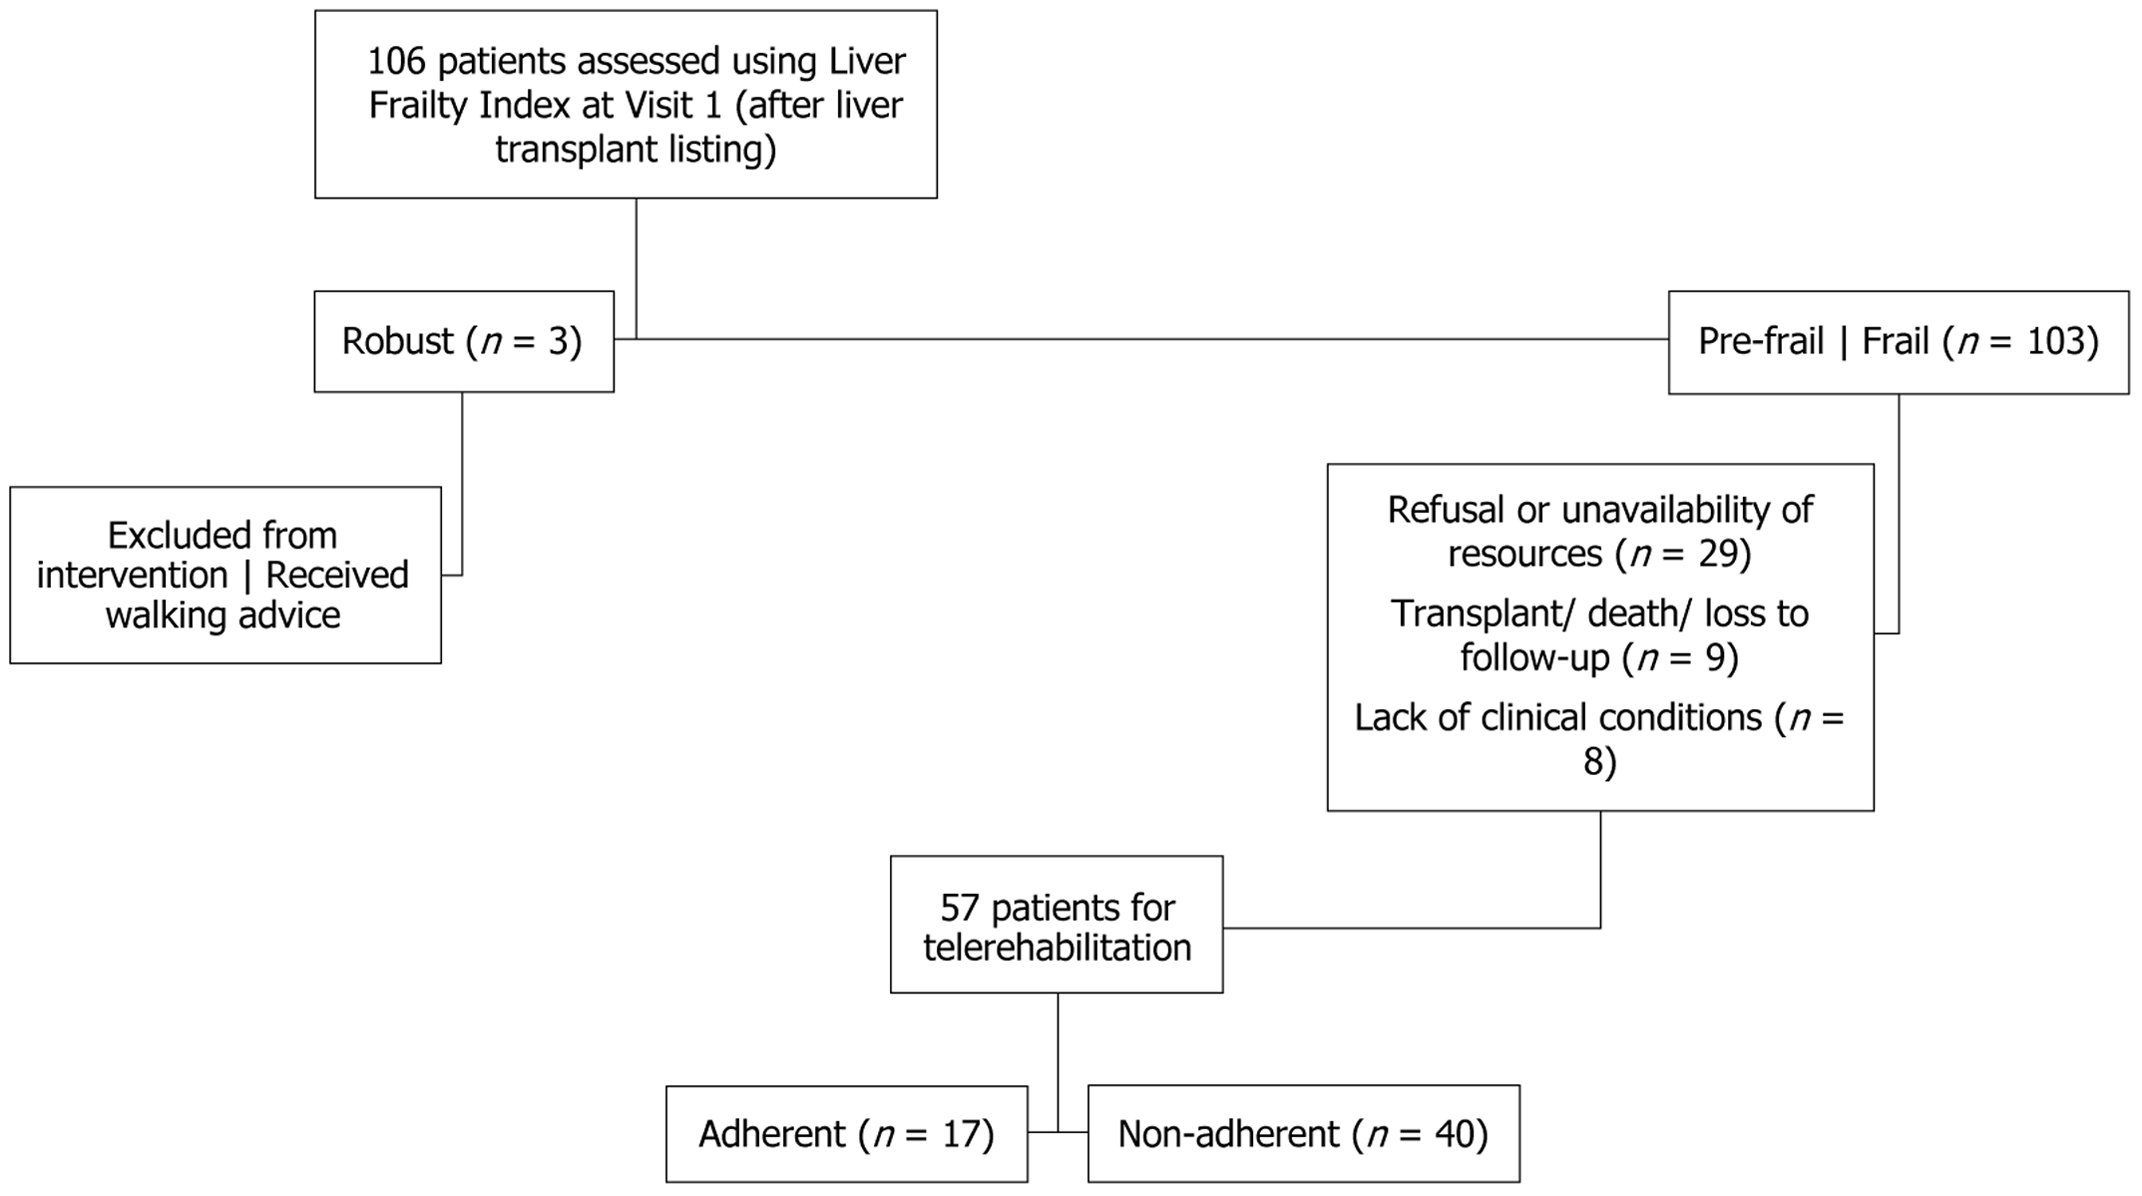
Figure 1 Patient flow through screening, allocation, and telerehabilitation phases.
Patients listed for liver transplantation were assessed at Visit 1 and screened using the Liver Frailty Index. Robust individuals were excluded from the telerehabilitation programme but received standard walking recommendations. Pre-frail and frail patients were evaluated for inclusion; 46 were excluded due to refusal, unavailability of resources, clinical contraindications, or early loss to follow-up. A total of 57 patients initiated telerehabilitation, of whom 17 were considered adherent (≥ 50% session attendance) and 40 were non-adherent.
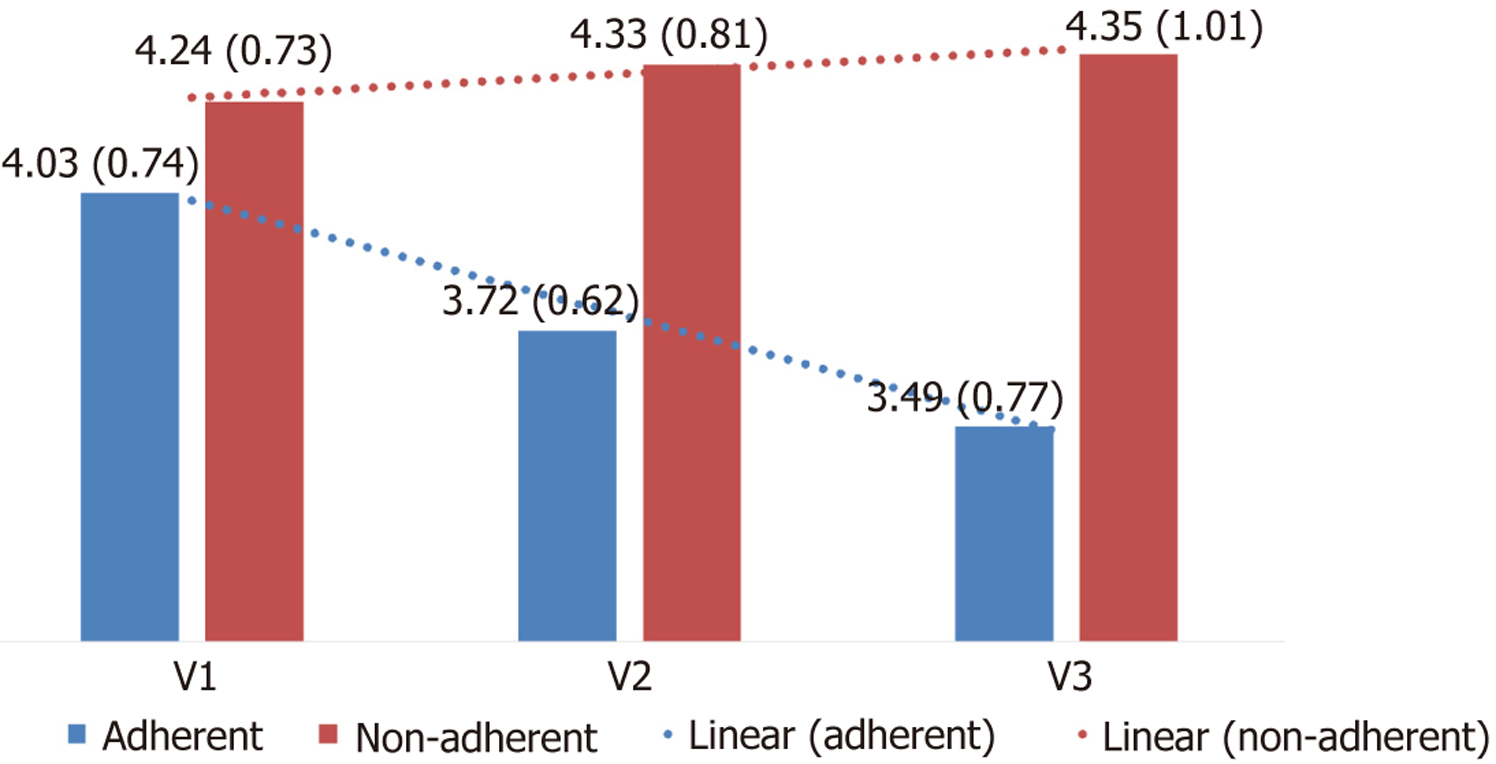
Figure 2 Evolution of Liver Frailty Index scores over time in adherent and non-adherent participants.
Bar graphs represent mean Liver Frailty Index values with standard deviations at each study visit (V1, V2, and V3). The adherent group demonstrated a progressive reduction in frailty scores across visits, while the non-adherent group showed a slight increase. Dotted lines indicate the linear trend for each group.
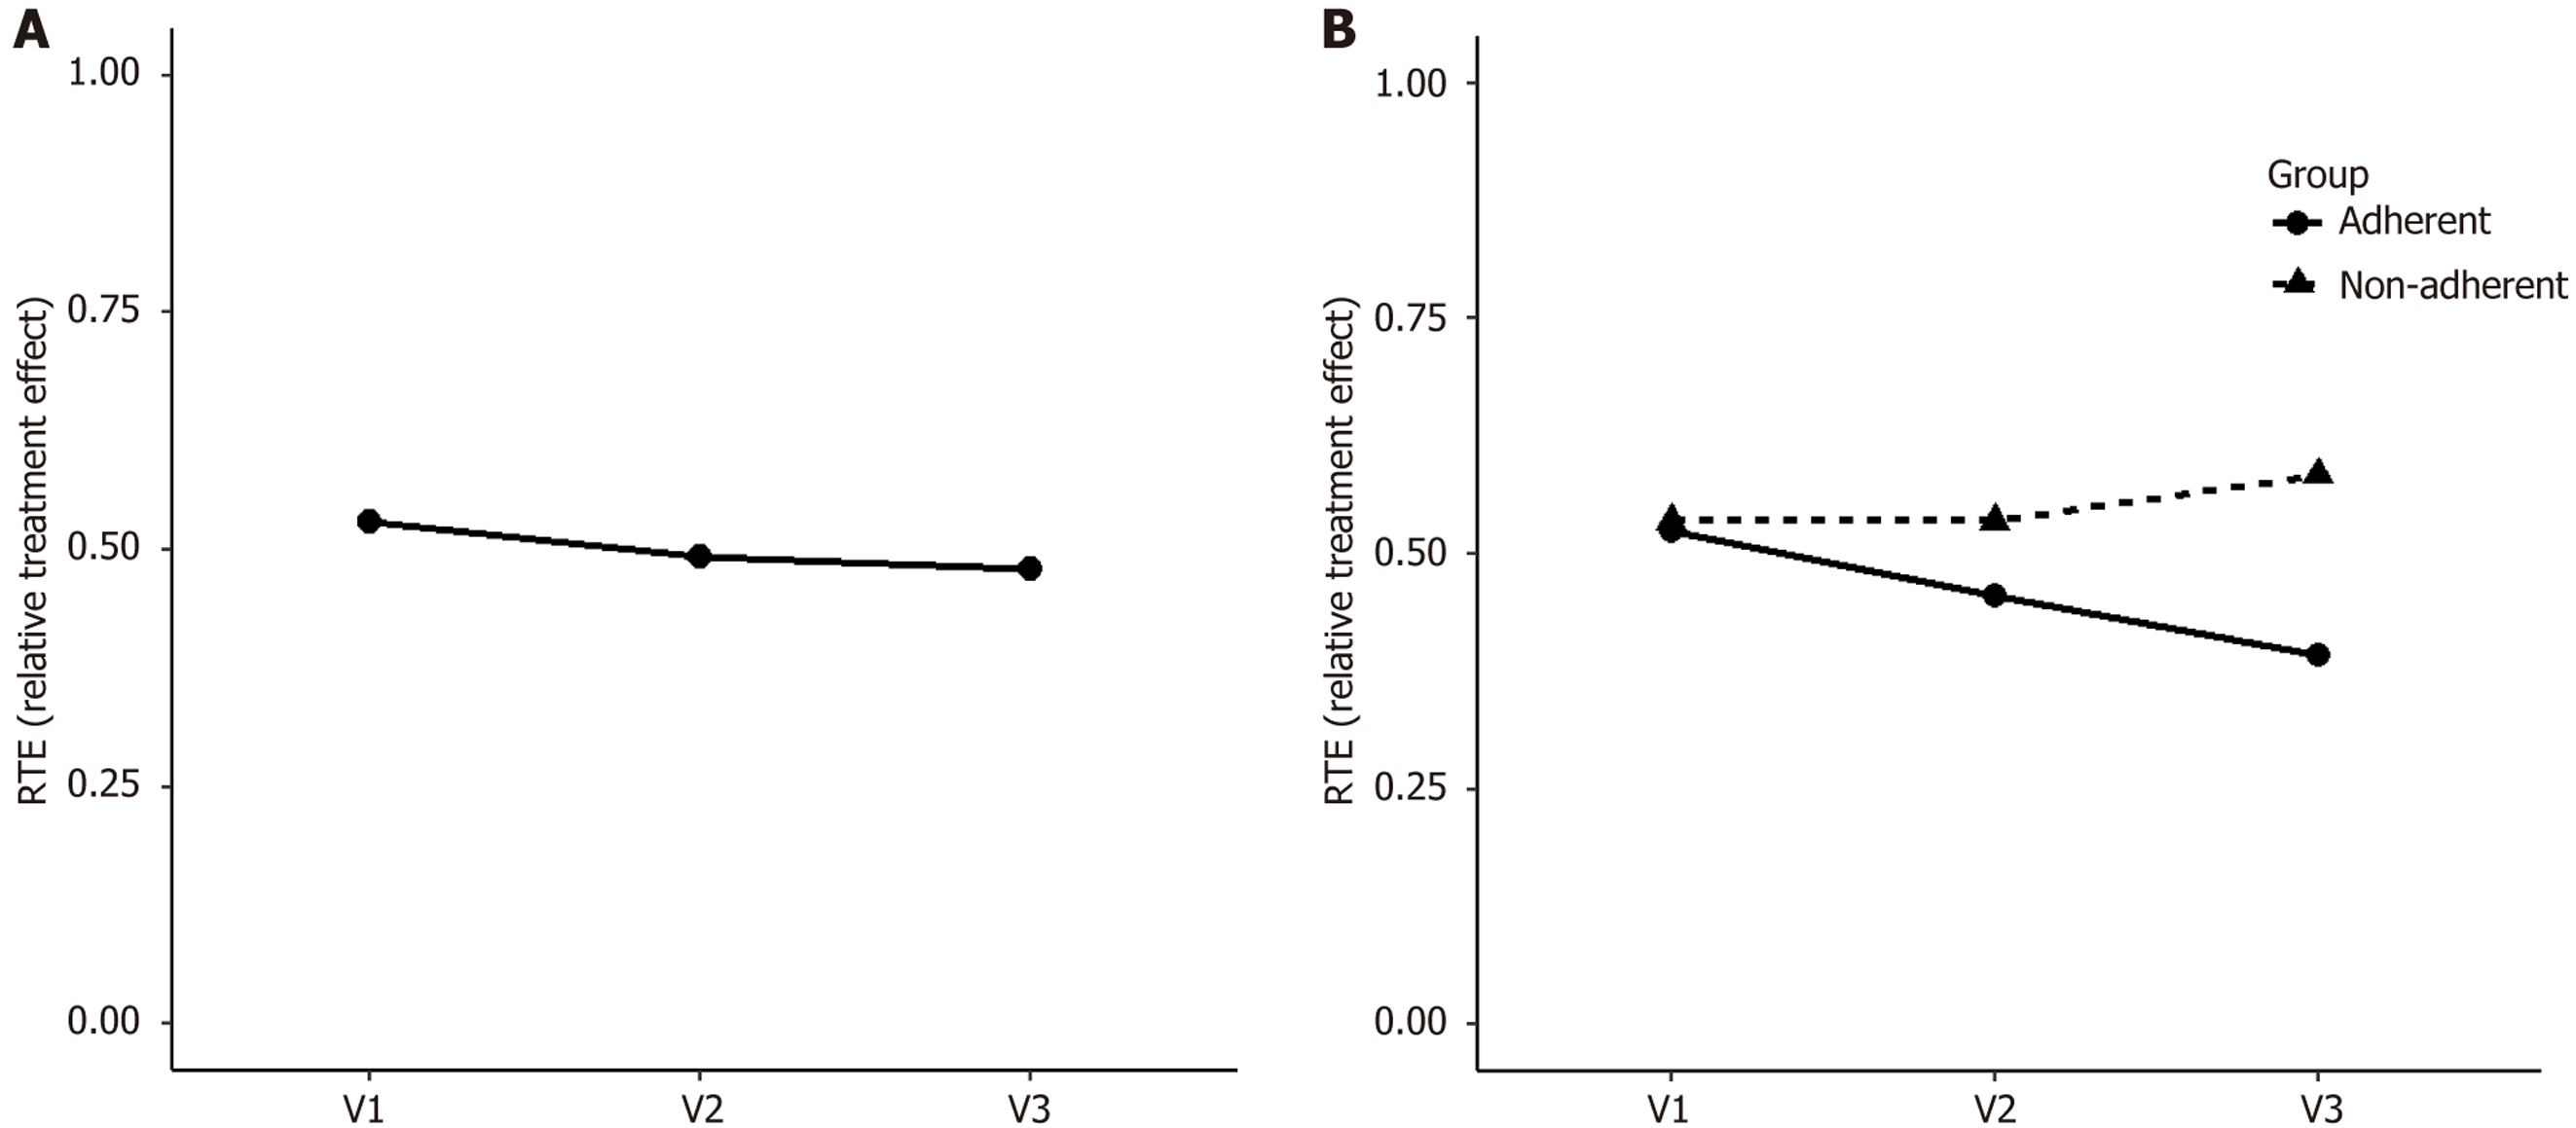
Figure 3 Relative treatment effect values for the Liver Frailty Index across study visits and participant groups.
A: The overall relative treatment effect (RTE) values show a slight reduction in frailty over time for the entire sample; B: RTE trajectories are stratified by adherence group: Adherent patients exhibited a progressive reduction in frailty (decreasing RTE), while non-adherent participants showed a slight increase. RTE values above 0.5 indicate higher frailty; values below 0.5 indicate improvement. RTE: Relative treatment effect.
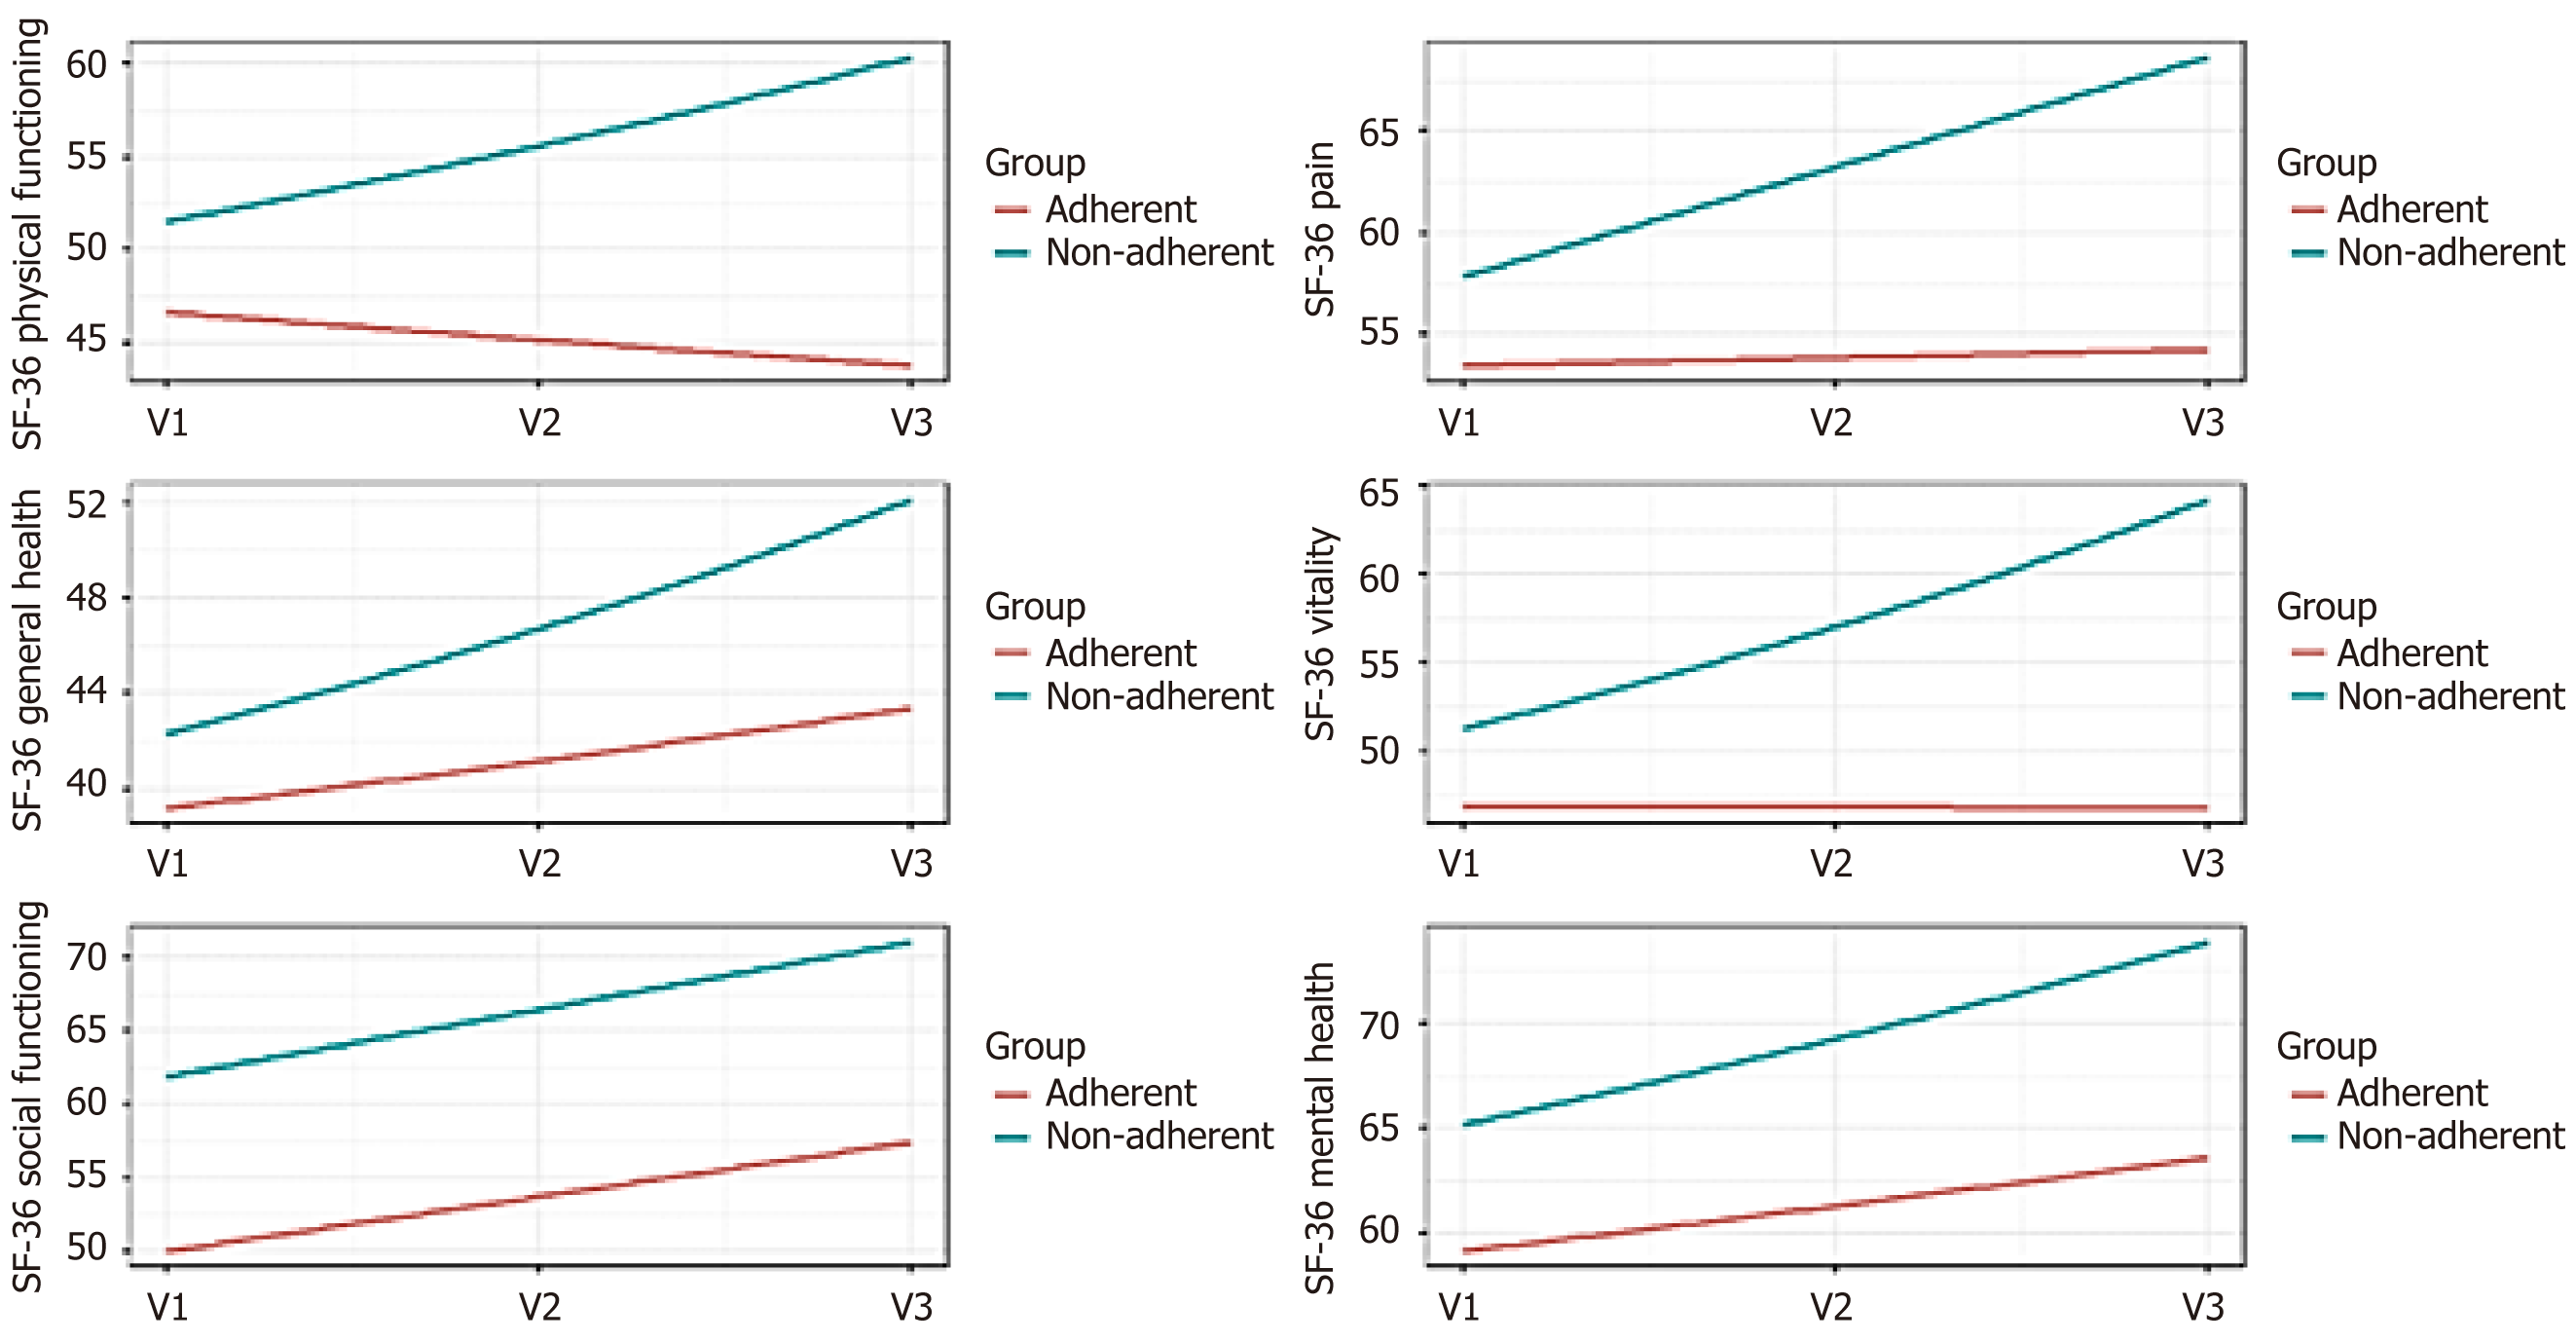
Figure 4 Descriptive trends of 36-Item Short Form Health Survey quality of life domains across study visits in adherent and non-adherent patients.
Each panel represents one domain of the 36-Item Short Form Health Survey questionnaire (Physical Functioning, Pain, General Health, Vitality, Social Functioning, and Mental Health). Adherent participants (red line) showed modest improvements across most domains over time, while non-adherent participants (blue line) exhibited stable or worsening scores. These trends highlight the potential impact of telerehabilitation adherence on perceived quality of life. SF-36: 36-Item Short Form Health Survey.
- Citation: Loschi TM, Baccan MDTA, Pereira EC, Dellabarba TDLC, Boteon APCS, Boteon YL. Telerehabilitation for frail cirrhotic patients awaiting liver transplant: A safe, effective strategy to improve outcomes. World J Hepatol 2025; 17(10): 110856
- URL: https://www.wjgnet.com/1948-5182/full/v17/i10/110856.htm
- DOI: https://dx.doi.org/10.4254/wjh.v17.i10.110856


